

Updated
- Average share of income spent on non-discretionary items
- 54.3%3
- Couples with dependent children, 2024, HILDA survey (single parents: 62.6%)
 How much does it cost to raise a child in Australia in 2026?The estimated cost of one child aged 0 to 12 is $14,902 a year for parents with a combined child support income of $93,137.
 Family payments in AustraliaThe Child Care Subsidy and Additional Child Care Subsidy had estimated Australian Government expenditure of $3.88 billion in the June quarter 2026.
 Cost of living in AustraliaAustralian households spent a combined $923 billion across tracked consumer categories in 2025, up 52% from $606 billion in 2016.
Section 01 · Income
How much income did Australian households with children have in 2019-20?
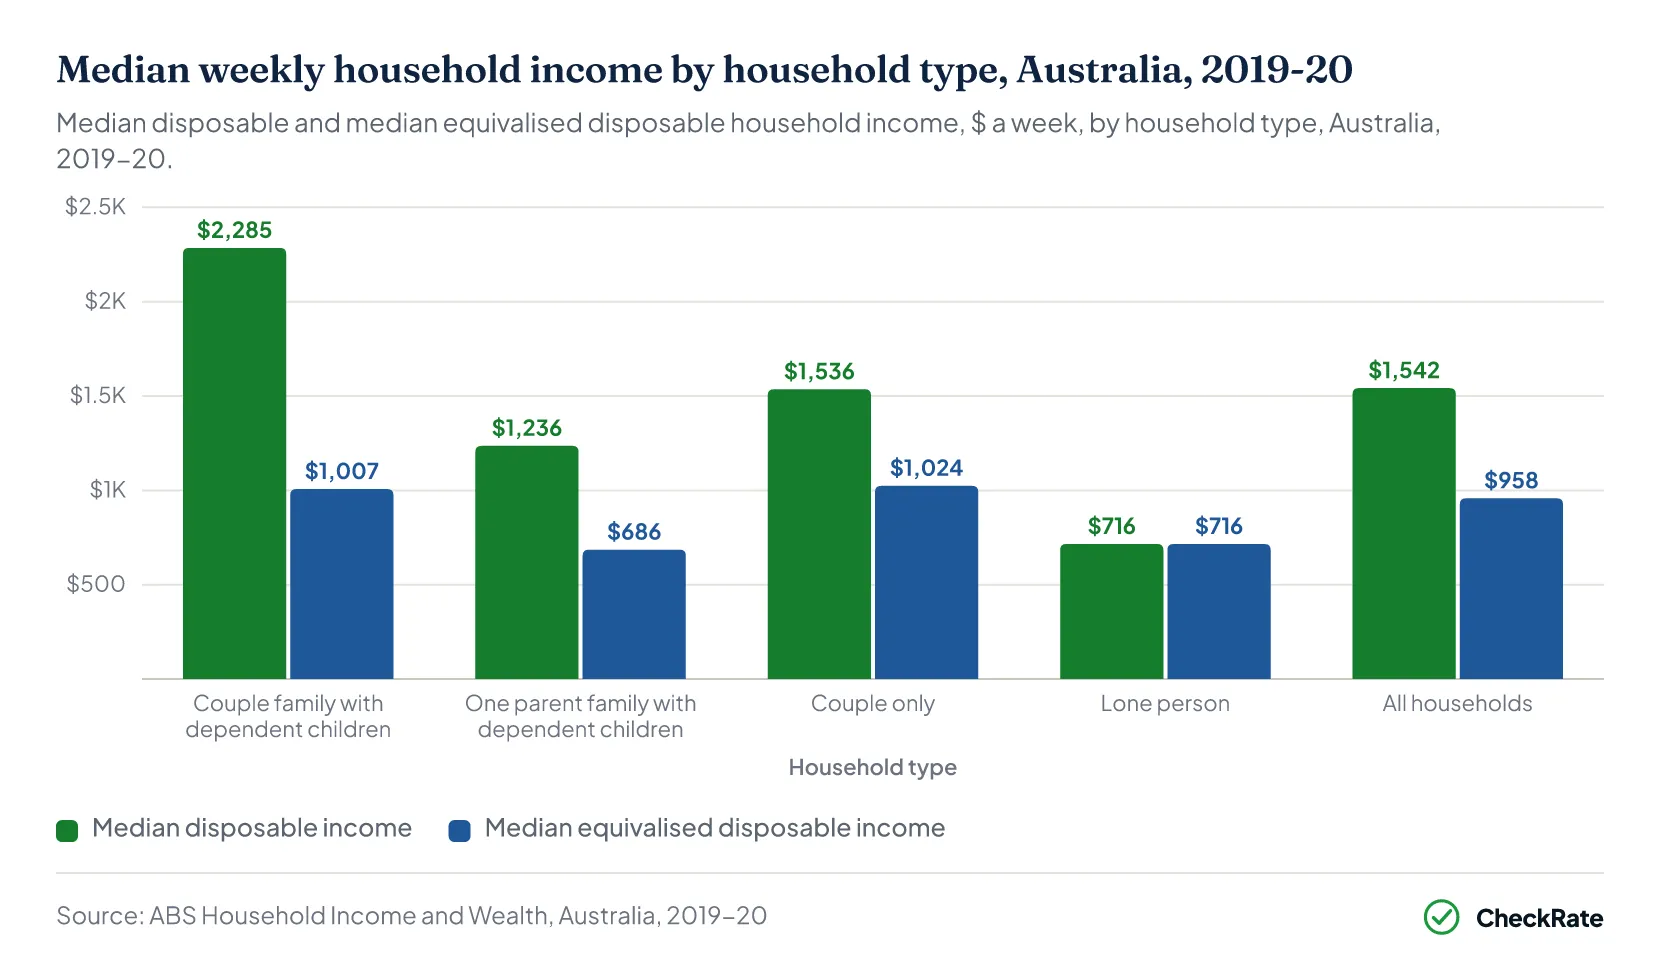
Couple families with dependent children had a median disposable household income of $2,285 a week in 2019-20, according to Australian Bureau of Statistics (ABS) Survey of Income and Housing data5. For one parent families with dependent children, the median was $1,236 a week, compared with $1,542 for all households.
Average (mean) disposable household income was $2,633 a week for couple families with dependent children and $1,432 for one parent families with dependent children in 2019-205. Higher-income households push the average above the median.
Among couple families with dependent children, median disposable household income was higher where the youngest child was aged 15 or over, at $2,511 a week in 2019-20, compared with $2,092 where the youngest child was under 55.
Median disposable household income adjusted for household size (equivalised income) was $1,007 a week for couple families with dependent children in 2019-20, compared with $958 for all households and $686 for one parent families with dependent children5.
Government pensions and allowances were the main source of income for 37.5% of one parent families with dependent children in 2019-20, compared with 6.6% of couple families with dependent children5.
The ABS has not published Survey of Income and Housing results for any year after 2019-20. It did not release results from its 2023-24 survey because of data collection issues6.
| Weekly household income by household type, Australia, 2019-20 | ||||
|---|---|---|---|---|
| Household type | Mean gross | Median gross | Median disposable | Median equivalised disposable |
| Couple with dependent children, youngest under 5 | $3,0861 | $2,5431 | $2,0921 | $9741 |
| Couple with dependent children, youngest 5 to 14 | $3,4061 | $2,7491 | $2,2541 | $1,0441 |
| Couple with dependent children, youngest 15 or over | $3,7631 | $2,9701 | $2,5111 | $1,1171 |
| Couple, dependent and non-dependent children | $4,1871 | $3,4131 | $2,9001 | $1,0431 |
| Couple family with dependent children | $3,3961 | $2,7941 | $2,2851 | $1,0071 |
| One parent family with dependent children | $1,6741 | $1,3271 | $1,2361 | $6861 |
| Couple only | $2,2631 | $1,7151 | $1,5361 | $1,0241 |
| Lone person | $1,1101 | $7501 | $7161 | $7161 |
| All households | $2,3291 | $1,7861 | $1,5421 | $9581 |
Source · ABS, Household Income and Wealth, Australia, 2019-20, Table 9.1.
Based on 2021 Census income bands, the median weekly income of couple families with children fell in the $2,500 to $2,999 range, and 25.5% of those families with stated incomes reported $4,000 or more a week8. The median weekly income of one parent families fell in the $1,000 to $1,249 range, and 18.7% of one parent families with stated incomes reported less than $650 a week.
Census families include children of any age, so Census family incomes are not directly comparable with 2019-20 incomes of families with dependent children.
| Weekly family income by family composition, Australia, 2021 Census | |||||
|---|---|---|---|---|---|
| Family composition | Families | Median range ($ a week) | Less than $650 (%) | $3,000 or more (%) | $4,000 or more (%) |
| Couple family with no children | 2,608,8348 | $1,750 to $1,9998 | 8.88 | 22.38 | 11.08 |
| Couple family with children | 2,944,1408 | $2,500 to $2,9998 | 2.28 | 44.98 | 25.58 |
| One parent family | 1,068,2688 | $1,000 to $1,2498 | 18.78 | 8.38 | 3.88 |
| Other family | 108,9418 | $1,250 to $1,4998 | 11.08 | 11.68 | 4.48 |
| All families | 6,730,1878 | $2,000 to $2,4998 | 7.58 | 29.78 | 16.08 |
Source · ABS, 2021 Census General Community Profile, Australia, Tables G02 and G32.
Section 02 · Spending
How much did Australian households with children spend each week in 2015-16?
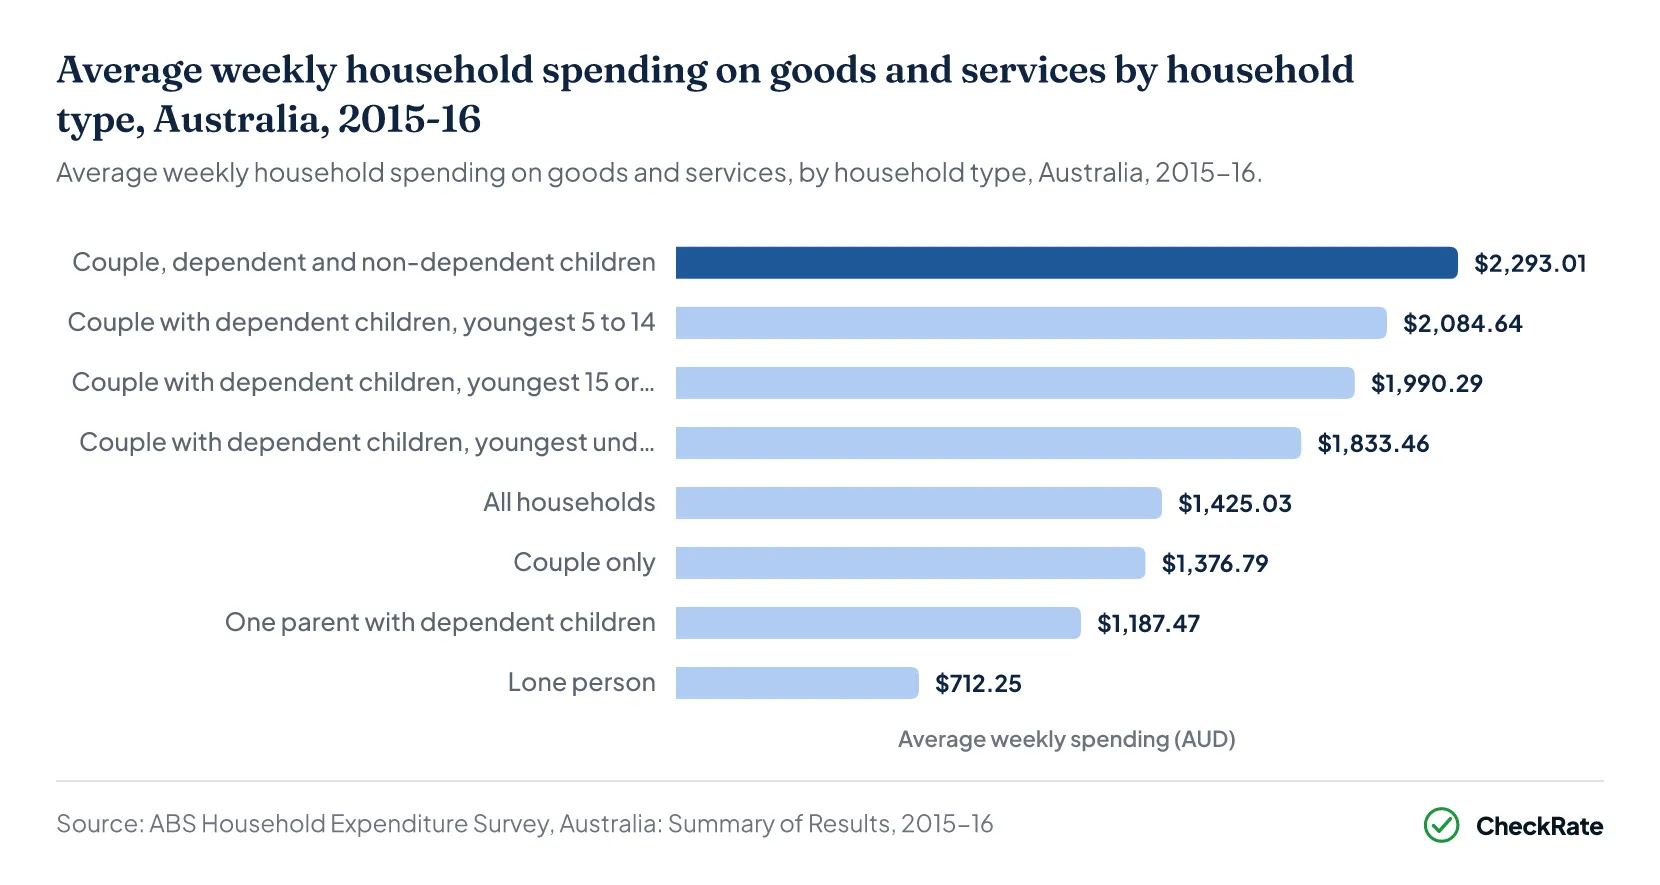
Couple families with dependent children spent an average of $1,991.85 a week on goods and services in 2015-16, according to ABS Household Expenditure Survey data9. One parent families with dependent children spent an average of $1,187.47 a week, compared with $1,425.03 for all households.
Average weekly spending by couple families with dependent children was $1,833.46 where the youngest child was aged under 5, $2,084.64 where the youngest was aged 5 to 14 and $1,990.29 where the youngest was aged 15 or over9. Based on the ABS's published relative standard errors, only the gap between families whose youngest child was under 5 and those whose youngest was aged 5 to 14 is statistically significant.
Average weekly spending on goods and services was equal to 84.2% of average weekly disposable household income for couple families with dependent children in 2015-16, compared with 96.5% for one parent families with dependent children and 83.5% for all households9.
A different survey gives newer figures on a different measure. In its HILDA Statistical Report 2026, the Melbourne Institute at the University of Melbourne reports that couples with dependent children spent an average of 54.3% of their household income on non-discretionary items in 2024, and single parents with dependent children 62.6%3. HILDA's non-discretionary items include rent and mortgage repayments but leave out alcohol, tobacco and meals out, and the survey does not collect some spending, such as on cars, appliances and holidays, so these shares are not comparable with the ABS's 2015-16 spending figures.
Spending on children at each age is covered in the cost of raising a child in Australia.
Section 03 · Spending categories
Which spending categories were largest for Australian families with children?
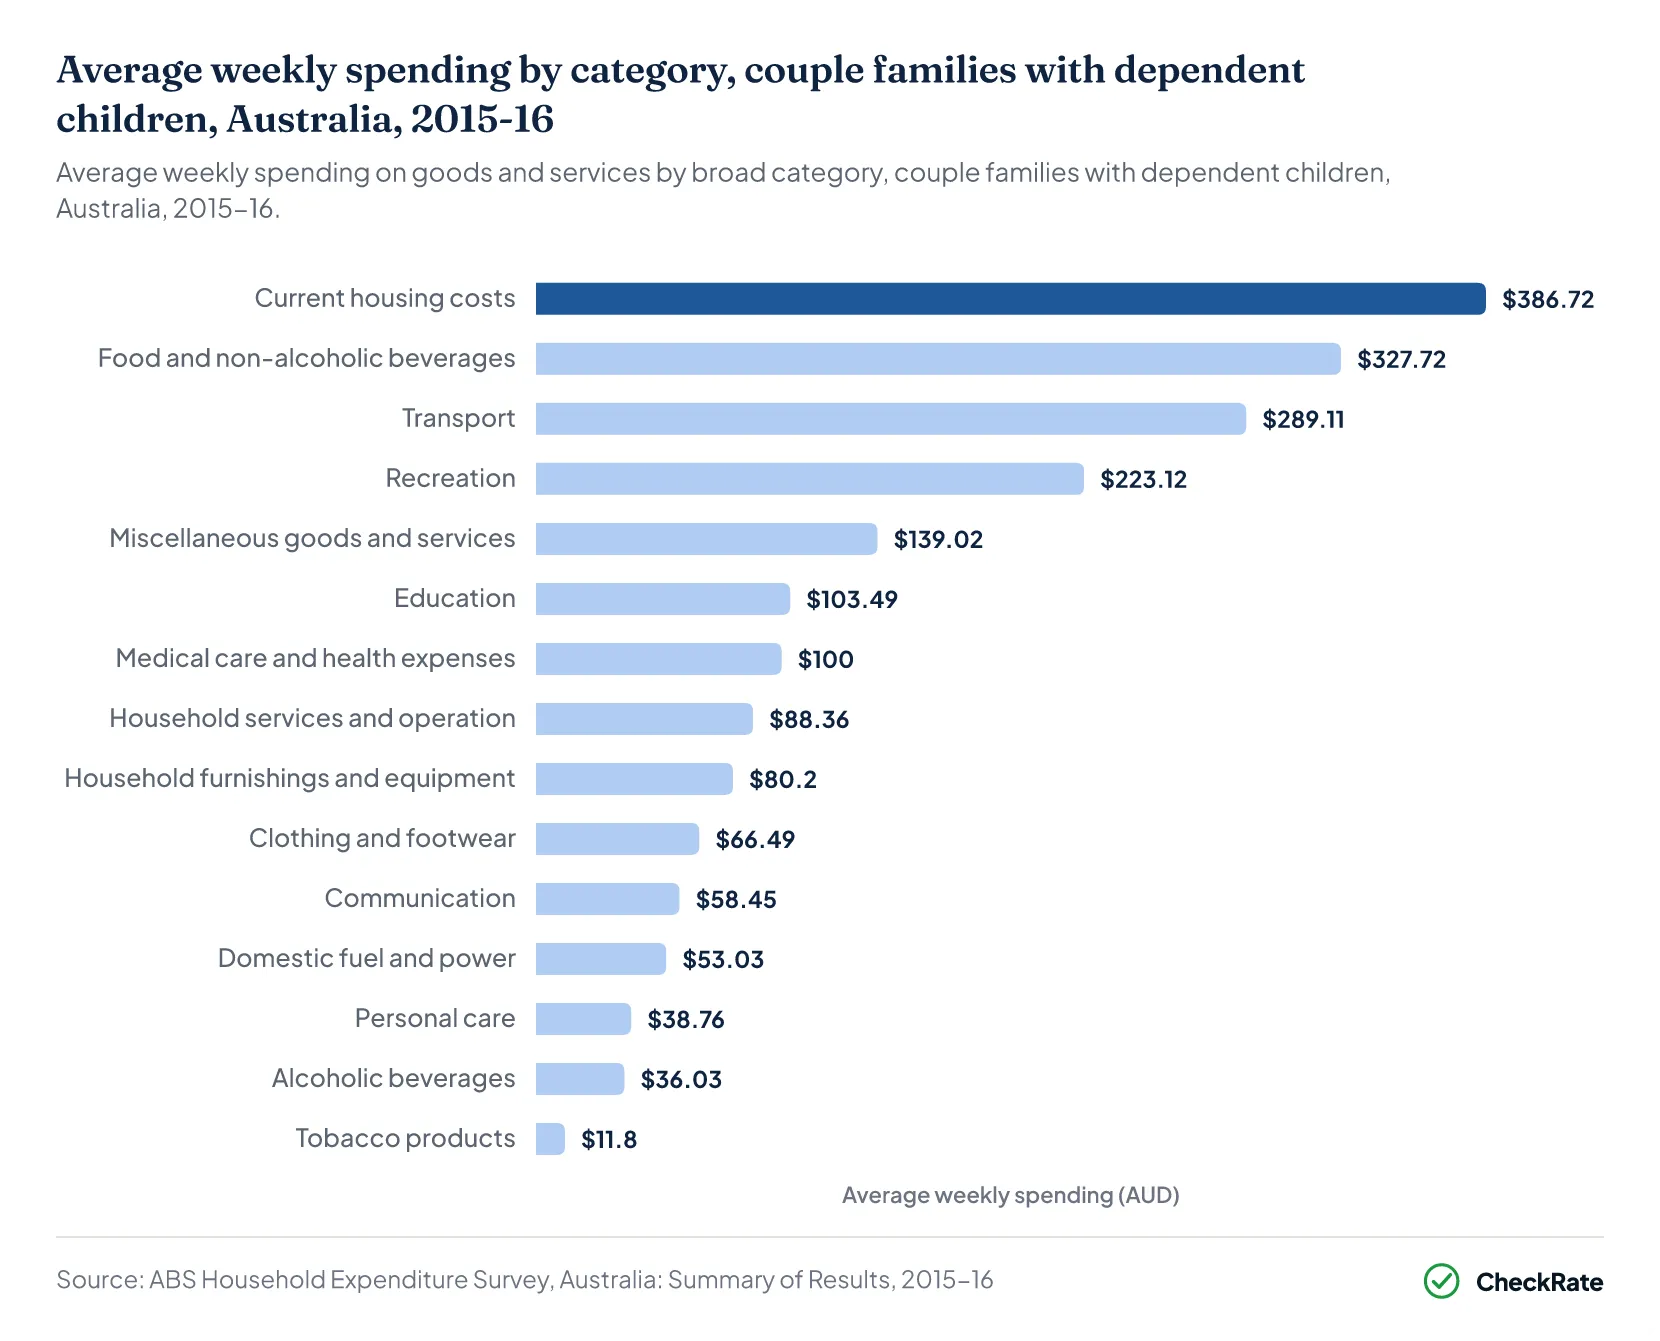
Current housing costs had the highest average weekly spending among the 15 broad spending categories for couple families with dependent children in 2015-16, at $386.72, or 19.4% of goods and services spending, according to ABS Household Expenditure Survey data9.
Food and non-alcoholic beverages accounted for $327.72 a week, or 16.4%, of spending by couple families with dependent children in 2015-169. Transport accounted for $289.11 a week, or 14.5%. Recreation accounted for $223.12 a week, or 11.2%.
Current housing costs accounted for 24.5% of goods and services spending by one parent families with dependent children in 2015-16, at $291.71 a week, compared with 19.6% for all households9.
Couple families whose youngest child was aged 5 to 14 spent an average of $172.41 a week on education in 2015-16, or 8.3% of their goods and services spending9. Primary and secondary school fees accounted for $156.45 of that amount.
Couple families whose youngest child was under 5 spent an average of $114.33 a week on child care services in 2015-169.
How much did Australian families pay for child care in 2019-20?
In 2019-20, 54.2% of households with children aged 0 to 13 used child care, according to ABS Survey of Income and Housing data5. Households using only formal child care (regulated care provided outside the child's home) paid an average of $337 a week before the Child Care Subsidy and $198 after it.
The 2019-20 child care costs include the period of fee-free child care that began on 6 April 20205.
| Average weekly spending by category and household type, Australia, 2015-16 | ||||||
|---|---|---|---|---|---|---|
| Spending category | Couple, dependent children ($) | Share (%) | One parent, dependent children ($) | Share (%) | All households ($) | Share (%) |
| Current housing costs | 386.7210 | 19.410 | 291.7110 | 24.510 | 279.1210 | 19.610 |
| Domestic fuel and power | 53.0310 | 2.710 | 42.5210 | 3.610 | 40.9210 | 2.910 |
| Food and non-alcoholic beverages | 327.7210 | 16.410 | 200.8910 | 16.910 | 236.9710 | 16.610 |
| Alcoholic beverages | 36.0310 | 1.810 | 15.7910 | 1.310 | 31.9510 | 2.210 |
| Tobacco products | 11.8010 | 0.610 | 13.4010 | 1.110 | 12.8410 | 0.910 |
| Clothing and footwear | 66.4910 | 3.310 | 41.0210 | 3.410 | 43.7510 | 3.110 |
| Household furnishings and equipment | 80.2010 | 4.010 | 49.2810 | 4.110 | 57.8710 | 4.110 |
| Household services and operation | 88.3610 | 4.410 | 44.1110 | 3.710 | 44.9010 | 3.210 |
| Medical care and health expenses | 100.0010 | 5.010 | 55.6210 | 4.710 | 82.3810 | 5.810 |
| Transport | 289.1110 | 14.510 | 134.9710 | 11.410 | 206.6910 | 14.510 |
| Communication | 58.4510 | 2.910 | 45.7810 | 3.810 | 46.6210 | 3.310 |
| Recreation | 223.1210 | 11.210 | 109.1910 | 9.210 | 171.8510 | 12.110 |
| Education | 103.4910 | 5.210 | 42.6710 | 3.610 | 43.8610 | 3.110 |
| Personal care | 38.7610 | 1.910 | 26.3310 | 2.210 | 28.6410 | 2.010 |
| Miscellaneous goods and services | 139.0210 | 7.010 | 63.8510 | 5.410 | 97.0810 | 6.810 |
| Total goods and services | 1,991.8510 | 100.010 | 1,187.4710 | 100.010 | 1,425.0310 | 100.010 |
Source · ABS, Household Expenditure Survey, Australia: Summary of Results, 2015-16, Table 9.1.
Rent and mortgage costs for families are covered in housing costs for Australian families.
Section 04 · Debt
How much debt did Australian households with children have in 2019-20?
Couple families with dependent children had an average total household debt of $404,600 in 2019-20, compared with $115,200 for one parent families with dependent children and $203,800 for all households, according to ABS Survey of Income and Housing data5.
Owner-occupier loans accounted for $236,000 of the average total debt of couple families with dependent children in 2019-20, while loans for other properties accounted for $134,2005. Households with large loans can increase the average, and the ABS does not publish median debt amounts by household type.
Debt of any kind was reported by 91.4% of couple families with dependent children and 73.7% of one parent families with dependent children in 2019-205.
Among couple families with dependent children, 63.0% owned a home with a mortgage in 2019-20, while 58.5% of one parent families with dependent children rented5.
Among couple families with dependent children that had debt, the median ratio of debt to annual disposable household income was 2.52 in 2019-20, compared with 0.53 for one parent families with dependent children that had debt and 1.09 for all households with debt5.
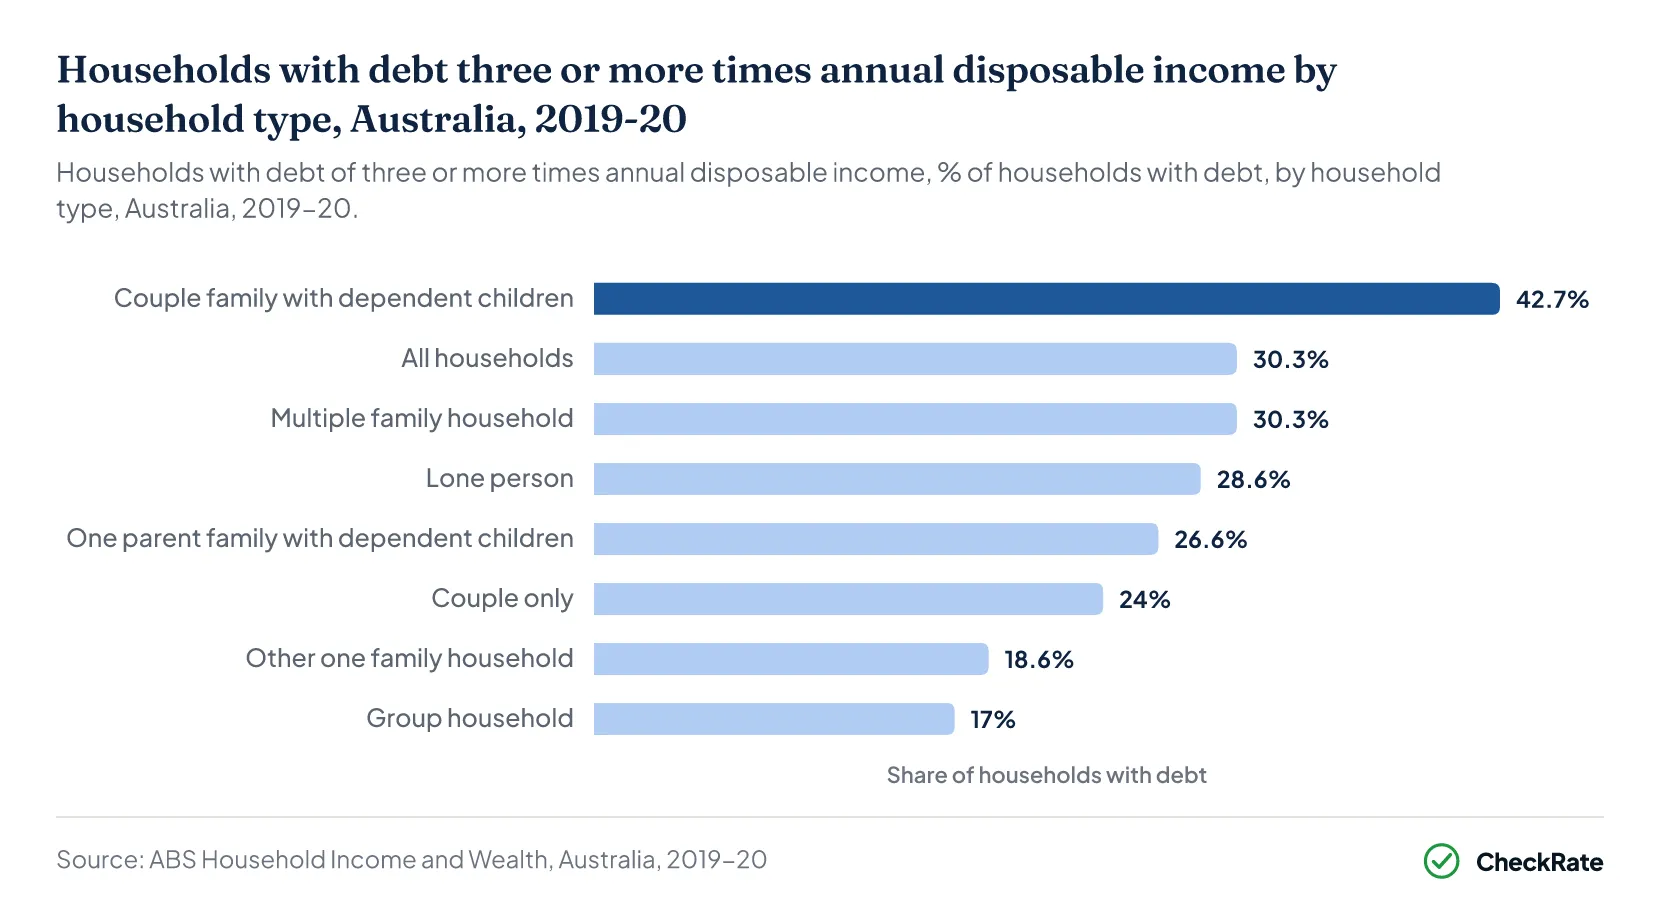
Of couple families with dependent children that had debt, 42.7% owed at least three times their annual disposable household income in 2019-20, compared with 30.3% of all households with debt and 26.6% of one parent families with dependent children that had debt5.
Across all Australian households, household debt was equivalent to 178.4% of annual household disposable income in the June quarter 2026, according to the Reserve Bank of Australia11. That ratio is not published by family type.
| Household debt by household type, Australia, 2019-20 | |||||
|---|---|---|---|---|---|
| Household type | With debt (%) | Mean total debt | Mean owner-occupier loan | Median debt-to-income ratio | Debt three times income or more (%) |
| Couple family with dependent children | 91.44 | $404,6001 | $236,0001 | 2.524 | 42.74 |
| One parent family with dependent children | 73.74 | $115,2001 | $75,0001 | 0.534 | 26.64 |
| Couple only | 73.24 | $154,6001 | $85,4001 | 0.464 | 24.04 |
| Lone person | 54.04 | $75,1001 | $46,4001 | 0.524 | 28.64 |
| All households | 74.64 | $203,8001 | $114,7001 | 1.094 | 30.34 |
Source · ABS, Household Income and Wealth, Australia, 2019-20, Tables 3.3, 3.5 and 9.2.
Debt across all households is covered in how much debt Australian households have.
Section 05 · Saving
How much did Australian households with children save in 2019-20?
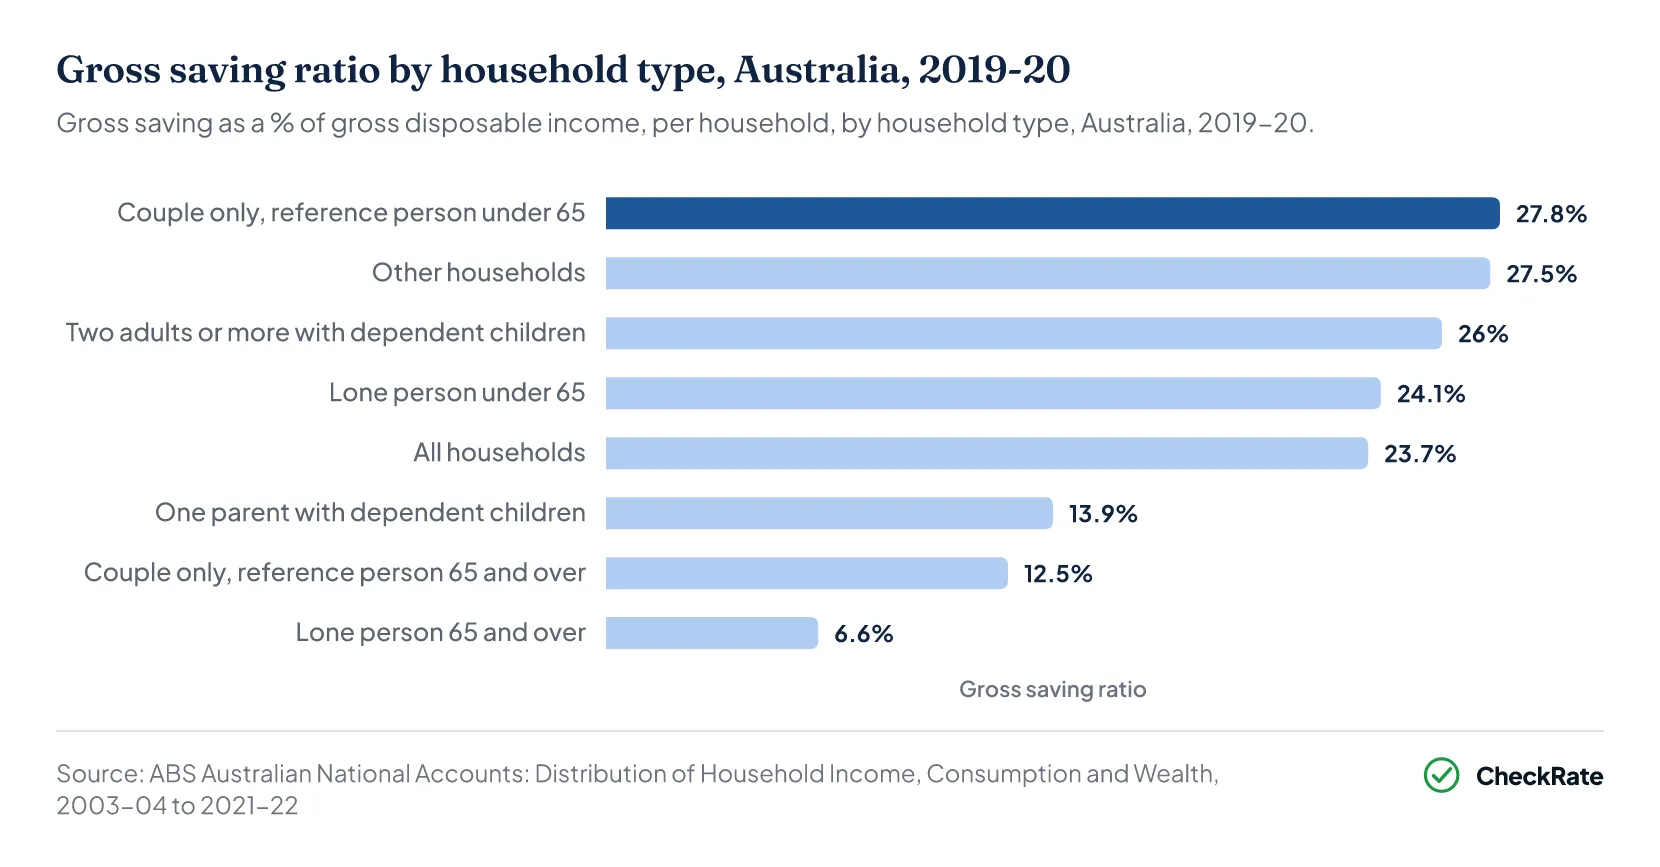
Households of two or more adults with dependent children had average annual gross saving of $46,405 per household in 2019-20, equivalent to 26.0% of their gross disposable income, according to ABS national accounts estimates12.
One parent households with dependent children had annual gross saving of $12,907 per household in 2019-20, equivalent to 13.9% of gross disposable income, compared with $30,417, or 23.7%, for all households12.
Gross saving is gross disposable income minus household spending on goods and services (final consumption expenditure).
Couple families with dependent children had an average balance of $55,500 in accounts with financial institutions, excluding offset accounts, and $30,600 in offset accounts in 2019-20, according to ABS Survey of Income and Housing data5. One parent families with dependent children had average balances of $27,700 and $7,100 respectively.
Median household net worth was $699,600 for couple families with dependent children and $151,000 for one parent families with dependent children in 2019-20, compared with $579,200 for all households5.
One parent families with dependent children accounted for 6.1% of all households in 2019-20 but made up 21.7% of households that reported four or more signs of financial stress in the previous 12 months5.
| Income, consumption and saving per household by household type, Australia, 2019-20 | ||||
|---|---|---|---|---|
| Household type | Gross disposable income | Final consumption | Gross saving | Saving ratio (%) |
| Lone person under 65 | $77,64313 | $58,90213 | $18,74113 | 24.1 |
| Lone person 65 and over | $50,93213 | $47,57013 | $3,36213 | 6.6 |
| One parent with dependent children | $92,71413 | $79,80713 | $12,90713 | 13.9 |
| Couple only, reference person under 65 | $150,56013 | $108,72013 | $41,84013 | 27.8 |
| Couple only, reference person 65 and over | $108,12113 | $94,59013 | $13,53113 | 12.5 |
| Two adults or more with dependent children | $178,37613 | $131,97113 | $46,40513 | 26.0 |
| Other households | $155,89013 | $113,08313 | $42,80713 | 27.5 |
| All households | $128,07713 | $97,66013 | $30,41713 | 23.7 |
Source · ABS, Australian National Accounts: Distribution of Household Income, Consumption and Wealth, 2003-04 to 2021-22, Table 3.9.
Saving across all households is covered in Australian savings statistics.
Section 06 · Employment
What share of Australian families with children had employed parents in June 2025?
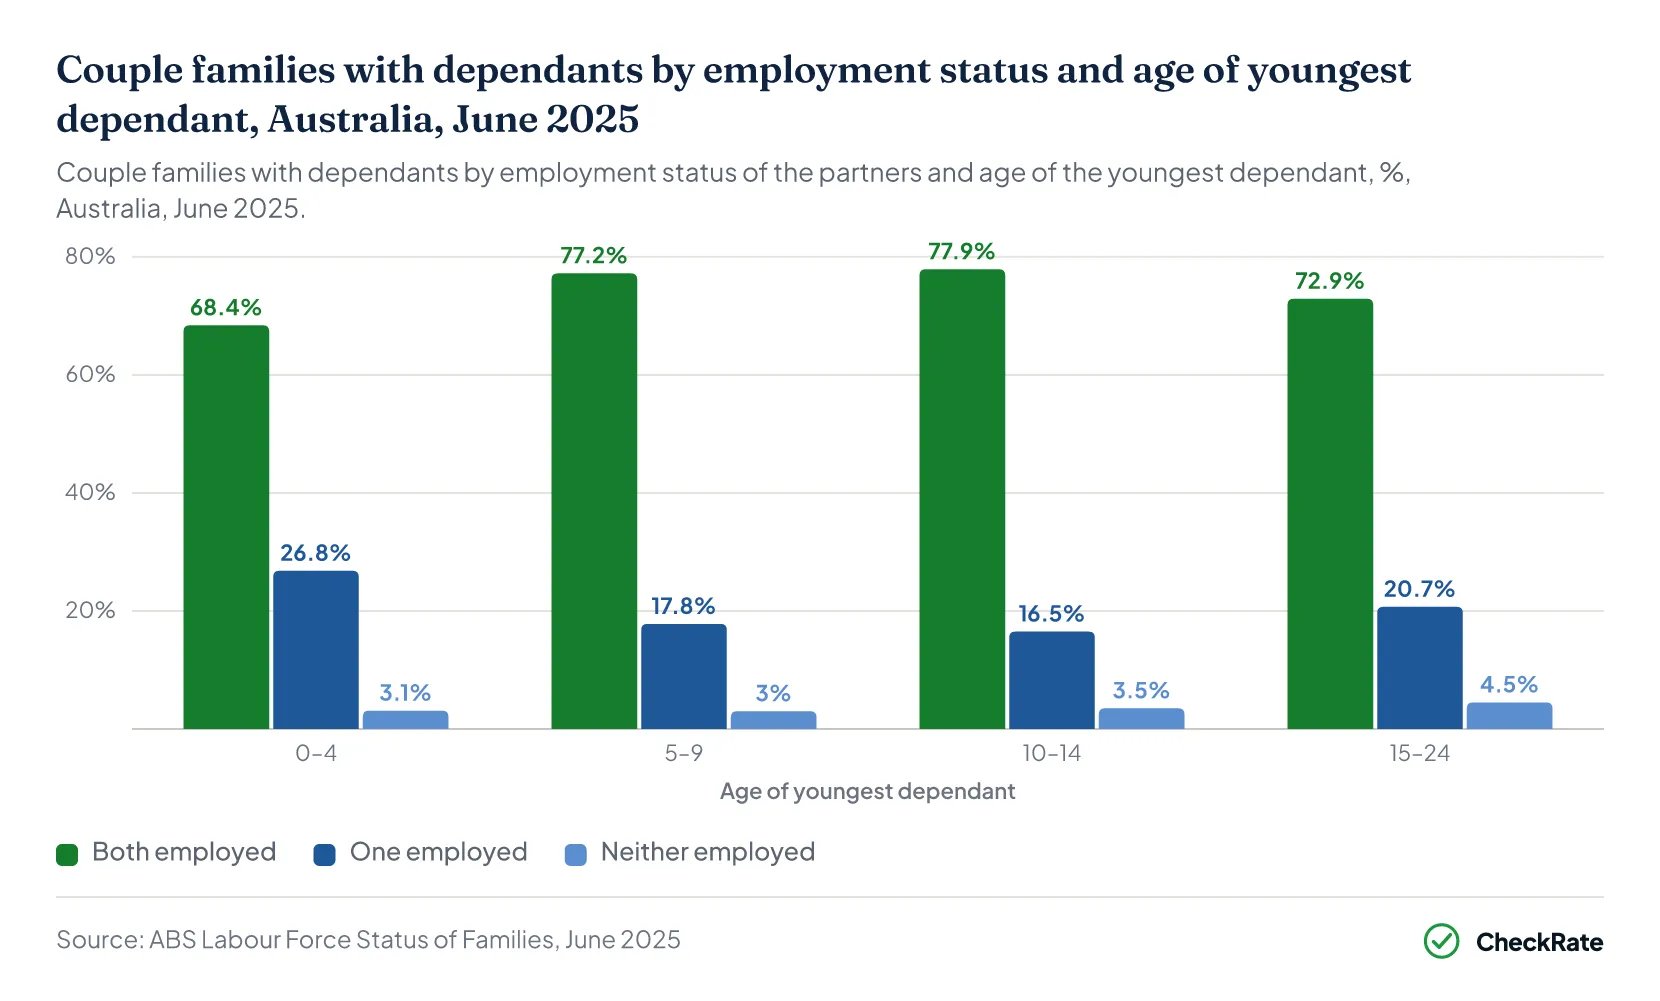
Both partners were employed in 73.2% of the 2.2 million couple families with children aged 0 to 14 in June 2025, according to ABS Labour Force Status of Families data2. One partner was employed in 21.7% of those families, and neither partner was employed in 3.2%.
Both partners were employed in 68.4% of couple families whose youngest dependent child was aged 0 to 4, compared with 77.2% where the youngest was aged 5 to 9 and 77.9% where the youngest was aged 10 to 142.
In June 2025, the wife or partner was employed in 71.2% of couple families whose youngest dependent child was aged 0 to 4, compared with 82.2% where the youngest was aged 5 to 92. The husband or partner was employed in 92.4% of couple families whose youngest child was aged 0 to 4.
Among the 752,000 one parent families with dependants in June 2025, 72.9% had an employed parent2. In one parent families headed by a mother, the mother was employed in 61.0% of families whose youngest child was aged 0 to 4, compared with 66.0% where the youngest child was aged 5 to 9.
Families in which no member aged 15 or over was employed (jobless families) accounted for 22% of one parent families with dependants and 3% of couple families with dependants in June 20252.
In 2019-20, couple families with dependent children that had two or more employed members had average gross household income of $3,833 a week, compared with $2,420 for those with one employed member, according to ABS Survey of Income and Housing data5. One parent families with dependent children had average gross household income of $1,777 a week with one employed member and $837 where no member was in the labour force.
| One parent families with dependants with an employed parent, by age of youngest dependant, Australia, June 2025 | ||
|---|---|---|
| Age of youngest dependant | Single mother employed (%) | Single father employed (%) |
| 0–4 years | 61.014 | 83.514 |
| 5–9 years | 66.014 | 73.414 |
| 10–14 years | 78.814 | 81.314 |
| 15–24 years | 77.514 | 83.714 |
Source · ABS, Labour Force Status of Families, June 2025, Table 9.1.
Section 07 · Over time
How have employment, debt and saving changed for Australian families with children?
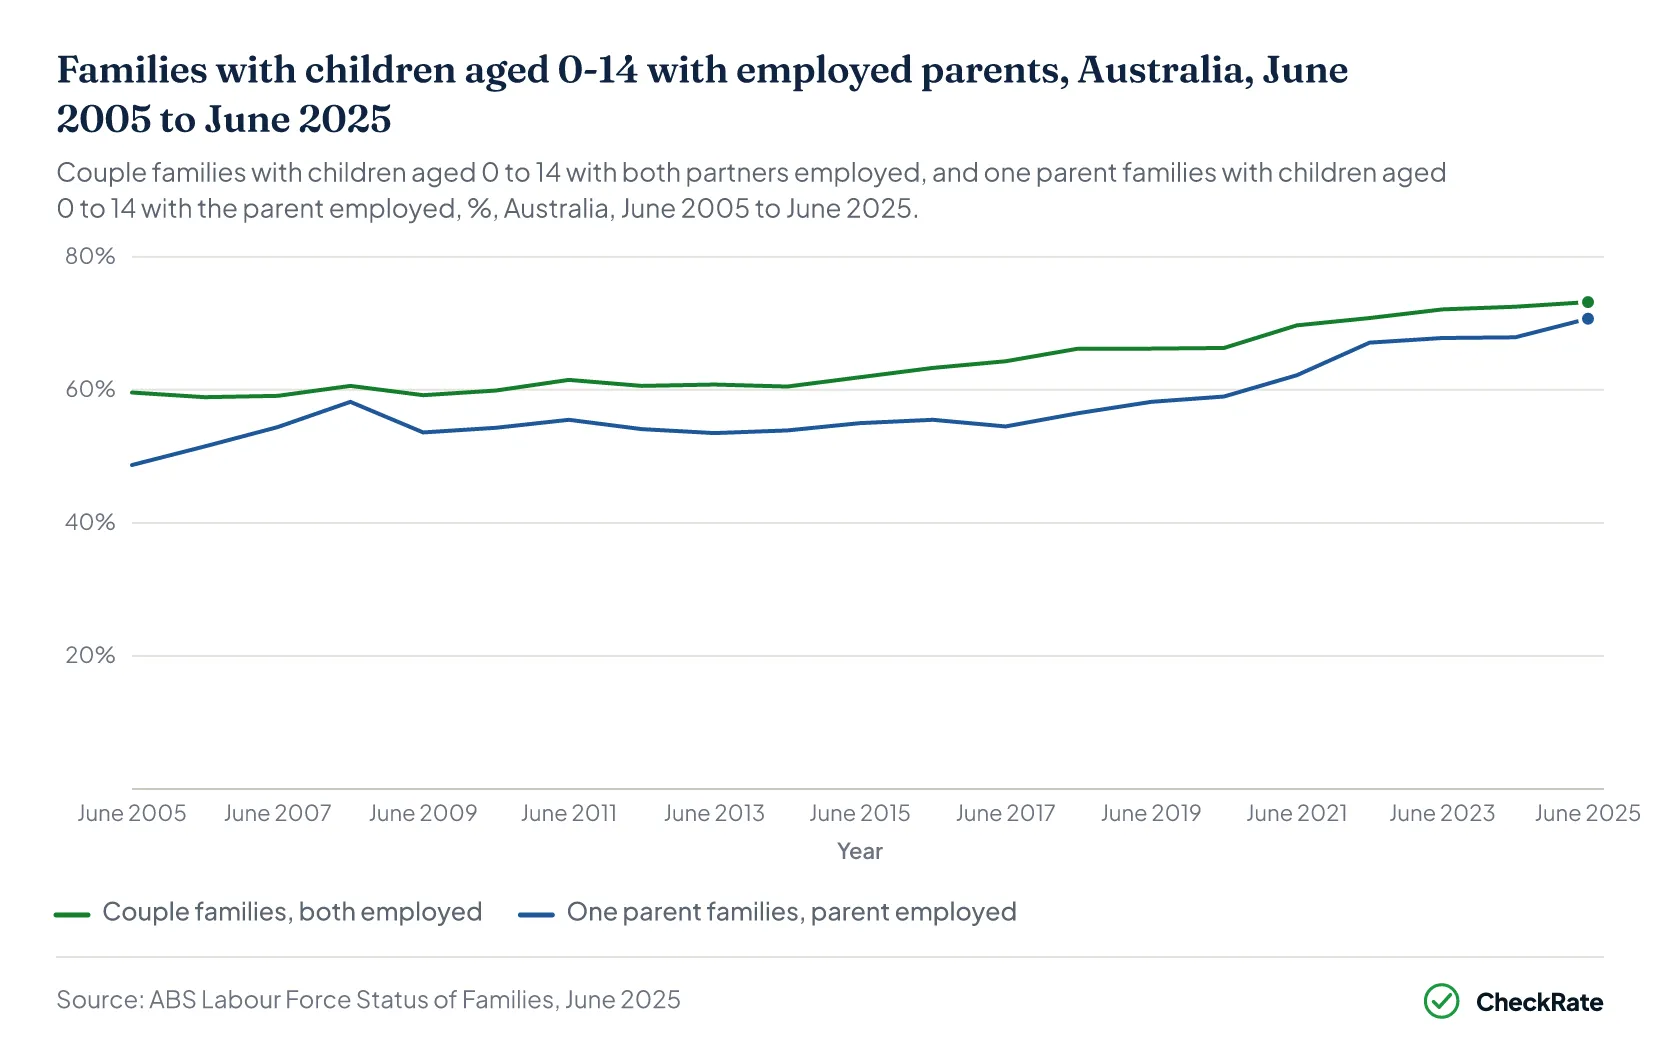
The share of couple families with children aged 0 to 14 where both partners were employed rose from 59.6% in June 2005 to 73.2% in June 2025, according to ABS Labour Force Status of Families data2. The share of one parent families with children aged 0 to 14 where the parent was employed rose from 48.7% in June 2005 to 70.7% in June 2025.
Among couple families with dependent children that had debt, the share owing at least three times their annual disposable income rose from 30.8% in 2009-10 to 42.7% in 2019-20, according to ABS Survey of Income and Housing data5. Their median debt-to-income ratio rose from 1.83 to 2.52 over the period.
Among one parent families with dependent children that had debt, the share owing at least three times their annual disposable income was 21.2% in 2009-10 and 26.6% in 2019-205. However, the published margins of error for the two years overlap, so the difference is uncertain.
| Debt-to-income measures for households with debt, by household type, Australia, 2009-10 to 2019-20 | ||||||
|---|---|---|---|---|---|---|
| Household type and measure | 2009-10 | 2011-12 | 2013-14 | 2015-16 | 2017-18 | 2019-20 |
| Couple family with dependent children, three times income (%) | 30.84 | 30.34 | 33.74 | 37.14 | 40.44 | 42.74 |
| One parent family with dependent children, three times income (%) | 21.24 | 23.94 | 22.84 | 25.34 | 27.54 | 26.64 |
| All households, three times income (%) | 24.24 | 24.44 | 26.04 | 27.24 | 28.44 | 30.34 |
| Couple family with dependent children, median ratio | 1.834 | 1.844 | 2.044 | 2.184 | 2.414 | 2.524 |
| One parent family with dependent children, median ratio | 0.494 | 0.544 | 0.534 | 0.614 | 0.654 | 0.534 |
| All households, median ratio | 0.894 | 0.944 | 0.894 | 1.014 | 1.104 | 1.094 |
Source · ABS, Household Income and Wealth, Australia, 2019-20, Table 3.5.
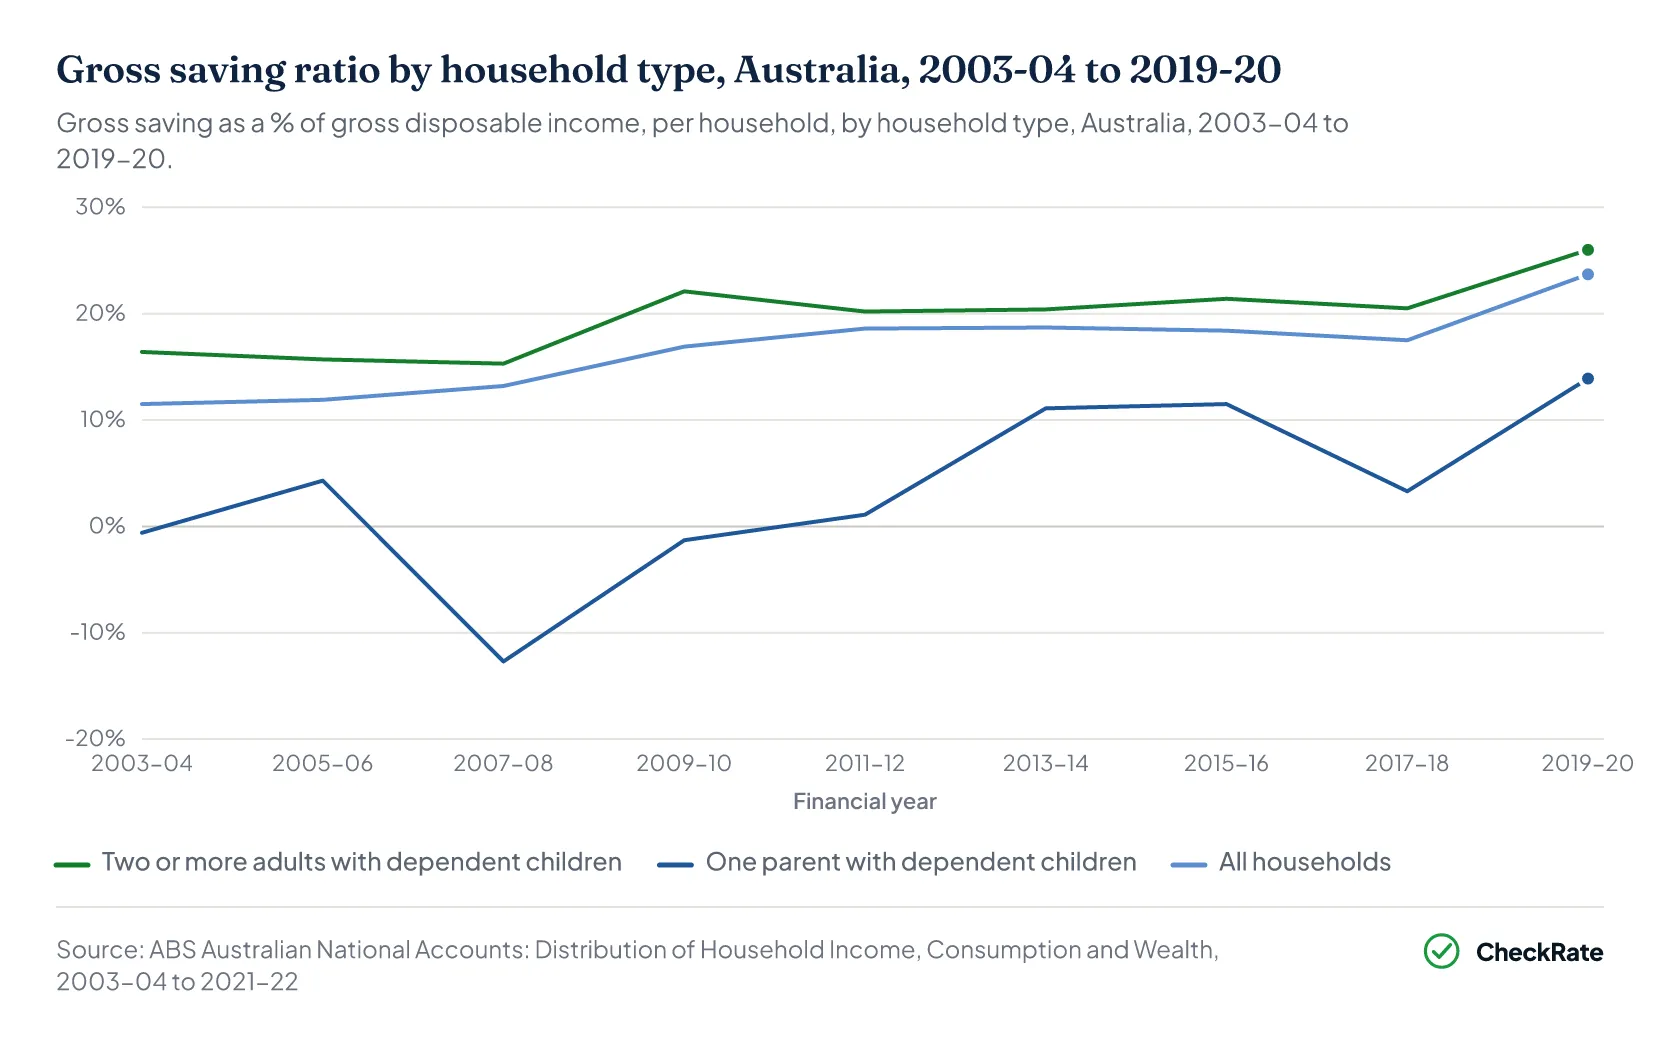
Gross saving as a share of gross disposable income rose from 16.4% in 2003-04 to 26.0% in 2019-20 for households with two or more adults and dependent children, according to ABS national accounts estimates12.
One parent households with dependent children had negative gross saving equal to 0.6% of gross disposable income in 2003-04 and positive gross saving equal to 13.9% in 2019-2012. Their gross saving was negative in 2003-04, 2007-08 and 2009-10.
Section 08 · Common questions
Family household finances: quick answers
What is the median income of Australian families with children?
Couple families with dependent children had a median disposable household income of $2,285 a week in 2019-20, compared with $1,236 for one parent families with dependent children, according to the Australian Bureau of Statistics5. Based on 2021 Census income bands, the median weekly income of couple families with children of any age fell in the $2,500 to $2,999 range8.
How much does a family with children spend each week in Australia?
Couple families with dependent children spent an average of $1,991.85 a week on goods and services in 2015-16, according to the Australian Bureau of Statistics9. One parent families with dependent children spent an average of $1,187.47 a week, compared with $1,425.03 for all households.
How much do Australian families spend on child care?
Couple families whose youngest child was aged under 5 spent an average of $114.33 a week on child care services in 2015-16, according to the Australian Bureau of Statistics9. In 2019-20, households using only formal child care paid a mean of $198 a week after the Child Care Subsidy5. This figure includes the fee-free child care period that began on 6 April 2020.
How much debt do Australian families with children have?
Couple families with dependent children had average total household debt of $404,600 in 2019-20, according to the Australian Bureau of Statistics5. Among those with debt, the median ratio of debt to annual disposable household income was 2.52.
References
- ABS, Household Income and Wealth, Australia, 2019-20, Table 9 Household composition (data cube) · Australian Bureau of Statistics ↑ b c d e f g h i j k l m n o p q r s t u v w x y z a2 b2 c2 d2 e2 f2 g2 h2 i2 j2 k2 l2 m2 n2 o2 p2 q2 r2 s2 t2 u2 v2 w2
- ABS, Labour Force Status of Families, June 2025 · Australian Bureau of Statistics ↑ b c d e f g h i
- Melbourne Institute, University of Melbourne: HILDA Statistical Report 2026 (Selected Findings from Waves 1 to 24) · melbourneinstitute.unimelb.edu.au ↑ b
- ABS, Household Income and Wealth, Australia, 2019-20, Table 3 Income, wealth and debt (data cube) · Australian Bureau of Statistics ↑ b c d e f g h i j k l m n o p q r s t u v w x y z a2 b2 c2 d2 e2 f2 g2 h2 i2 j2 k2 l2 m2 n2 o2 p2 q2 r2 s2 t2 u2 v2 w2 x2 y2 z2 a3 b3
- ABS Household Income and Wealth, Australia, 2019-20 · Australian Bureau of Statistics ↑ b c d e f g h i j k l m n o p q r s t u v w x
- ABS media statement, Survey of Income and Housing results will not be released · Australian Bureau of Statistics ↑
- ABS, Household Income and Wealth, Australia methodology, 2019-20 · Australian Bureau of Statistics
- ABS, 2021 Census General Community Profile · Australian Bureau of Statistics ↑ b c d e f g h i j k l m n o p q r s t u v w x y z a2 b2
- ABS, Household Expenditure Survey, Australia: Summary of Results, 2015–16 · Australian Bureau of Statistics ↑ b c d e f g h i j k
- ABS, Household Expenditure Survey, Australia: Summary of Results, 2015–16, Household composition data cube (65300DO009) · Australian Bureau of Statistics ↑ b c d e f g h i j k l m n o p q r s t u v w x y z a2 b2 c2 d2 e2 f2 g2 h2 i2 j2 k2 l2 m2 n2 o2 p2 q2 r2 s2 t2 u2 v2 w2 x2 y2 z2 a3 b3 c3 d3 e3 f3 g3 h3 i3 j3 k3 l3 m3 n3 o3 p3 q3 r3 s3 t3 u3 v3 w3 x3 y3 z3 a4 b4 c4 d4 e4 f4 g4 h4 i4 j4 k4 l4 m4 n4 o4 p4 q4 r4
- RBA, Statistical Table E2, Household Finances, Selected Ratios · Reserve Bank of Australia ↑
- ABS, Australian National Accounts: Distribution of Household Income, Consumption and Wealth, 2021-22 financial year · Australian Bureau of Statistics ↑ b c d e
- ABS, Australian National Accounts: Distribution of Household Income, Consumption and Wealth, 2021-22, Table 3 per household (data cube) · Australian Bureau of Statistics ↑ b c d e f g h i j k l m n o p q r s t u v w x
- ABS, Labour Force Status of Families, June 2025, Table 9 Families by characteristics of parents and age of youngest dependent child (data cube) · Australian Bureau of Statistics ↑ b c d e f g h