

Updated
 Family finances in Australia: income, spending and debt for households with childrenCouple families with dependent children had a median disposable household income of $2,285 a week in 2019-20, according to Australian Bureau of Statistics (ABS) Survey of Income and Housing data. For…
 How much does it cost to raise a child in Australia in 2026?The estimated cost of one child aged 0 to 12 is $14,902 a year for parents with a combined child support income of $93,137, according to 2026 child support cost estimates from the Department of Social…
 Family payments in Australia: Child Care Subsidy, Parental Leave Pay and Family Tax BenefitThe Child Care Subsidy and Additional Child Care Subsidy had estimated Australian Government expenditure of $3.88 billion in the June quarter 2026, when 989,100 families used approved child care…
Section 01 · Housing costs
How do housing costs for Australian families with children compare with other households?
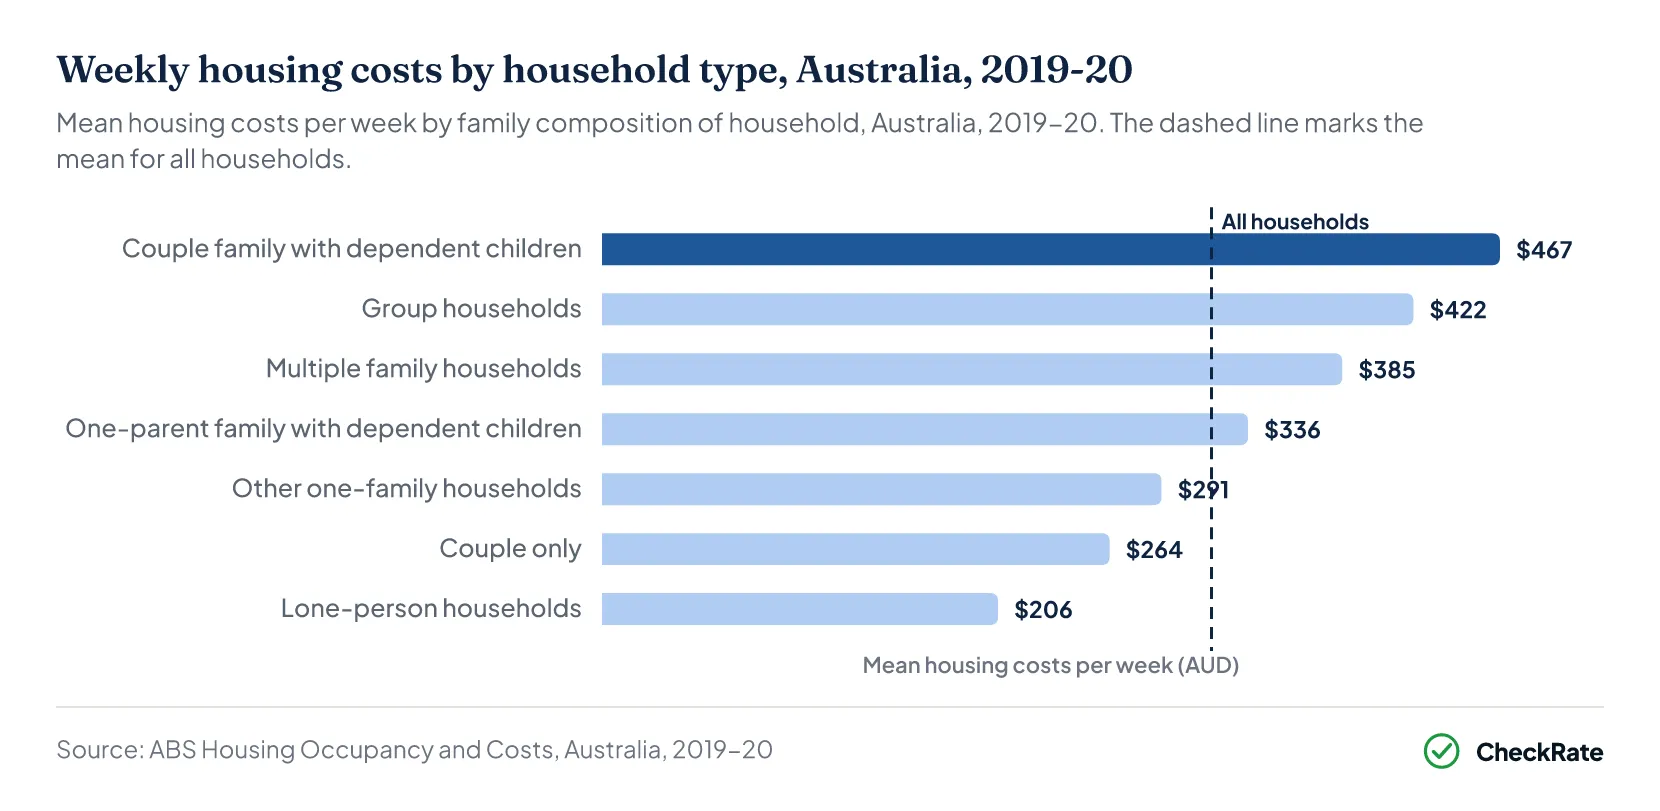
Couple families with dependent children recorded the highest mean housing costs of any household type in Australia in 2019-20, at $467 a week, according to the Australian Bureau of Statistics (ABS) Survey of Income and Housing1. One-parent families with dependent children had mean housing costs of $336 a week, compared with $317 for all households. Lone-person households recorded the lowest mean housing costs of any household type, at $206 a week.
Median housing costs were $421 a week for couple families with dependent children, $336 for one-parent families with dependent children and $273 for all households1. Owners without a mortgage had mean housing costs of $54 a week in 2019-20. This helps explain why households with more mortgage-free owners can have a much lower median housing cost than the average. Couple-only households had mean housing costs of $264 a week and median housing costs of $111, with 43.6% owning their home without a mortgage31.
Couple families with dependent children accounted for 26.4% of the 9.7 million households in Australia in 2019-20, compared with 6.1% for one-parent families with dependent children3.
Dependent children are children under 15 and full-time students aged 15 to 24 who live with a parent and have no partner or child of their own in the household6.
| Mean and median weekly housing costs by household type, Australia, 2019-20 | |||
|---|---|---|---|
| Household type | Mean ($ a week) | Median ($ a week) | RSE of mean (%) |
| Couple family with dependent children | $4671 | $4211 | 2.01 |
| One-parent family with dependent children | $3361 | $3361 | 2.91 |
| Couple only | $2641 | $1111 | 1.91 |
| Other one-family households | $2911 | $2181 | 3.51 |
| Multiple family households | $3851 | $3811 | 7.21 |
| Lone-person households | $2061 | $1141 | 2.01 |
| Group households | $4221 | $4501 | 4.11 |
| All households | $3171 | $2731 | 1.11 |
Source · ABS, Housing Occupancy and Costs, Australia, 2019-20, Tables 3.1 and 3.2.
Spending on children beyond housing is covered in the cost of raising a child article.
Section 02 · Mortgages
How much are mortgage repayments for couple families and single-parent families in Australia?
The median monthly mortgage repayment for couple families with children under 15 was in the $2,000 to $2,199 range at the August 2021 Census, according to ABS Census data8. One-parent families with children under 15 had a median monthly mortgage repayment of $1,600 to $1,799, compared with $1,800 to $1,999 for couple families with no children.
Couple families with no children under 15, including those whose children were all aged 15 or over, had a median monthly mortgage repayment in the $1,800 to $1,999 range. For one-parent families with no children under 15, the median was $1,400 to $1,5998. Across all 2,646,197 families that stated a repayment, the median monthly mortgage repayment was in the $1,800 to $1,999 range.
The Census records mortgage repayments in ranges rather than exact amounts. The median is therefore the range containing the middle family.
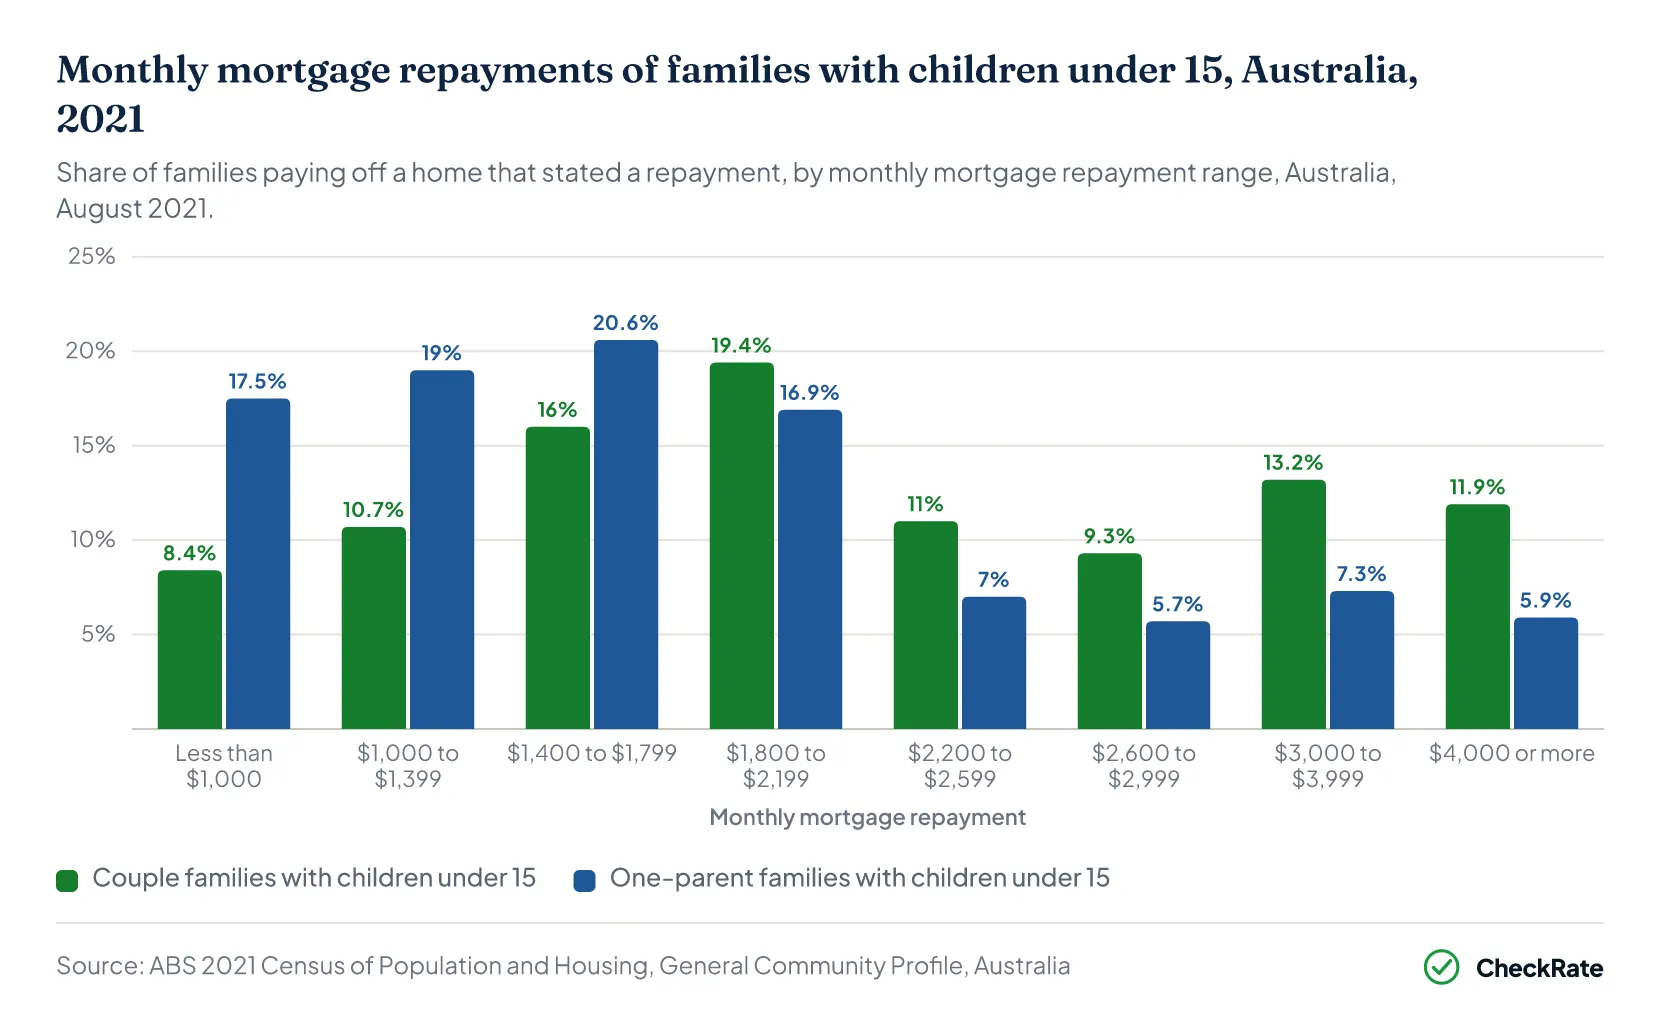
Among couple families with children under 15 paying off a home, 25.2% repaid $3,000 or more a month, compared with 13.2% of one-parent families with children under 158. At the other end of the range, 8.4% of couple families and 17.5% of one-parent families with children under 15 repaid less than $1,000 a month.
In 2019-20, couple families with dependent children that owned their home with a mortgage had mean housing costs of $554 a week, compared with $409 for one-parent families with dependent children1.
The 2019-20 figures count households and dependent children, while the Census figures cover families and children under 15, so the two are not directly comparable.
The Reserve Bank of Australia (RBA) cash rate target was 0.10%4 on Census night, 10 August 20219, and the first increase after the Census took effect on 4 May 20224. The cash rate target has been 4.85% since 4 November 2026. The average interest rate on outstanding owner-occupier housing loans rose from 2.78% in August 2021 to 6.20% in September 2026, according to the RBA10.
| Monthly mortgage repayments by family type, Australia, August 2021 | ||||
|---|---|---|---|---|
| Family type | Families | Median range | $3,000 or more (%) | Less than $1,000 (%) |
| Couple family with no children | 722,6878 | $1,800 to $1,9998 | 17.98 | 18.98 |
| Couple family with children under 15 | 1,186,9458 | $2,000 to $2,1998 | 25.28 | 8.48 |
| Couple family with no children under 15 | 420,9628 | $1,800 to $1,9998 | 21.78 | 18.38 |
| One-parent family with children under 15 | 146,8138 | $1,600 to $1,7998 | 13.28 | 17.58 |
| One-parent family with no children under 15 | 148,7738 | $1,400 to $1,5998 | 11.18 | 26.48 |
| Other family | 20,0148 | $1,600 to $1,7998 | 12.38 | 23.08 |
| All families | 2,646,1978 | $1,800 to $1,9998 | 21.18 | 14.58 |
Source · ABS, 2021 Census of Population and Housing, General Community Profile, Table G39.
Loan sizes and interest rates for owner-occupiers are covered in the Australian mortgage statistics article.
Section 03 · Rent
How much rent do households with children pay in Australia?
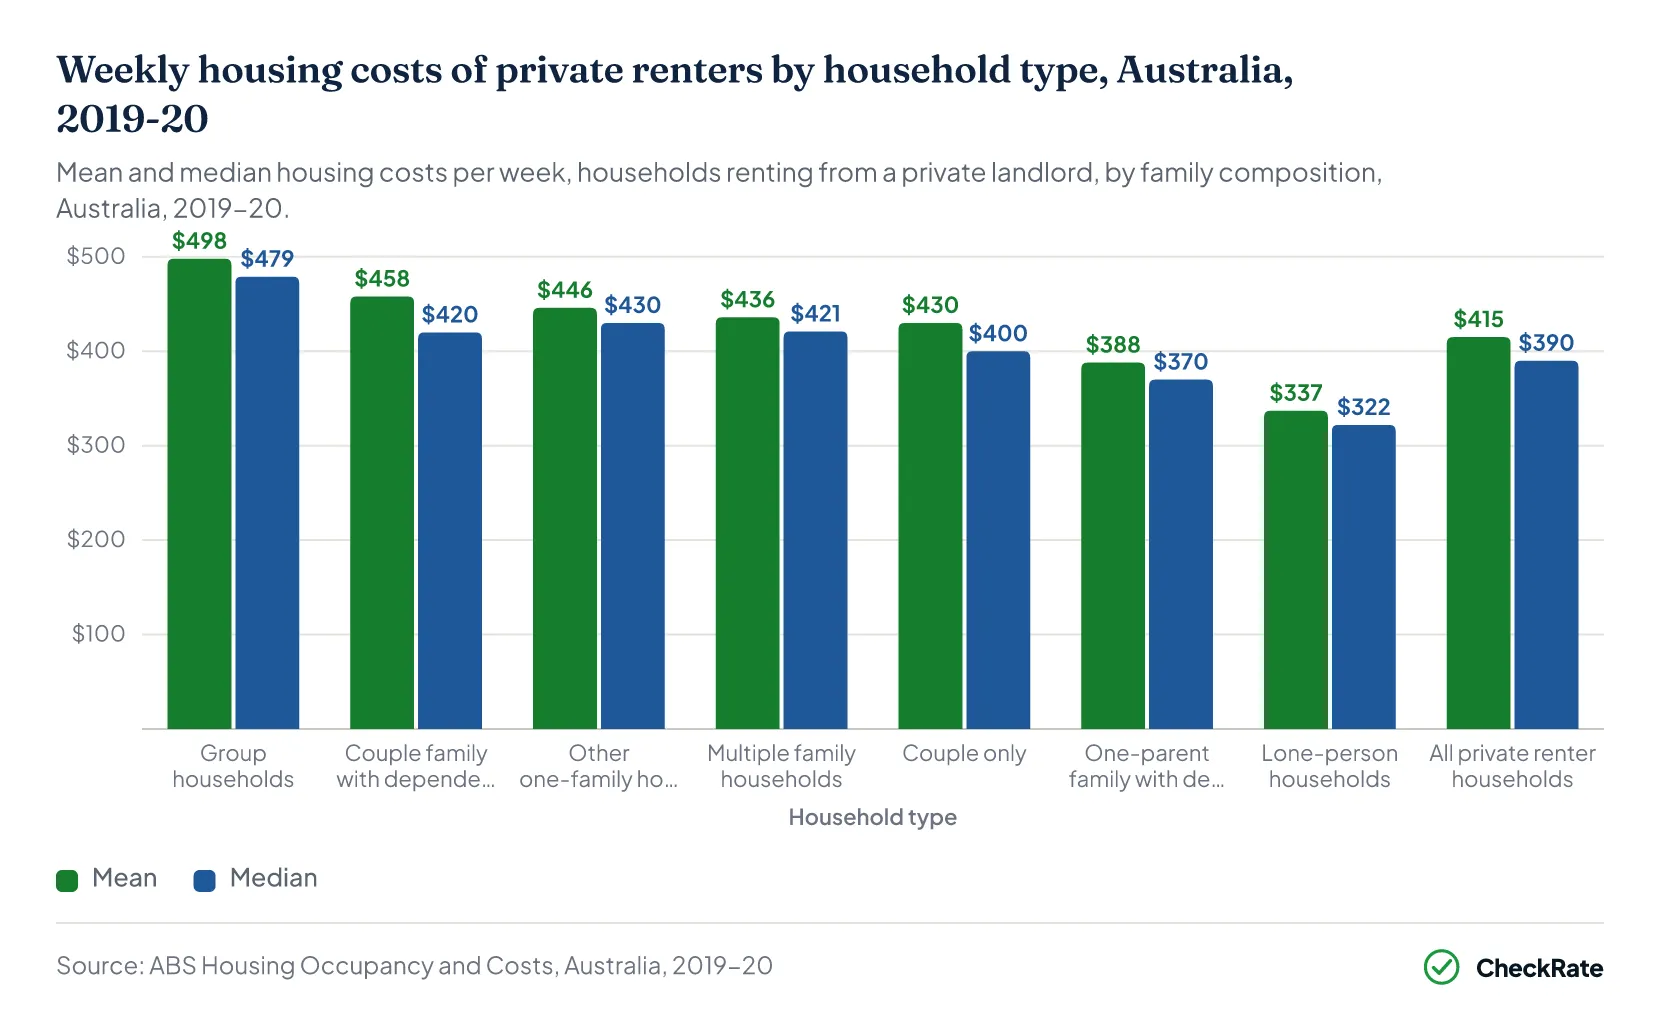
Couple families with dependent children renting privately had mean housing costs of $458 a week in 2019-20, according to the ABS1. One-parent families with dependent children renting privately had mean housing costs of $388 a week, compared with $415 for all private renter households. Couple-only households had mean housing costs of $430 a week, while lone-person households paid an average of $337.
Group households recorded the highest mean housing costs among private renter household types in 2019-20, at $498 a week, followed by couple families with dependent children1.
Median housing costs for private renters were $420 a week for couple families with dependent children and $370 for one-parent families with dependent children, compared with $390 for all private renter households1.
One-parent families with dependent children accounted for 14.0% of households renting from a state or territory housing authority in 2019-20, even though they made up 6.1% of all households3. Their mean housing costs as housing authority tenants were $189 a week1.
Rents across all renting households are covered in the average rent in Australia article.
Section 04 · Home ownership
What share of families with children own their home in Australia?
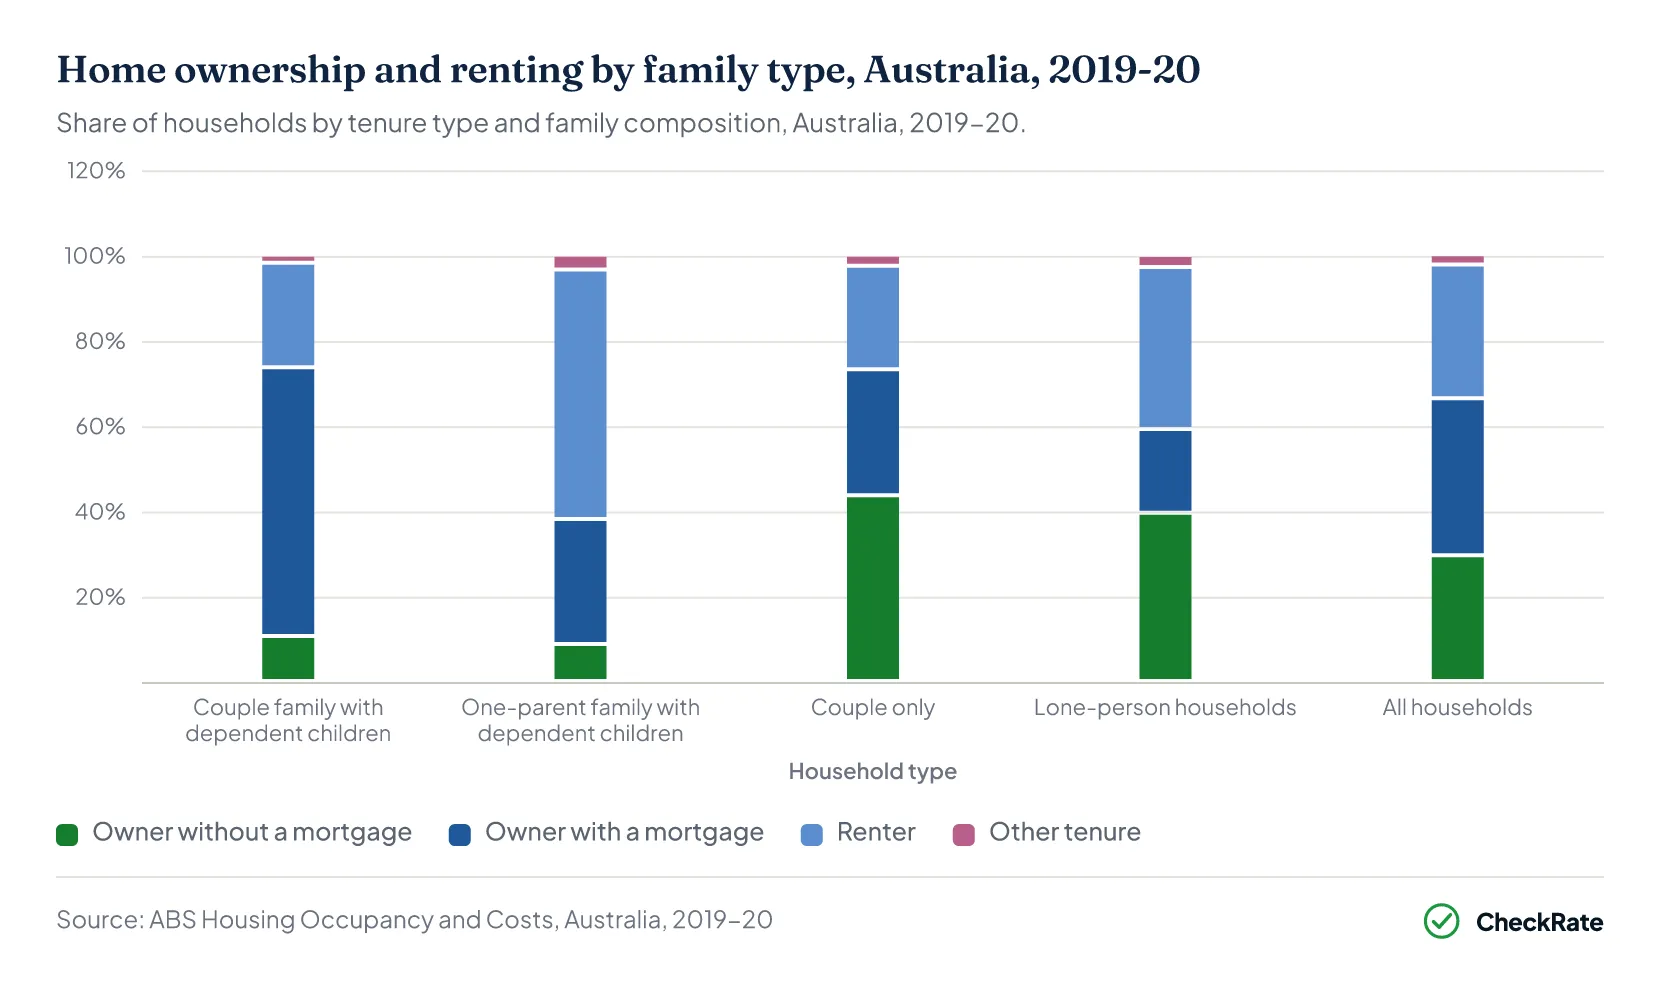
Of couple families with dependent children, 73.6% owned their home in 2019-20, compared with 38.1% of one-parent families with dependent children, according to ABS figures3.
Among couple families with dependent children, 63.0% owned their home with a mortgage and 10.6% owned it without a mortgage3. Among one-parent families with dependent children, the figures were 29.3% with a mortgage and 8.7% without a mortgage.
Of one-parent families with dependent children, 58.5% rented, including 47.3% from a private landlord and 6.6% from a state or territory housing authority3. In comparison, 24.5% of couple families with dependent children rented.
According to the Household, Income and Labour Dynamics in Australia (HILDA) Survey (Melbourne Institute), 36.3% of single mothers and 33.6% of single fathers with children under 18 owned their home between 2020 and 2024. The figures were higher for parents in couple families, at 73.6% for mothers and 74.4% for fathers11. Among these single parents, 53.8% of mothers and 56.3% of fathers rented privately, while 9.9% and 10.1% respectively lived in social housing.
Home ownership was 66.2% among all households in 2019-20, compared with 73.0% among couple-only households and 59.2% among lone-person households3.
| Households by tenure and family type, Australia, 2019-20 | |||||
|---|---|---|---|---|---|
| Household type | Households ('000) | Owners (%) | With a mortgage (%) | Without a mortgage (%) | Renters (%) |
| Couple family with dependent children | 2,573.73 | 73.63 | 63.03 | 10.63 | 24.53 |
| One-parent family with dependent children | 590.63 | 38.13 | 29.33 | 8.73 | 58.53 |
| Couple only | 2,563.33 | 73.03 | 29.53 | 43.63 | 24.33 |
| Lone-person households | 2,456.23 | 59.23 | 19.63 | 39.53 | 38.03 |
| All households | 9,732.43 | 66.23 | 36.83 | 29.53 | 31.43 |
Source · ABS, Housing Occupancy and Costs, Australia, 2019-20, Table 2.1.
Incomes, wealth and debt of family households are covered in the family household finances article.
Section 05 · Home size
What size homes do Australian families with children have, by bedrooms and dwelling type?
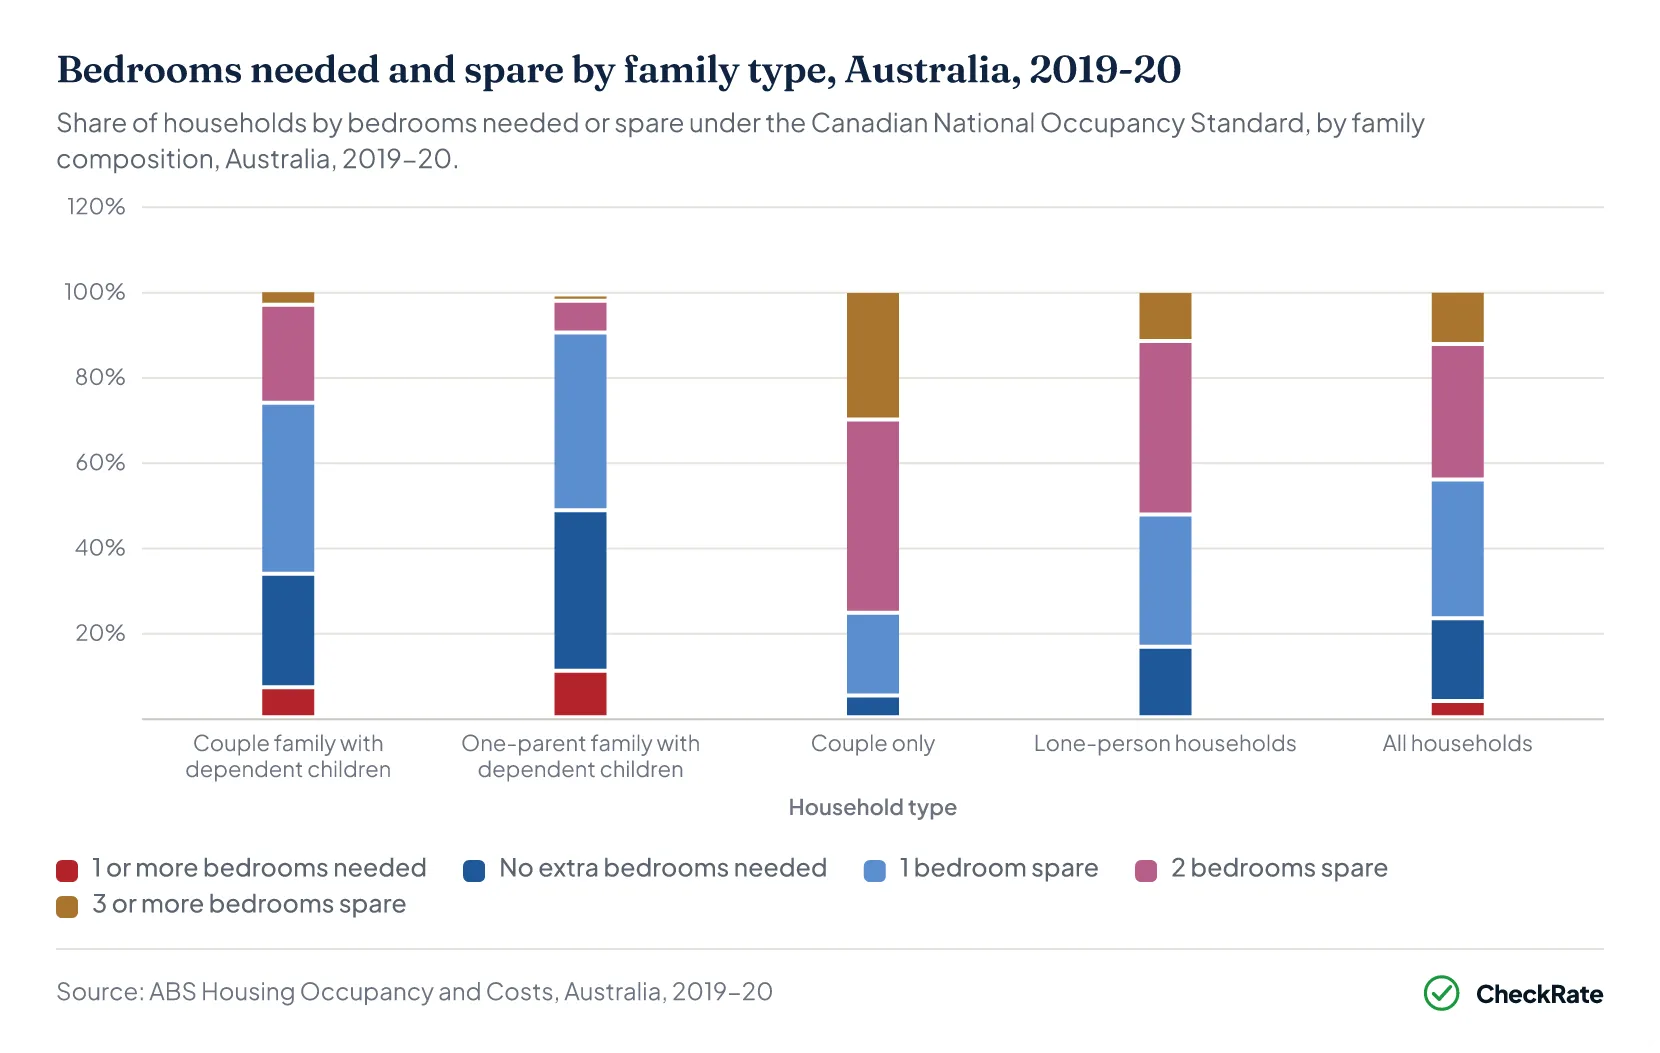
In 2019-20, 66.5% of couple families with dependent children had at least one spare bedroom, compared with 50.6% of one-parent families with dependent children, according to the ABS12.
Of couple families with dependent children, 23.0% had two spare bedrooms and 40.1% had one, compared with 7.4% and 41.7% of one-parent families with dependent children respectively12.
Of one-parent families with dependent children, 10.9% needed at least one more bedroom, compared with 7.0% of couple families with dependent children and 3.8% of all households12.
Among all households, 76.8% had at least one spare bedroom in 2019-20, compared with 94.8% of couple-only households12. The 2024 HILDA Survey found that 75.6% of people lived in homes with at least one spare bedroom, while 4.9% lived in homes that needed one or more additional bedrooms11. HILDA uses the same occupancy standard as the ABS but measures people rather than households.
The Canadian National Occupancy Standard determines how many bedrooms a household needs based on the ages, sexes and relationships of its members, with no more than two people per bedroom7.
At the 2021 Census, 85.9% of couple families with children lived in a separate house, compared with 76.7% of one-parent families and 72.3% of all occupied private dwellings8. Among couple families with children, 5.9% lived in a flat or apartment, compared with 9.5% of one-parent families and 14.2% of all occupied private dwellings.
Section 06 · Share of income
What share of income do Australian families with children spend on housing?
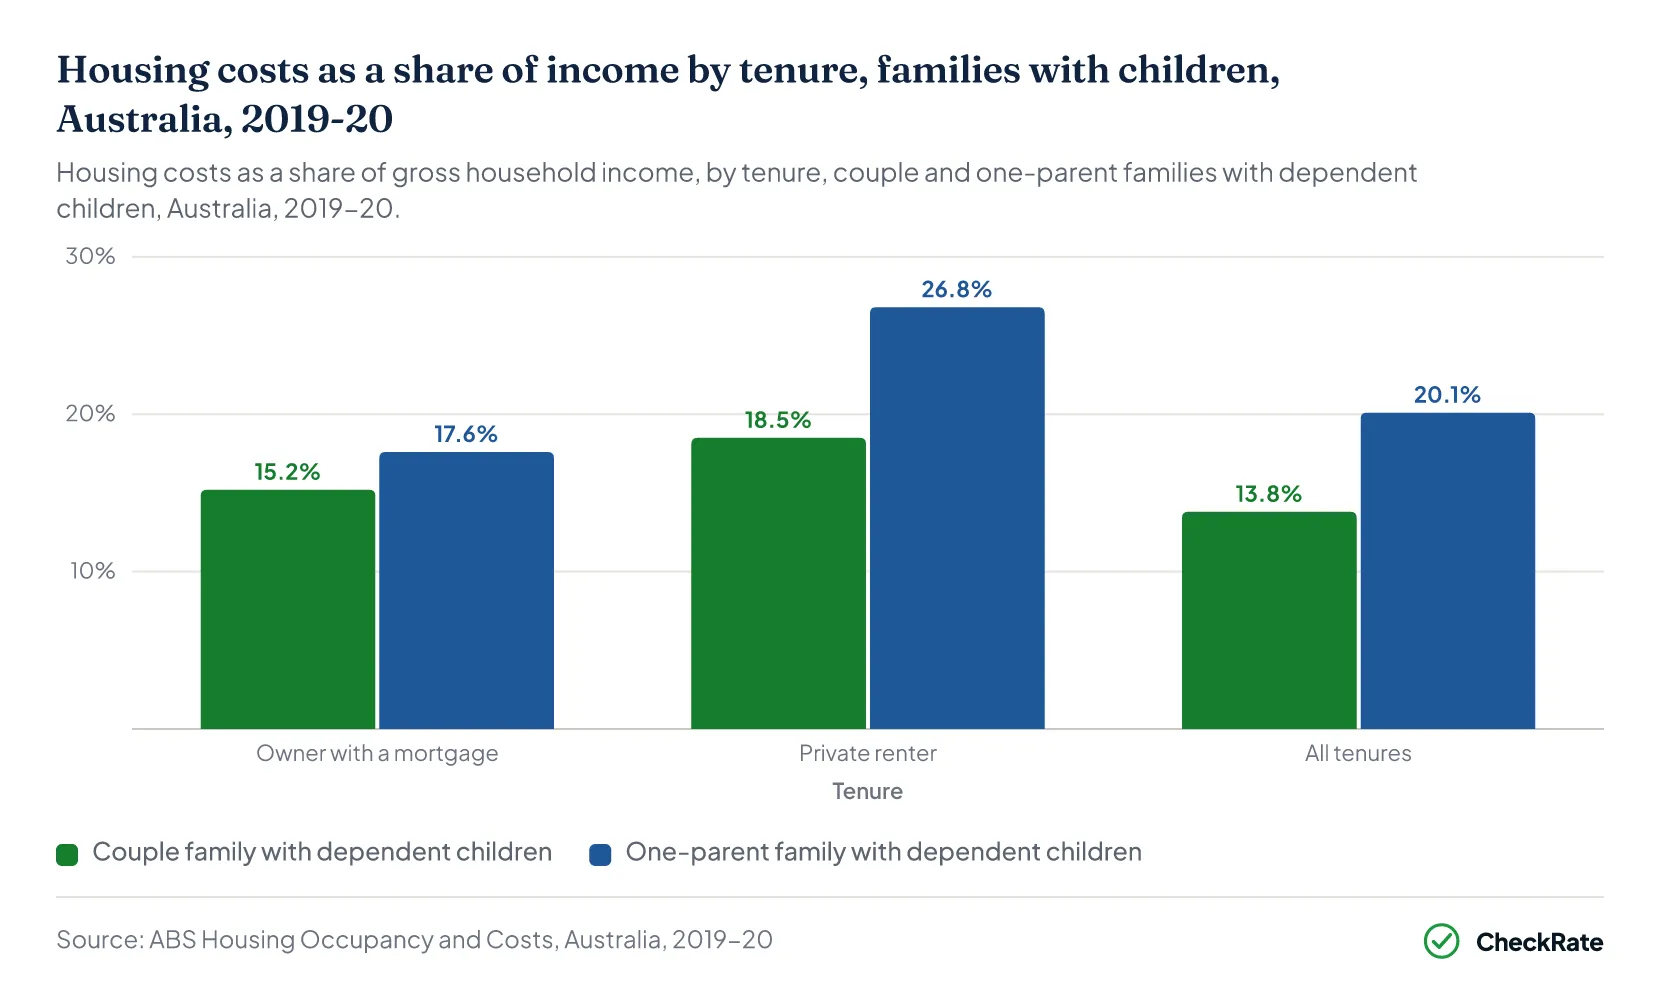
Housing costs accounted for 20.1% of the gross household income of one-parent families with dependent children in 2019-20, compared with 13.8% for couple families with dependent children and 13.6% for all households, according to the ABS2. The HILDA Survey (Melbourne Institute) found that single-parent families had the highest rates of housing stress among family types in data to 2024. Housing stress is defined here as spending more than 30% of disposable household income on housing while being in the bottom 40% of the household income distribution11.
Among households renting from a private landlord, housing costs accounted for 26.8% of gross household income for one-parent families with dependent children and 18.5% for couple families with dependent children2. For lone-person households renting privately, the figure was 26.3%, although the difference from one-parent families was within the margins of error.
Across all housing types, housing costs accounted for 18.5% of gross household income for lone-person households and 11.7% for couple-only households2.
Among owners with a mortgage, housing costs accounted for 17.6% of gross household income for one-parent families with dependent children and 15.2% for couple families with dependent children. This difference was also within the margins of error2.
The median housing cost-to-income ratio was 22.8% for one-parent families with dependent children and 15.5% for couple families with dependent children. This represents the household at the 50th percentile of each group, rather than the group's overall share of income spent on housing2.
| Housing costs as a share of gross household income by tenure and household type, Australia, 2019-20 | ||||||
|---|---|---|---|---|---|---|
| Household type | Mortgage holders (%) | MOE (±) | Private renters (%) | MOE (±) | All tenures (%) | MOE (±) |
| Couple family with dependent children | 15.22 | 1.22 | 18.52 | 2.42 | 13.82 | 0.02 |
| One-parent family with dependent children | 17.62 | 5.82 | 26.82 | 4.02 | 20.12 | 2.62 |
| Couple only | 15.42 | 1.82 | 17.52 | 2.02 | 11.72 | 0.62 |
| Lone-person households | 24.42 | 3.02 | 26.32 | 2.72 | 18.52 | 0.32 |
| All households | 15.52 | 0.82 | 20.22 | 1.12 | 13.62 | 0.02 |
Source · ABS, Housing Occupancy and Costs, Australia, 2019-20, Table 4.1.
Repayment pressure on current borrowers is covered in the mortgage stress in Australia article.
Section 07 · Since 1994-95
How have housing costs for Australian families with children changed since 1994-95?
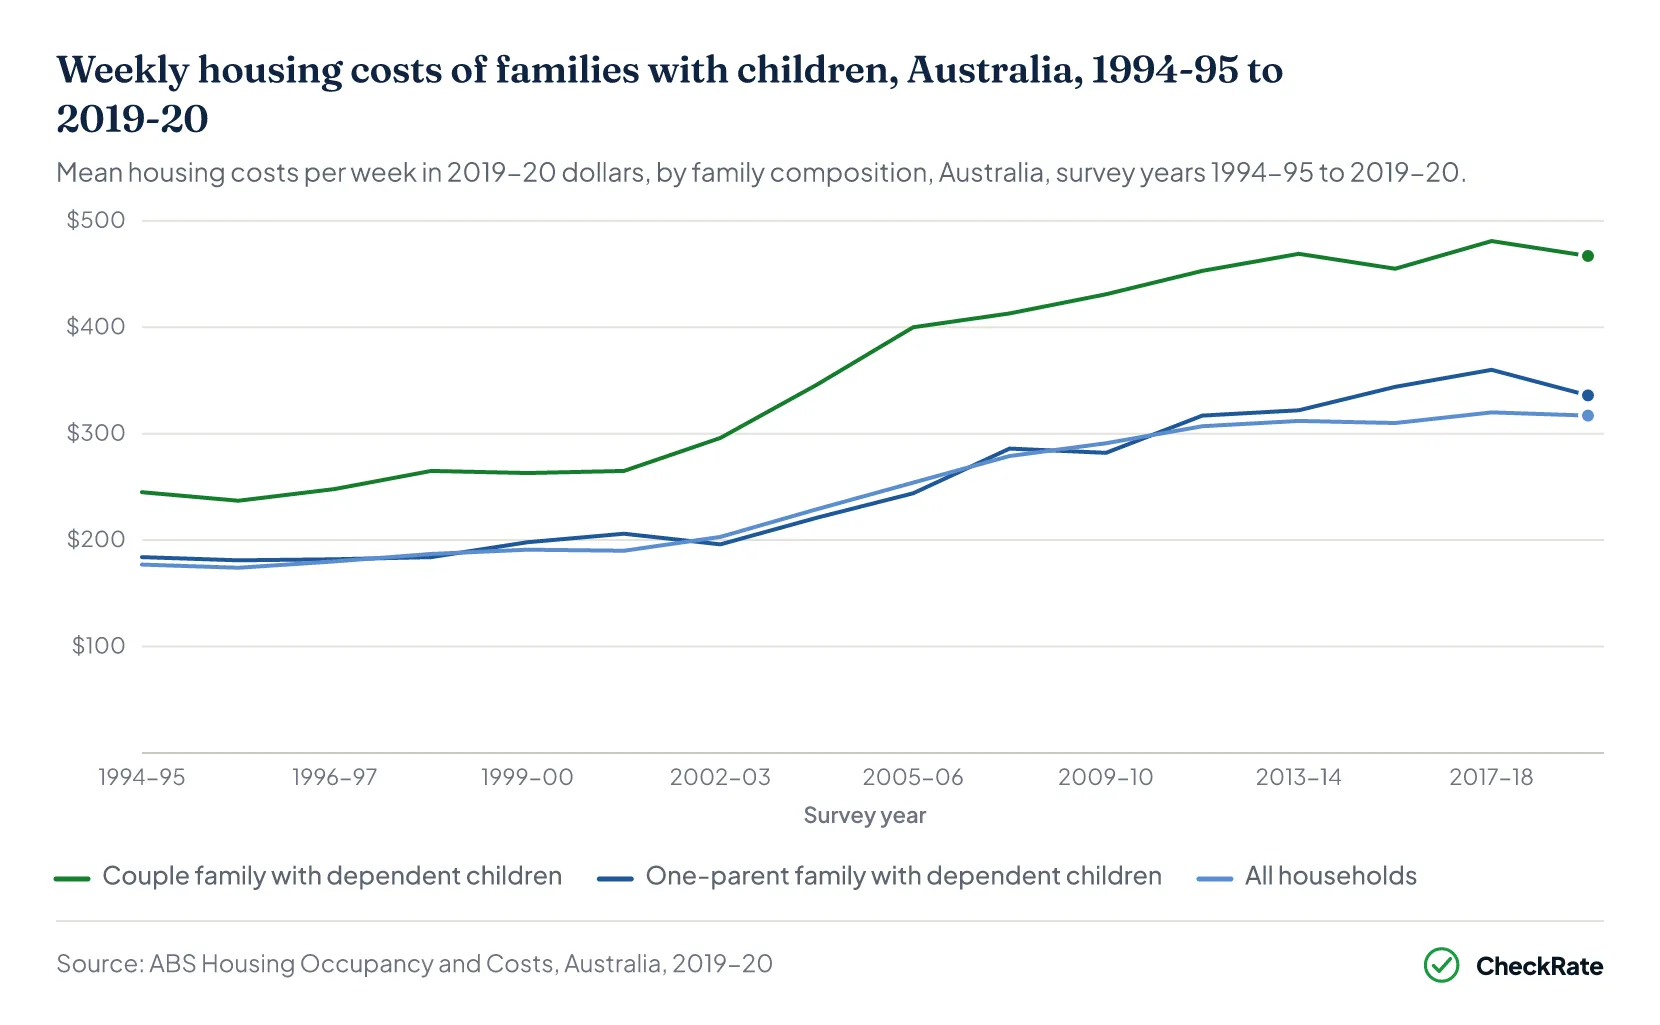
Mean housing costs of couple families with dependent children rose from $245 a week in 1994-95 to $467 in 2019-20, an increase of 90.6% in 2019-20 dollars, according to the ABS13. For one-parent families with dependent children, mean housing costs rose from $184 a week to $336 over the same period, an increase of 82.6%.
Mean housing costs across all households rose from $177 a week in 1994-95 to $317 in 2019-20, an increase of 79.1%13.
Between 2007-08 and 2019-20, mean housing costs rose from $413 a week to $467 for couple families with dependent children, an increase of 13.1%, and from $286 to $336 for one-parent families with dependent children, an increase of 17.5%13.
Over the same period, housing costs as a share of gross household income fell from 21.6% to 20.1% for one-parent families with dependent children and from 14.0% to 13.8% for couple families with dependent children13. Both changes were within the margins of error.
| Housing costs as a share of gross household income, families with dependent children, Australia, 2007-08 and 2019-20 | ||||
|---|---|---|---|---|
| Household type | 2007-08 (%) | MOE (±) | 2019-20 (%) | MOE (±) |
| Couple family with dependent children | 14.013 | 0.813 | 13.813 | 0.013 |
| One-parent family with dependent children | 21.613 | 2.113 | 20.113 | 2.613 |
Source · ABS, Housing Occupancy and Costs, Australia, 2019-20, Table 1.2.
Section 08 · Common questions
Family housing costs: quick answers
How much do families with children spend on housing in Australia?
Couple families with dependent children had mean housing costs of $467 a week in 2019-20, compared with $336 for one-parent families with dependent children and $317 for all households, according to the Australian Bureau of Statistics (ABS). The figures predate the interest rate rises that began in May 2022.
What percentage of income do single parents spend on housing?
One-parent families with dependent children spent 20.1% of their gross household income on housing costs in 2019-20, compared with 13.8% for couple families with dependent children, according to the ABS. Among one-parent families renting from a private landlord, housing costs were equal to 26.8% of gross household income.
What is the median mortgage repayment for families with children in Australia?
The median monthly mortgage repayment for couple families with children under 15 was in the $2,000 to $2,199 range at the August 2021 Census, compared with $1,600 to $1,799 for one-parent families with children under 15. The Census figures predate the increases in the cash rate target that began in May 2022.
What are the weekly housing costs of families with children who rent privately?
Couple families with dependent children renting from a private landlord had mean housing costs of $458 a week in 2019-20, and one-parent families with dependent children $388 a week, according to the ABS. Housing costs for renters are rent plus any general and water rates they pay.
Why are the latest figures on family housing costs from 2019-20?
The latest ABS figures on housing costs by family type are from 2019-20 because the ABS did not release results from its 2023-24 Survey of Income and Housing due to data collection problems. Census mortgage repayments by family type are from August 2021.
References
- ABS Housing Occupancy and Costs, 2019-20, data cube 3: Housing costs · Australian Bureau of Statistics ↑ b c d e f g h i j k l m n o p q r s t u v w x y z a2 b2 c2 d2 e2 f2 g2
- ABS Housing Occupancy and Costs, 2019-20, data cube 4: Housing costs as a proportion of income · Australian Bureau of Statistics ↑ b c d e f g h i j k l m n o p q r s t u v w x y z a2 b2 c2 d2 e2 f2 g2 h2 i2 j2
- ABS Housing Occupancy and Costs, 2019-20, data cube 2: Housing occupancy · Australian Bureau of Statistics ↑ b c d e f g h i j k l m n o p q r s t u v w x y z a2 b2 c2 d2 e2 f2 g2
- RBA Cash Rate Target · Reserve Bank of Australia ↑ b c
- ABS media statement, Survey of Income and Housing results will not be released · Australian Bureau of Statistics ↑
- ABS, Survey of Income and Housing, User Guide, Australia, 2019-20, Glossary · Australian Bureau of Statistics ↑
- ABS Housing Occupancy and Costs methodology, 2019-20 · Australian Bureau of Statistics ↑ b c
- ABS, 2021 Census of Population and Housing, General Community Profile, Australia · Australian Bureau of Statistics ↑ b c d e f g h i j k l m n o p q r s t u v w x y z a2 b2 c2 d2 e2 f2
- ABS, 2021 Census product release guide · Australian Bureau of Statistics ↑
- RBA Statistical Table F6 Housing Lending Rates workbook (series FLRHOFP) · Reserve Bank of Australia ↑
- Melbourne Institute, University of Melbourne: HILDA Statistical Report 2026 (Selected Findings from Waves 1 to 24) · melbourneinstitute.unimelb.edu.au ↑ b c
- ABS Housing Occupancy and Costs, 2019-20, data cube 7: Housing utilisation · Australian Bureau of Statistics ↑ b c d
- ABS Housing Occupancy and Costs, 2019-20, data cube 1: Housing occupancy and costs, Australia, 1994–95 to 2019–20 · Australian Bureau of Statistics ↑ b c d e f g h i j k l m
- ABS Housing Occupancy and Costs, 2019-20 financial year · Australian Bureau of Statistics