

Published
 How much does it cost to raise a child in Australia in 2026?The estimated cost of one child aged 0 to 12 is $14,902 a year for parents with a combined child support income of $93,137, according to 2026 child support cost estimates from the Department of Social…
 Childcare costs in Australia: average daily fees and out-of-pocket costs after the subsidyThe average daily fee for centre-based day care in Australia was $146.00 for a 10-hour session in the June quarter 2026, before the Child Care Subsidy. This is based on the Department of Education's…
 Family finances in Australia: income, spending and debt for households with childrenCouple families with dependent children had a median disposable household income of $2,285 a week in 2019-20, according to Australian Bureau of Statistics (ABS) Survey of Income and Housing data. For…
 Family payments in Australia: Child Care Subsidy, Parental Leave Pay and Family Tax BenefitThe Child Care Subsidy and Additional Child Care Subsidy had estimated Australian Government expenditure of $3.88 billion in the June quarter 2026, when 989,100 families used approved child care…
 Cost of living in Australia: household spending by category, state and household typeAustralian households spent a combined $923 billion across tracked consumer categories in 2025, up 52% from $606 billion in 2016. In the first nine months of 2026, tracked spending reached $711.3…
 Average HECS debt in Australia in 2026: how much do students owe?The average outstanding HELP debt in Australia was $27,739 in the 2024–25 financial year, up slightly from $27,641 the year before and 165% higher than two decades ago. Across the country, 2,962,650…
Section 01 · Fees by sector
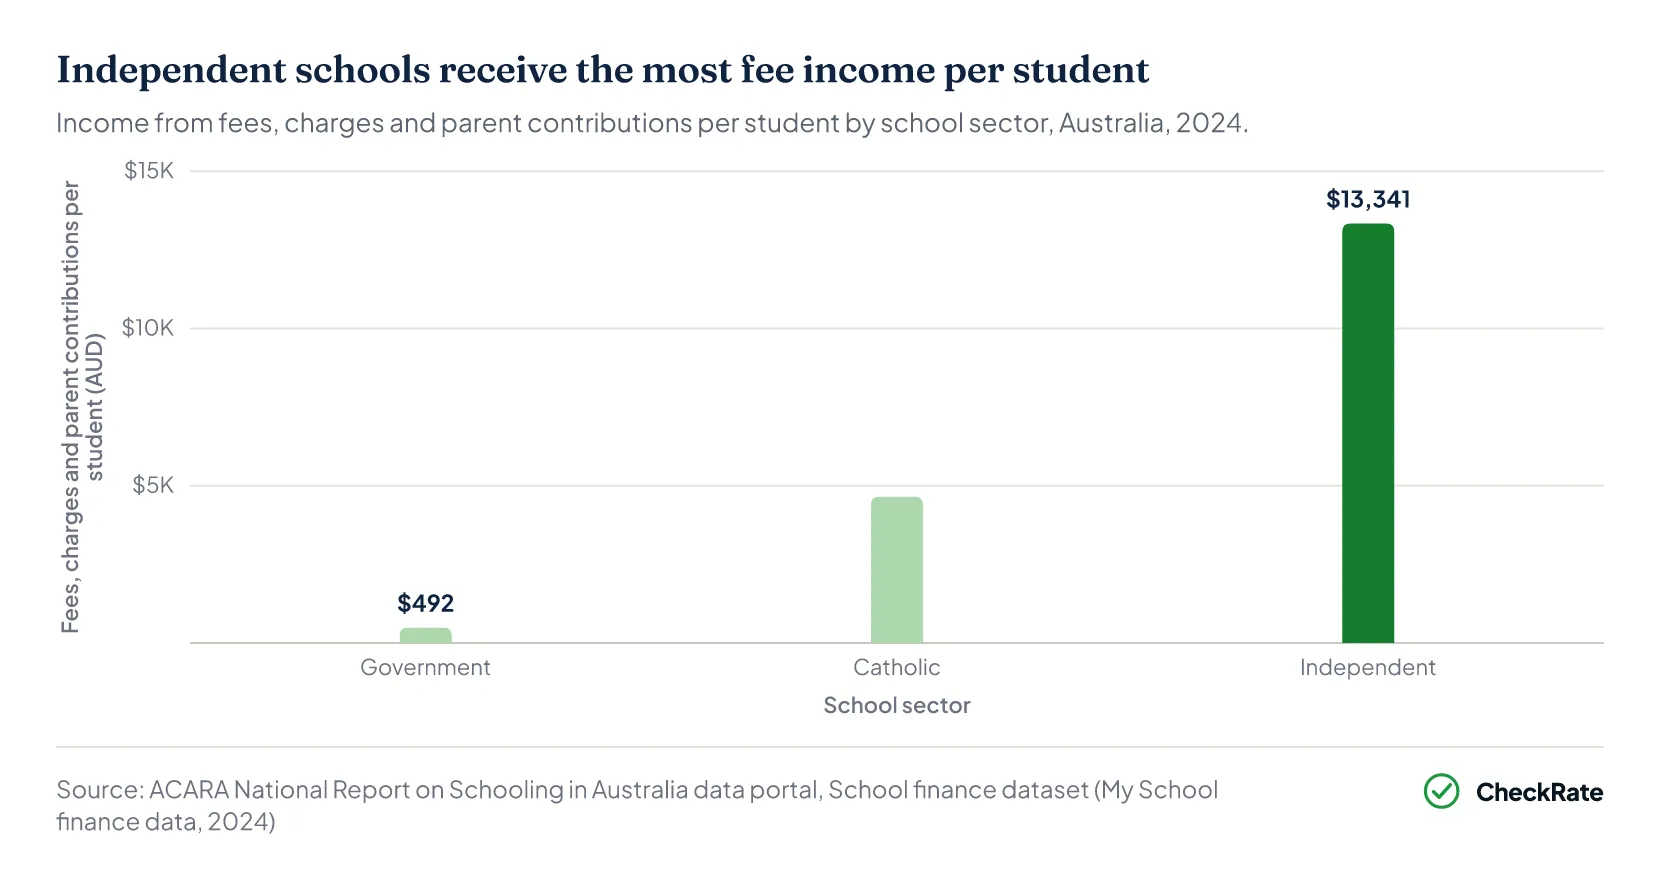
How much fee income do private, Catholic and public schools in Australia receive per student?
Independent schools in Australia received $13,341 per student from fees, charges and parent contributions in 2024, according to Australian Curriculum, Assessment and Reporting Authority (ACARA) My School finance data2. Catholic schools received $4,653 per student, and government schools received $492 per student.
Income from fees, charges and parent contributions totalled $14.97 billion across all schools in 2024, equal to $3,602 per student2. Independent schools accounted for $10.11 billion of that total, Catholic schools for $3.57 billion and government schools for $1.30 billion.
Fee income made up 46.6% of gross income per student in independent schools in 2024, compared with 21.1% in Catholic schools and 2.4% in government schools2.
ACARA classifies Catholic schools that are run outside a Catholic system, mainly in New South Wales, as independent schools2.
| Income from fees, charges and parent contributions by school sector, Australia, 2024 | |||
|---|---|---|---|
| School sector | Per student | Total ($ million) | Share of gross income (%) |
| Government | $4921 | 1,2961 | 2.4 |
| Catholic | $4,6531 | 3,5661 | 21.1 |
| Independent | $13,3411 | 10,1111 | 46.6 |
| All schools | $3,6021 | 14,9731 | 16.2 |
Source · ACARA, National Report on Schooling in Australia data portal, School finance dataset (My School finance data).
The wider costs of raising children are covered in the cost of raising a child article.
Section 02 · Charges and contributions
What do public school charges and parent contributions cover in Australia?
Government schools in Australia received $492 per student from fees, charges and parent contributions in 2024, and a separate $312 per student from other private sources2. ACARA reports fees, charges and parent contributions as one income line, so My School finance data does not provide separate figures for charges and parent contributions.
Education departments in Victoria, Queensland, South Australia, Western Australia, Tasmania and the Northern Territory describe what this income includes for government schools, and the descriptions differ3. The table below shows four of them.
| What the fees, charges and parent contributions line includes for government schools, by state, 2024 | |
|---|---|
| State | Included in the line |
| Victoria | Fees, sales of class materials, parent payments for camps and activities, and fees from international students4 |
| Queensland | Textbook and resource allowance fees, part of the income from excursions and specialised programs, and international student income. Voluntary contributions are counted as income from other private sources5 |
| South Australia | The materials and services charge, and possibly overseas student fees, before and after school care, camps, excursions, sport and school council levies6 |
| Western Australia | Voluntary contributions, course charges, overseas student fees and parent payments for excursions and camps7 |
Source · ACARA, My School 2024 financial limitations, state notes.
Section 03 · By state
How does private and public school fee income per student differ by state and territory?
Victoria recorded the highest fee income per student in independent schools of any state or territory in 2024, at $16,5832. The Australian Capital Territory recorded the highest fee income per student in Catholic schools of any state or territory in 2024, at $5,723. South Australia recorded the highest fee income per student in government schools, at $686, followed by Victoria, at $620.
The Northern Territory recorded the lowest fee income per student across all three sectors in 2024, at $7,736 in independent schools, $3,068 in Catholic schools and $168 in government schools2. Across all schools, the Australian Capital Territory recorded the highest fee income per student of any state or territory in 2024, at $4,569, compared with $3,602 for Australia.
Fee income per student across all schools in each state or territory also depends on the proportion of its students enrolled in each sector.
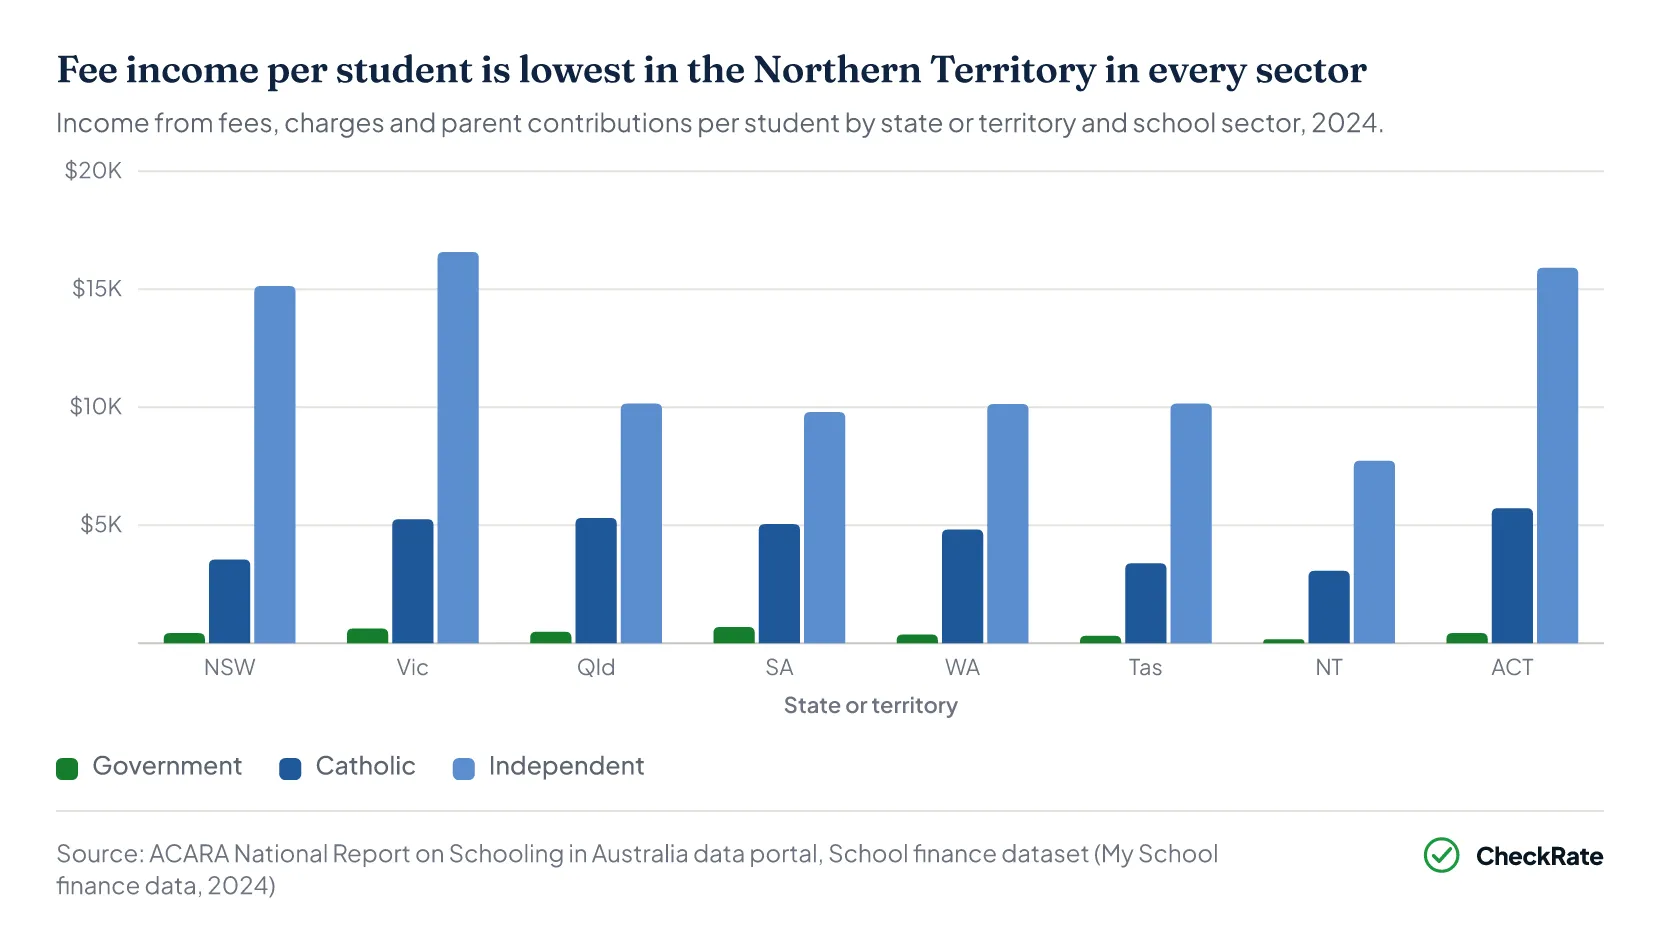
| Income from fees, charges and parent contributions per student by state or territory and school sector, 2024 | ||||
|---|---|---|---|---|
| State or territory | Government | Catholic | Independent | All schools |
| New South Wales | $4261 | $3,5461 | $15,1411 | $3,8881 |
| Victoria | $6201 | $5,2551 | $16,5831 | $4,2321 |
| Queensland | $4841 | $5,3091 | $10,1561 | $3,0681 |
| South Australia | $6861 | $5,0451 | $9,7971 | $3,3121 |
| Western Australia | $3671 | $4,8181 | $10,1381 | $2,8621 |
| Tasmania | $3131 | $3,3861 | $10,1541 | $2,2571 |
| Northern Territory | $1681 | $3,0681 | $7,7361 | $1,6311 |
| Australian Capital Territory | $4281 | $5,7231 | $15,9151 | $4,5691 |
| Australia | $4921 | $4,6531 | $13,3411 | $3,6021 |
Source · ACARA, National Report on Schooling in Australia data portal, School finance dataset (My School finance data).
Section 04 · Government funding
How much government funding do public and private schools receive per student?
Governments provided $21,550 of recurrent funding per full-time equivalent student in government schools in 2023-24, compared with $15,262 per student in non-government schools, according to the Productivity Commission's Report on Government Services8.
Both figures exclude the user cost of capital, an estimate of the cost of the land and buildings that governments own. The Productivity Commission estimates it for government schools only8.
Including the user cost of capital, government recurrent funding was $26,140 per student in government schools in 2023-249. State and territory governments provided $21,862 of that amount, and the Australian Government provided $4,277. In non-government schools, the Australian Government provided $12,055 per student, and state and territory governments provided $3,207.
Adjusted for inflation, and including the user cost of capital for government schools, government recurrent funding rose from $20,596 per student in government schools in 2014-15 to $26,140 in 2023-24, and from $12,167 to $15,262 per student in non-government schools9.
The Australian Government funds at least 20% of the Schooling Resource Standard for each government school and 80% for each non-government school, according to the Department of Education10. The Schooling Resource Standard is an estimate of the total public funding a school needs. For most non-government schools, its base amount is reduced according to the school's capacity to contribute.
Government sources provided 96.1% of gross income per student in government schools in 2024, compared with 75.2% in Catholic schools and 48.3% in independent schools, according to ACARA My School finance data1.
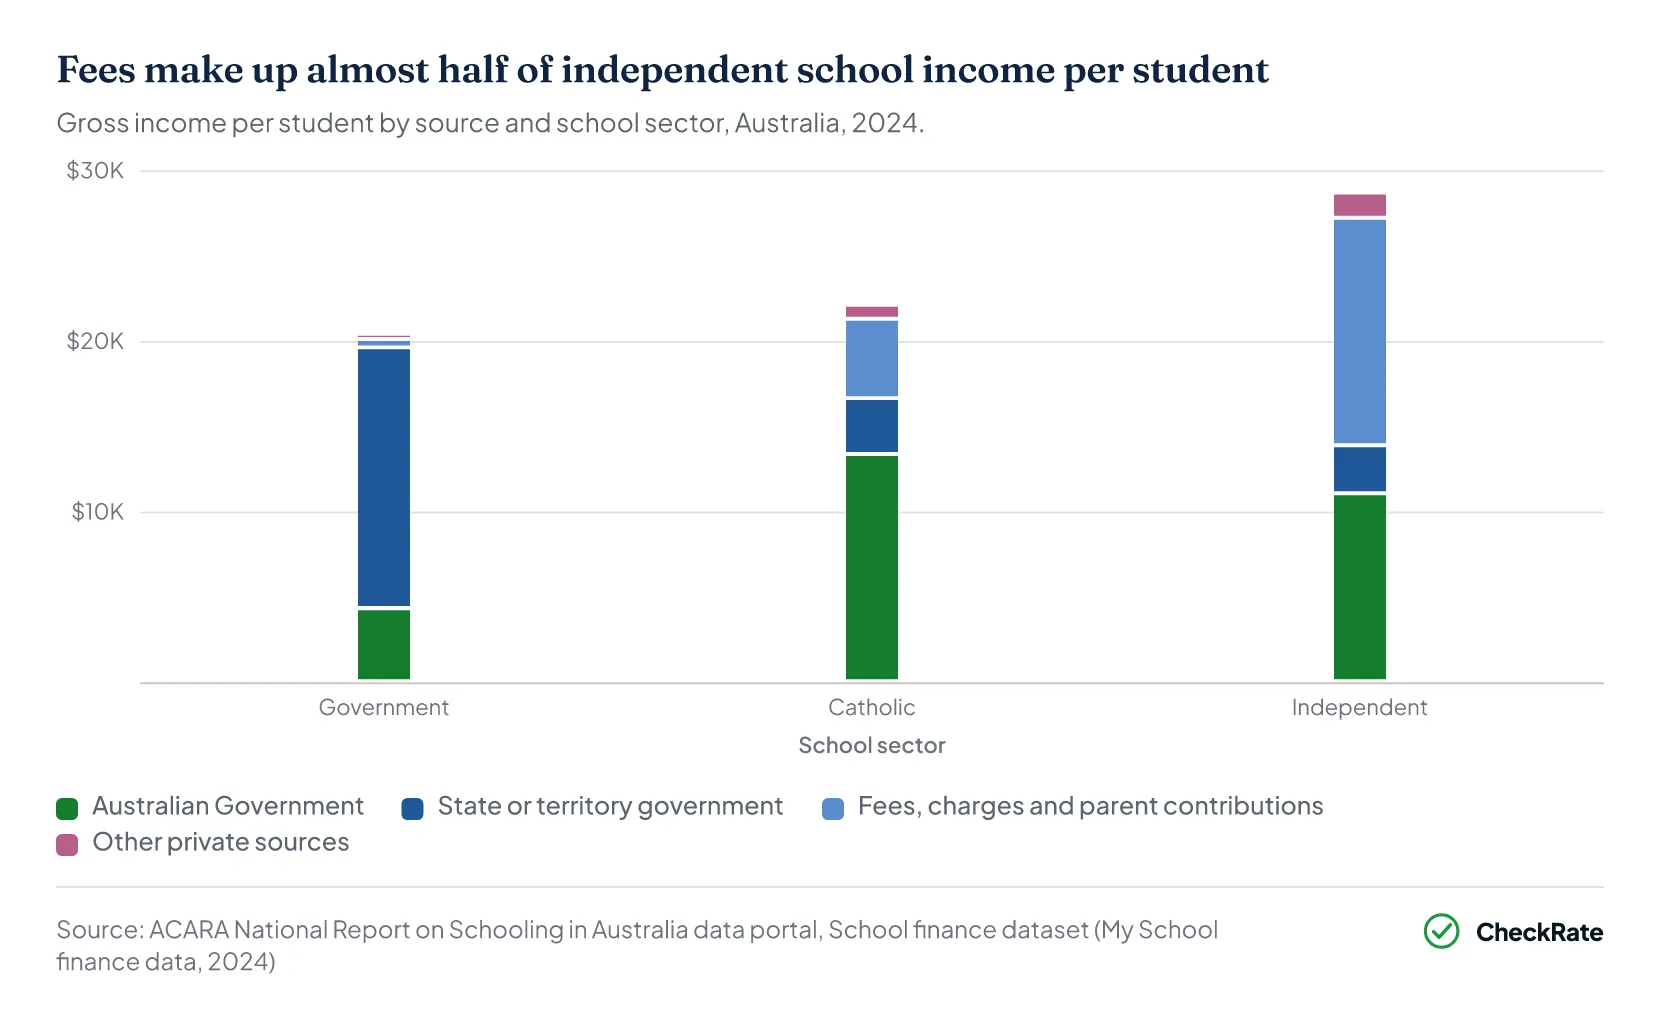
| Gross income per student by source and school sector, Australia, 2024 | |||
|---|---|---|---|
| Income source | Government | Catholic | Independent |
| Australian Government | $4,2791 | $13,3211 | $11,0111 |
| State or territory government | $15,2851 | $3,2691 | $2,8151 |
| Fees, charges and parent contributions | $4921 | $4,6531 | $13,3411 |
| Other private sources | $3121 | $8241 | $1,4761 |
| Total gross income | $20,3681 | $22,0671 | $28,6421 |
Source · ACARA, National Report on Schooling in Australia data portal, School finance dataset (My School finance data).
| Government recurrent funding per full-time equivalent student by state or territory and school sector, 2023-24 | |||
|---|---|---|---|
| State or territory | Government | Government, no capital cost | Non-government |
| New South Wales | $27,9539 | $23,2089 | $14,7949 |
| Victoria | $24,2559 | $19,2259 | $14,6319 |
| Queensland | $26,2729 | $21,6419 | $16,0559 |
| Western Australia | $24,7099 | $20,1349 | $15,2189 |
| South Australia | $24,6509 | $21,7139 | $16,4449 |
| Tasmania | $27,9759 | $25,0749 | $18,7549 |
| Australian Capital Territory | $29,6359 | $25,5229 | $11,0769 |
| Northern Territory | $32,2239 | $28,7029 | $27,1999 |
| Australia | $26,1409 | $21,5509 | $15,2629 |
Source · Productivity Commission, Report on Government Services 2026, Tables 4A.32 and 4A.33.
Payments made to families rather than schools are covered in the government support for families article.
Section 05 · Primary and secondary
Do private and public secondary schools receive more fee income per student than primary schools?
Secondary schools in Australia received more fee income per student than primary schools in all three school sectors in 2024, according to ACARA My School finance data2. Catholic secondary schools received $5,966 per student, compared with $2,399 in Catholic primary schools. In government schools, secondary fee income was $726 per student, compared with $351 in primary schools.
Independent secondary schools received $12,018 per student, compared with $6,920 in independent primary schools2. However, most independent school students attended combined schools, which teach both primary and secondary year levels. These schools enrolled about 87% of independent school students in 2024 and received $14,077 per student in fee income.
Government spending was also higher for secondary students in government schools. In 2023-24, in-school spending averaged $26,925 per full-time equivalent secondary student, including the user cost of capital, compared with $23,248 per primary student, according to the Productivity Commission8. For 2026, the Schooling Resource Standard base amount is $18,180 per secondary student and $14,467 per primary student, according to the Department of Education10.
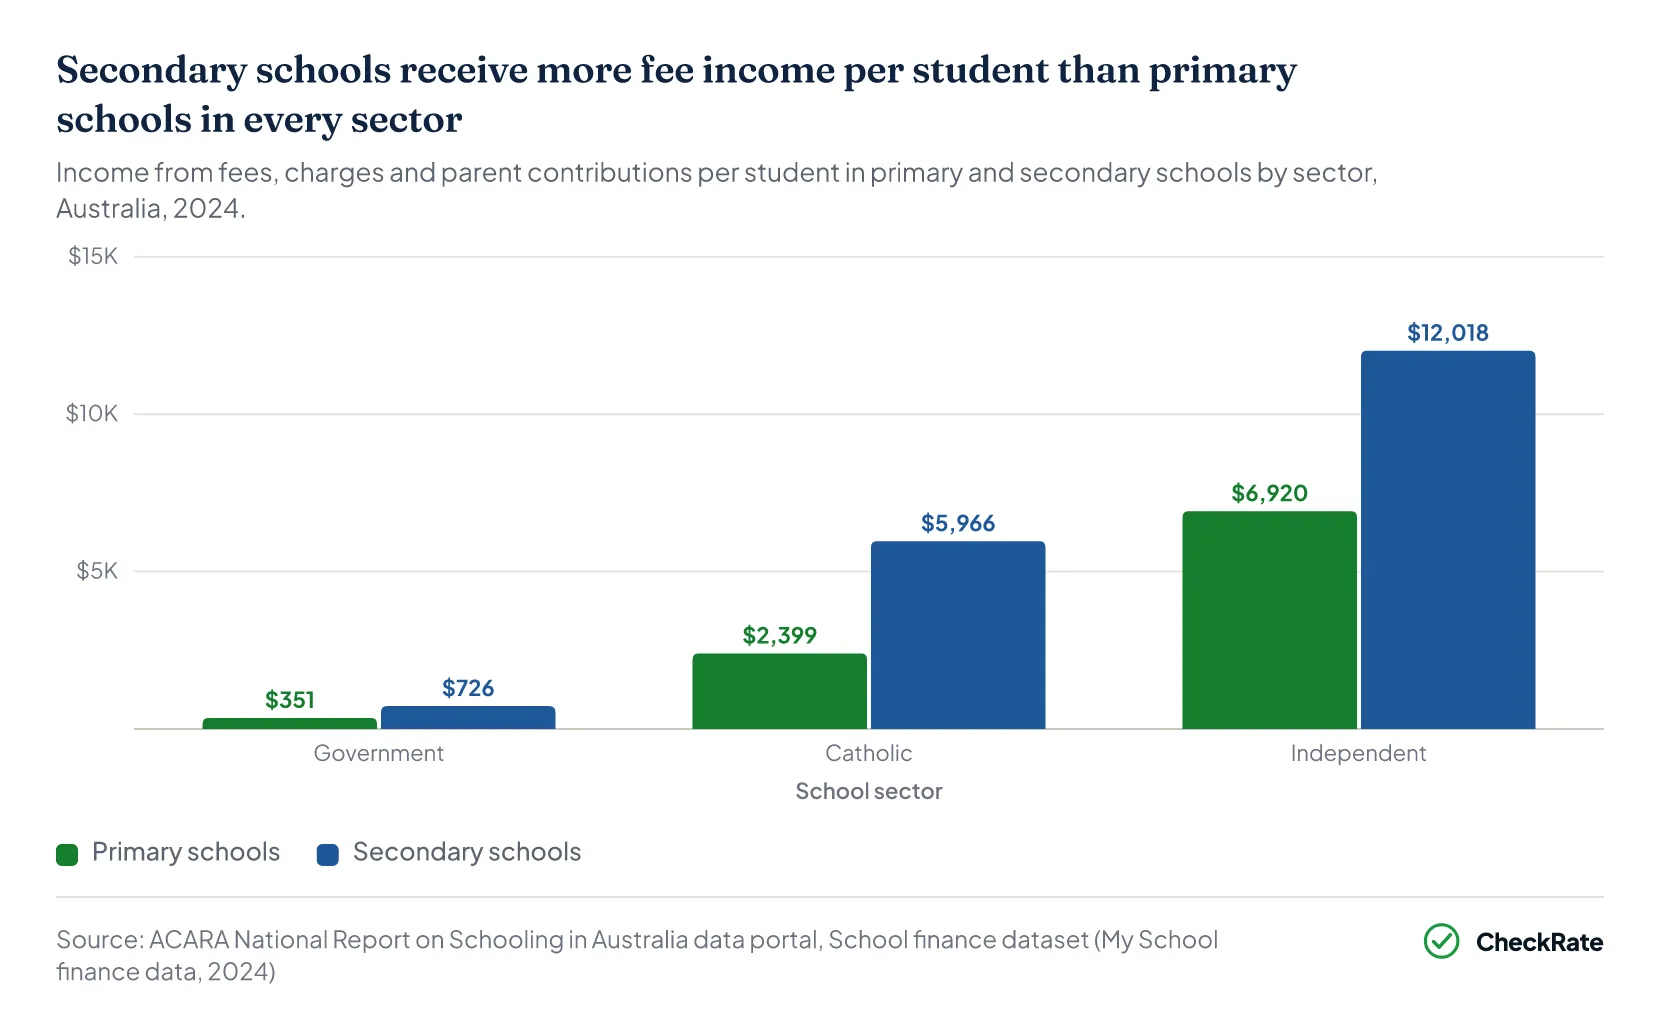
| Income from fees, charges and parent contributions per student by school level and sector, Australia, 2024 | |||
|---|---|---|---|
| School level | Government | Catholic | Independent |
| Primary | $3511 | $2,3991 | $6,9201 |
| Secondary | $7261 | $5,9661 | $12,0181 |
| Combined | $4831 | $8,1291 | $14,0771 |
| All levels | $4921 | $4,6531 | $13,3411 |
Source · ACARA, National Report on Schooling in Australia data portal, School finance dataset (My School finance data).
Costs for children below school age are covered in the childcare costs article.
Section 06 · Costs and inflation
How much have school fees and education prices risen in Australia?
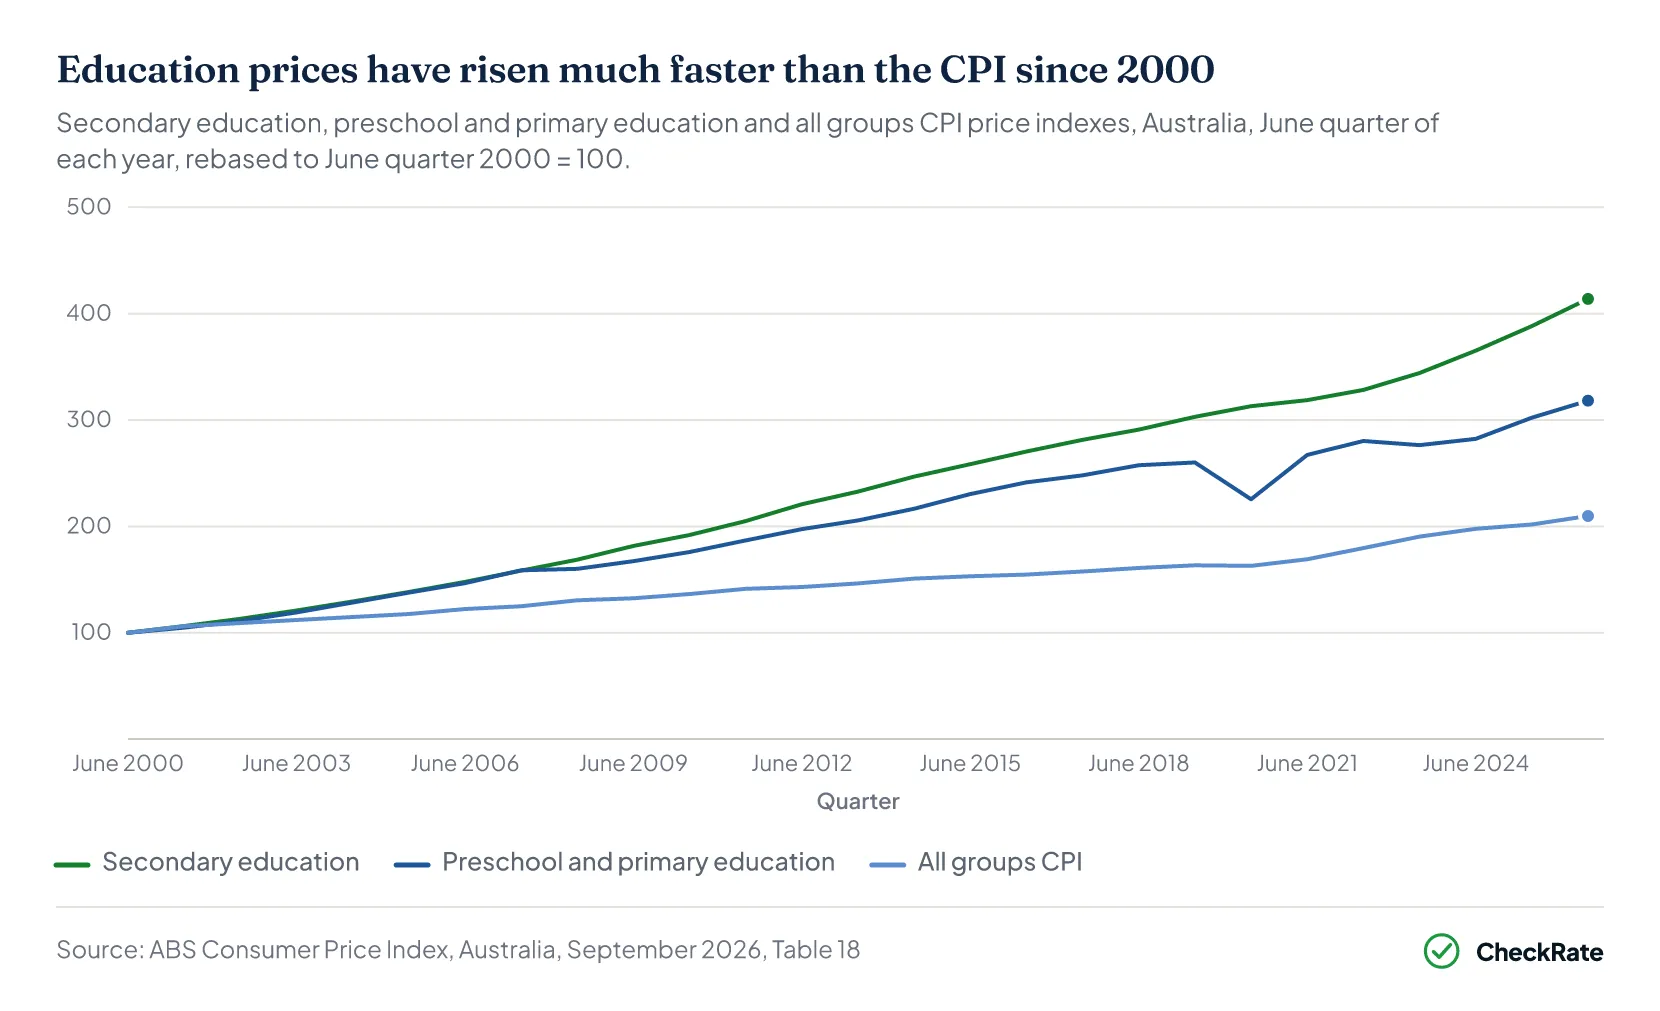
The secondary education price index rose 6.6% in the year to the September quarter 2026, compared with 3.9% for the quarterly Consumer Price Index (CPI) as a whole, according to the Australian Bureau of Statistics (ABS)11. Prices for preschool and primary education rose 5.0% over the same period.
Over the longer term, education prices have risen faster than overall inflation. From the June quarter 2000 to the June quarter 2026, the secondary education price index rose 313.9% and the preschool and primary education price index rose 218.2%11. Over the same period, the CPI increased by 109.8%.
The preschool and primary education price index fell 16.2% in the June quarter 2020, partly because of free before and after school care and free preschool for term 2 in New South Wales, Victoria and Queensland, according to the ABS12.
School fee income per student is a separate measure from education prices and does not show how much an individual family pays.
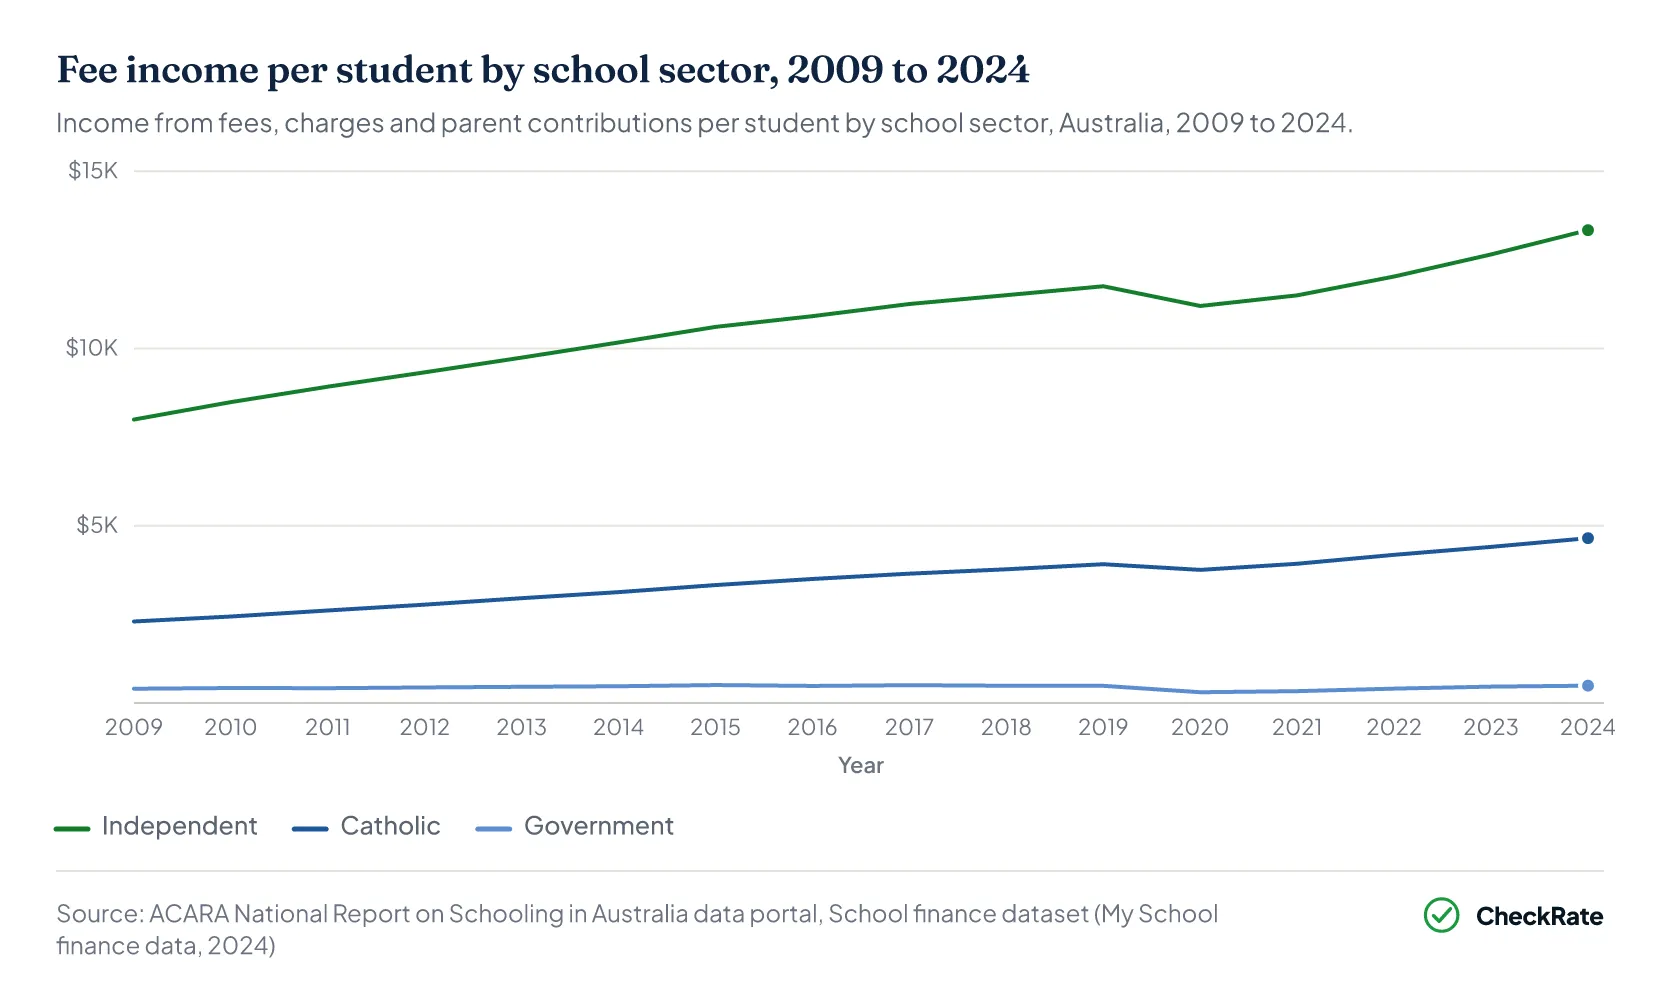
Fee income per student by school sector, 2009 to 2024
Fee income per student in Catholic schools increased from $2,303 in 2009 to $4,653 in 2024, a rise of 102.0%, according to ACARA My School finance data2. Over the same period, fee income per student rose from $7,999 to $13,341 in independent schools, an increase of 66.8%, and from $406 to $492 in government schools, an increase of 21.2%.
For comparison, the CPI increased by 48.5% between 2009 and 2024, based on calendar-year averages11.
Government school fee income per student fell from $488 in 2019 to $307 in 2020, before recovering to $492 in 20242.
| Income from fees, charges and parent contributions per student by school sector, Australia, 2009 to 2024 | |||||
|---|---|---|---|---|---|
| School sector | 2009 | 2014 | 2019 | 2024 | Change, 2009 to 2024 (%) |
| Government | $4061 | $4761 | $4881 | $4921 | 21.2 |
| Catholic | $2,3031 | $3,1311 | $3,9181 | $4,6531 | 102.0 |
| Independent | $7,9991 | $10,1731 | $11,7581 | $13,3411 | 66.8 |
Source · ACARA, National Report on Schooling in Australia data portal, School finance dataset (My School finance data).
Section 07 · Common questions
School costs: quick answers
How much are private school fees in Australia?
Independent schools received $13,341 per student from fees, charges and parent contributions in 2024, and Catholic schools received $4,653 per student, according to ACARA My School finance data1. These amounts are total fee income divided by enrolled students, not the fee charged to any one family.
How much do government schools charge in Australia?
Government schools received $492 per student from fees, charges and parent contributions in 2024, according to ACARA My School finance data1. This is average fee income per student, not the amount charged to each family. In some states this income can include contributions, course and materials charges, camps and excursions, and fees from overseas students.
How much does the government spend per school student in Australia?
Governments provided $21,550 of recurrent funding per full-time equivalent student in government schools in 2023-24 and $15,262 in non-government schools, excluding the user cost of capital, according to the Productivity Commission8. Including that cost, government school funding was $26,140 per student.
Do secondary schools receive more fee income per student than primary schools in Australia?
Secondary schools received more fee income per student than primary schools in each sector in 2024, including $5,966 compared with $2,399 in Catholic schools, according to ACARA My School finance data1. These amounts are total fee income divided by enrolled students, not the fee charged to any one family.
How much have school fees gone up in Australia?
The secondary education price index rose 6.6% in the year to the September quarter 2026, compared with 3.9% for the quarterly Consumer Price Index, according to the Australian Bureau of Statistics11. The preschool and primary education price index rose 5.0% over the same year. These indexes measure education price changes, not changes in average school fee income per student.
Do school fees include uniforms and excursions?
In some states, school fee income reported by ACARA includes parent payments for camps and excursions, but only when these payments reach school or system accounts. Payments made directly to other suppliers, such as uniform or device retailers, are not included.
References
- ACARA, National Report on Schooling in Australia data portal: School finance dataset (My School finance data, 2009 to 2024) · dataandreporting.blob.core.windows.net ↑ b c d e f g h i j k l m n o p q r s t u v w x y z a2 b2 c2 d2 e2 f2 g2 h2 i2 j2 k2 l2 m2 n2 o2 p2 q2 r2 s2 t2 u2 v2 w2 x2 y2 z2 a3 b3 c3 d3 e3 f3 g3 h3 i3 j3 k3 l3 m3 n3 o3 p3 q3 r3 s3 t3 u3 v3 w3 x3 y3 z3 a4 b4 c4 d4 e4 f4 g4 h4 i4 j4 k4 l4 m4
- ACARA, National Report on Schooling in Australia data portal: School income · acara.edu.au ↑ b c d e f g h i j k l m
- ACARA My School, 2024 comparative limitations and explanations: general comments · myschool.edu.au ↑ b c
- ACARA My School, 2024 financial limitations: Victorian government schools · myschool.edu.au ↑
- ACARA My School, 2024 financial limitations: Queensland · myschool.edu.au ↑
- ACARA My School, 2024 financial limitations: South Australia · myschool.edu.au ↑
- ACARA My School, 2024 financial limitations: Western Australia · myschool.edu.au ↑
- Productivity Commission, Report on Government Services 2026, Part B, section 4: School education · pc.gov.au ↑ b c d
- Productivity Commission, Report on Government Services 2026, section 4 School education data tables (Tables 4A.32 and 4A.33) · assets.pc.gov.au ↑ b c d e f g h i j k l m n o p q r s t u v w x y z a2 b2 c2
- Department of Education, Schooling Resource Standard · education.gov.au ↑ b
- ABS, Consumer Price Index, Australia, September 2026, Table 18 (6401018.xlsx) · Australian Bureau of Statistics ↑ b c d
- ABS, Consumer Price Index, Australia, June quarter 2020 · Australian Bureau of Statistics ↑
- ACARA media release: My School 2025 update (3 December 2025) · acara.edu.au