


Updated
- Mean household net worth
- $1.58m
- 2024 National Accounts
- Median household net worth
- $579k
- Most recent survey (2019–20)
- Share of national wealth
- 44%
- Wealthiest 10% of households
- Wealth Gini coefficient
- 0.611
- Nearly double the income Gini of 0.324
 Australian wages and wealth since 2000: why higher pay has not gone as farThe average full-time Australian worker earned $2,051.10 a week in ordinary-time wages in November 2025, equal to $106,657 a year. That was 157% higher than in November 2000, when the same measure was…
 What is considered a high income in Australia in 2026?Australia doesn't have a single official definition of a high income. Three separate government thresholds each serve a different purpose, ranging from $101,000 for singles under the Medicare levy sur…
 Income distribution in Australia: what each income percentile earnsThe median taxable income in Australia was $55,868 in 2022-23. The median is the midpoint of the income range, meaning half of all individual taxpayers earned more and half earned less.
Average and median household net worth in Australia
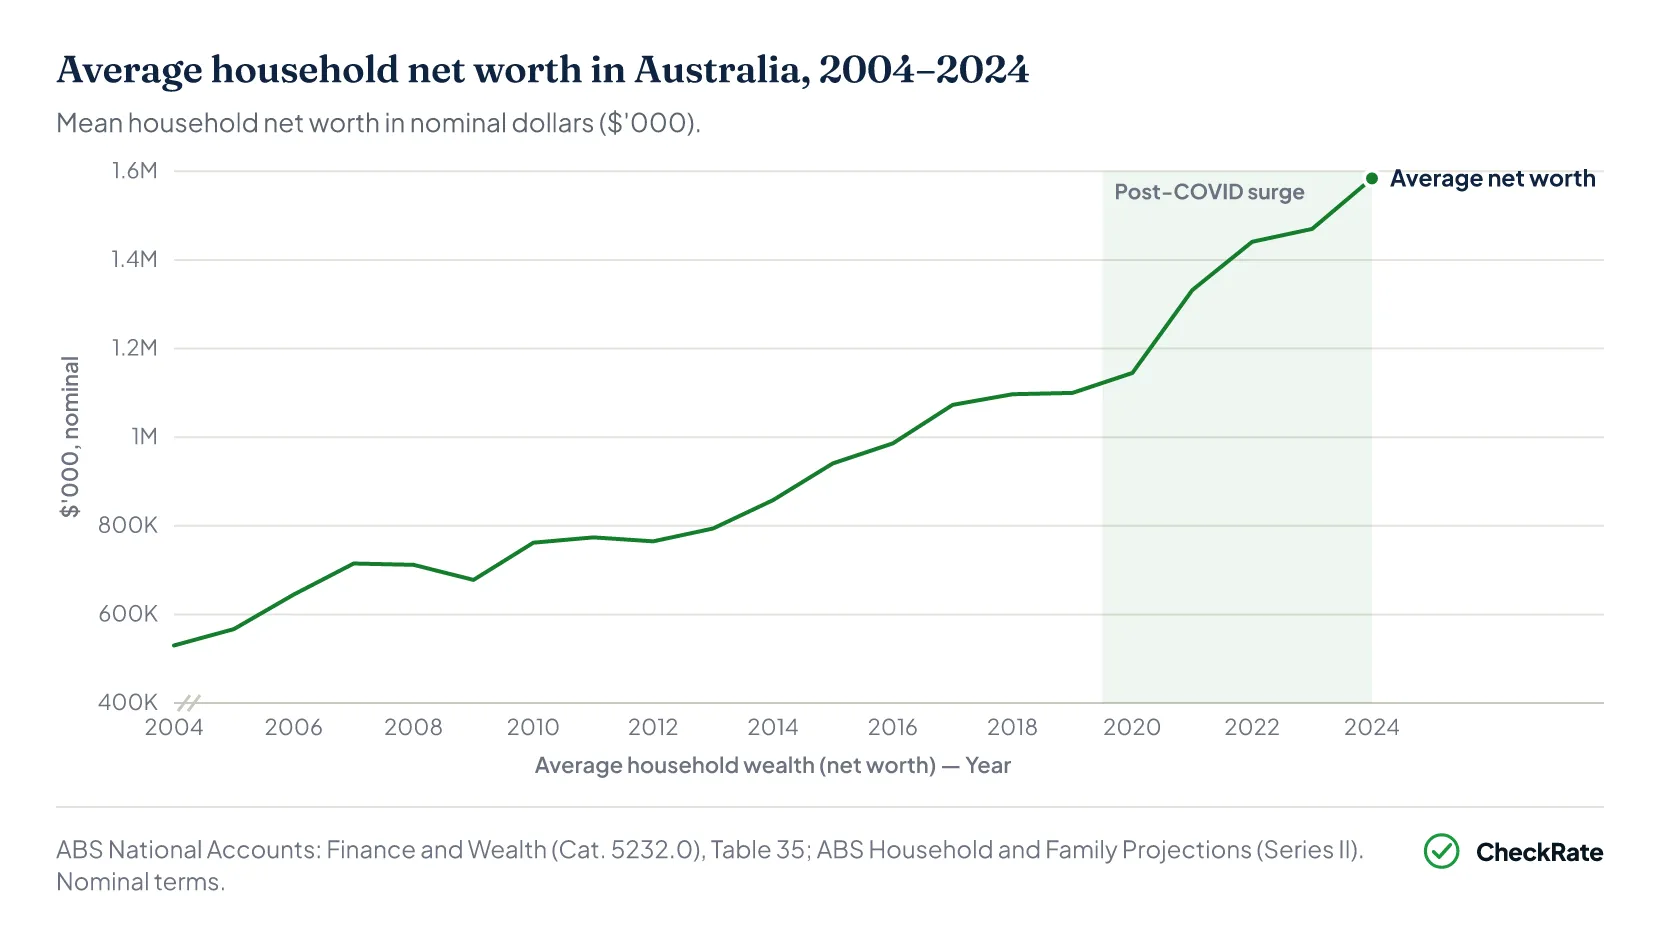
Average (mean) household net worth was approximately $1.58 million in 2024, up from $530,000 in 2004. The median tells a different story: the latest detailed survey recorded median household net worth at $579,200 in 2019–20, less than 40% of the 2024 average. The gap between the mean and median shows how concentrated wealth is at the top of the distribution.
Household net worth is the value of everything a household owns, including property, superannuation, investments, vehicles and contents, minus what it owes, such as mortgages and personal debts.
Because the mean is pulled upward by a smaller number of very wealthy households, the median shows the midpoint of the household wealth distribution.
That gap is not new. When both figures were last measured together in 2019–20, average household net worth was $1.04 million, while the median was $579,200. By 2024, the average had risen to $1.58 million.
The 2024 median cannot be measured directly without updated survey data, but the gap may have widened since then. Post-2020 wealth gains were driven largely by rising property values and financial asset prices, which mainly benefited households that already owned assets.
Growth has also been uneven over time. Average household net worth rose from $530,000 in 2004 to around $1.1 million by 2019, with only a brief setback during the 2008–09 global financial crisis. After 2020, growth accelerated. In four years, average net worth increased by approximately $440,000, driven by low interest rates, rising property values and higher financial asset returns.
Section 01 · How wealth is distributed
Australian wealth is concentrated in the top 20% of households
The top 20% of Australian households hold approximately 63% of national household wealth, with an average net worth of $3.23 million. The bottom 60% collectively hold about 17%.
The gap is widest at the extremes. The wealthiest 10% of households hold around 44% of all household wealth, with an average wealth of $5.2 million. The bottom 20% hold less than 1%, with an average wealth of around $35,200.
Wealth in Australia is far more concentrated than income.
| Wealth held by Australian household wealth groups | ||
|---|---|---|
| Quintile | Share of total wealth | Avg net worth |
| Top 20% | 62.8% | $3,230,000 |
| 4th quintile | 20.5% | not reported |
| Middle 20% | 11.3% | $564,500 |
| 2nd quintile | 4.8% | not reported |
| Bottom 20% | 0.7% | $35,200 |
Source · Shares from ABS Survey of Income and Housing 2019-20; average net worth from ACOSS and UNSW Sydney, Inequality in Australia 2024.
Using the 2019–20 ABS Survey of Income and Housing, the wealth Gini coefficient was 0.611, compared with an income Gini of 0.324. A Gini score of 0 means perfect equality, while 1 means all wealth is held by one household.
Australia's wealth Gini is almost double its income Gini, showing that wealth is distributed far less evenly than income. This reflects the way assets such as property, superannuation and investments accumulate over time, while income is spread more broadly through wages and salaries.
Income Gini
- 0.324
Income inequality is moderate by international standards. Progressive taxation, minimum wage settings and Australia's industrial award system help keep earnings more evenly distributed than in many comparable economies.
Wealth Gini
- 0.611
Wealth inequality is much higher than income inequality. Assets, especially property, can grow in value over time, allowing wealth to build faster than wages for households that already own them.
Of all new wealth generated in Australia since 2003, approximately 45% has flowed to the top 10% of households. That growth came mainly through rising asset values, especially property, alongside tax settings that provide concessions for some capital gains and investment losses.
Section 02 · The wealthiest 10%
What net worth puts a household in the top 10% in Australia?
| Household wealth by group: net worth thresholds and share of national wealth, 2022–23 | |||
|---|---|---|---|
| Household group | Minimum net worth | Average net worth | Share of national wealth |
| Top 10% | $2,600,000 | $5,200,000 | 44% |
| Top 20% | N/A | $3,230,000 | 62.8% |
| Middle 20% | N/A | $564,500 | 11.3% |
| Bottom 20% | N/A | $35,200 | 0.7% |
Source · ACOSS and UNSW Sydney, Inequality in Australia 2024.
Wealth in the top 10% is closely tied to asset ownership, including residential property, investment property, superannuation, shares and business assets. The gap between the group's entry threshold, around $2.6 million, and its average wealth of $5.2 million shows how wide the range is within the top decile.
A smaller number of very high-wealth households pulls the average above what many households in this group hold. The top decile's share of national wealth has grown over the past two decades, driven largely by rising asset values, especially property.
Section 03 · Property and wealth
Property makes up more than half of average household wealth
What percentage of Australian household wealth is held in property?
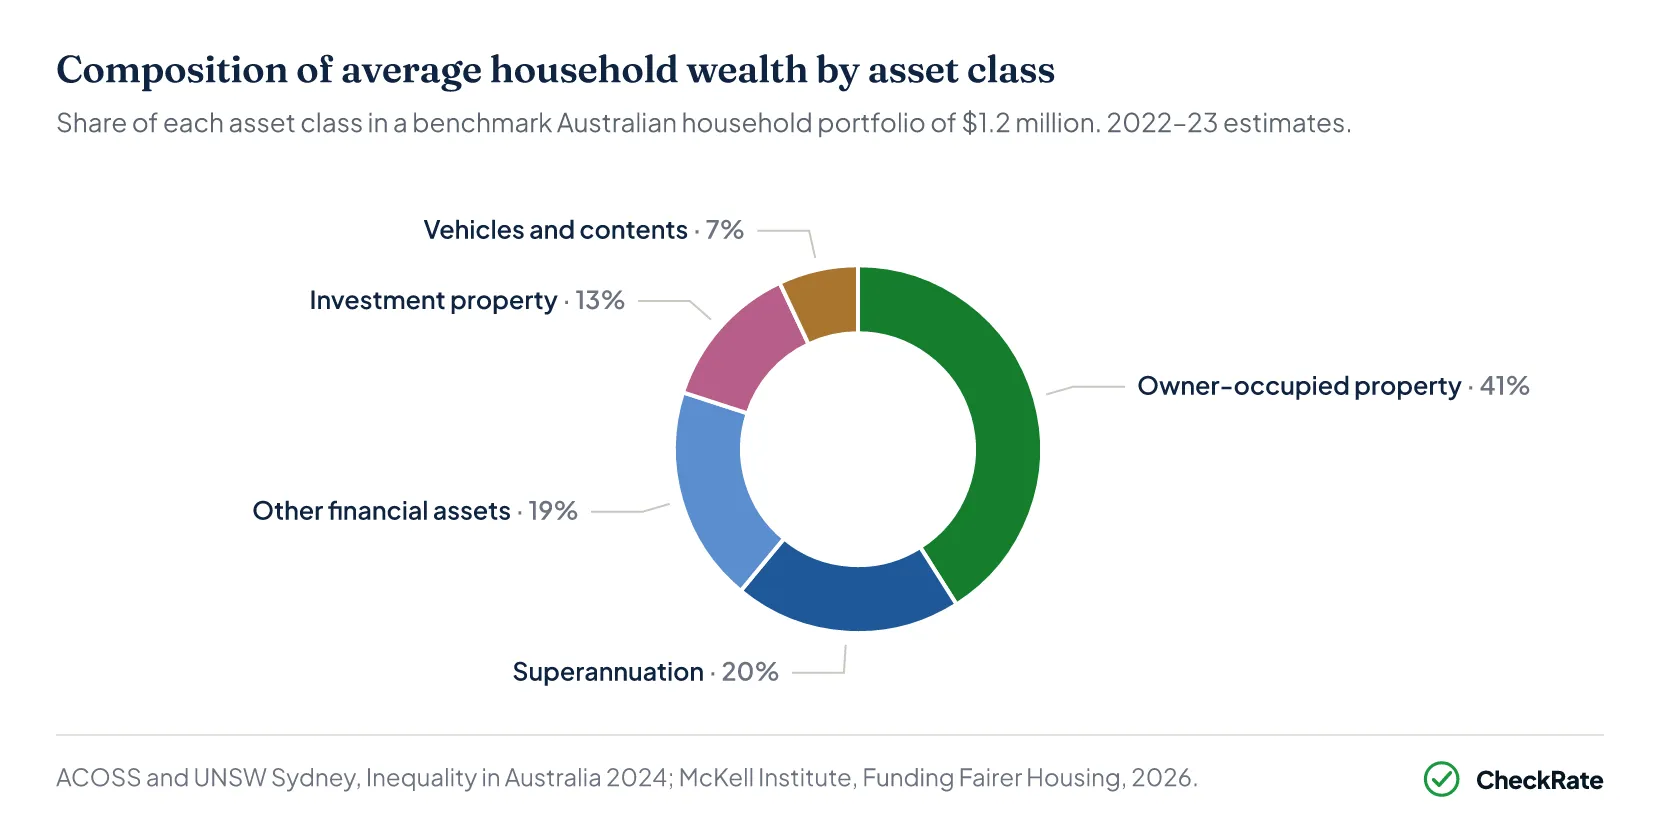
Property accounts for approximately 54% of average household wealth in Australia. The family home makes up about 41%, while investment properties add another 13%. Superannuation is the second-largest asset class, accounting for around 20% of average household wealth.
Between 1999 and 2024, Australian house prices rose by approximately 142% in real terms, while wages grew by around 44%. Property prices grew more than three times faster than wages, increasing the value of existing housing assets and widening the gap between house prices and earnings.
Those gains have not been spread evenly. The top 20% of households hold approximately 73% of net land wealth nationally, while the bottom 40% collectively hold negative net land wealth. This means their outstanding mortgage debt is higher than the current land value they own.
Renters have faced different pressures. Real rents have risen by approximately 50% over two decades, without the wealth-building effect that can come from owning property.
Tax settings also shape the divide between asset owners and non-owners. The 50% capital gains tax discount reduces the taxable portion of gains on assets held for more than 12 months. Negative gearing allows investment property losses to be offset against other taxable income when rental costs exceed rental income.
Around 82% of the total financial benefit from the capital gains tax discount flows to the top 10% of taxpayers. More than 2,500 investors hold 10 or more rental properties each, collectively controlling more than 33,000 dwellings.
Section 04 · Superannuation: balances by age and gender
The superannuation gender gap peaks before retirement
What is the average superannuation balance in Australia by age?
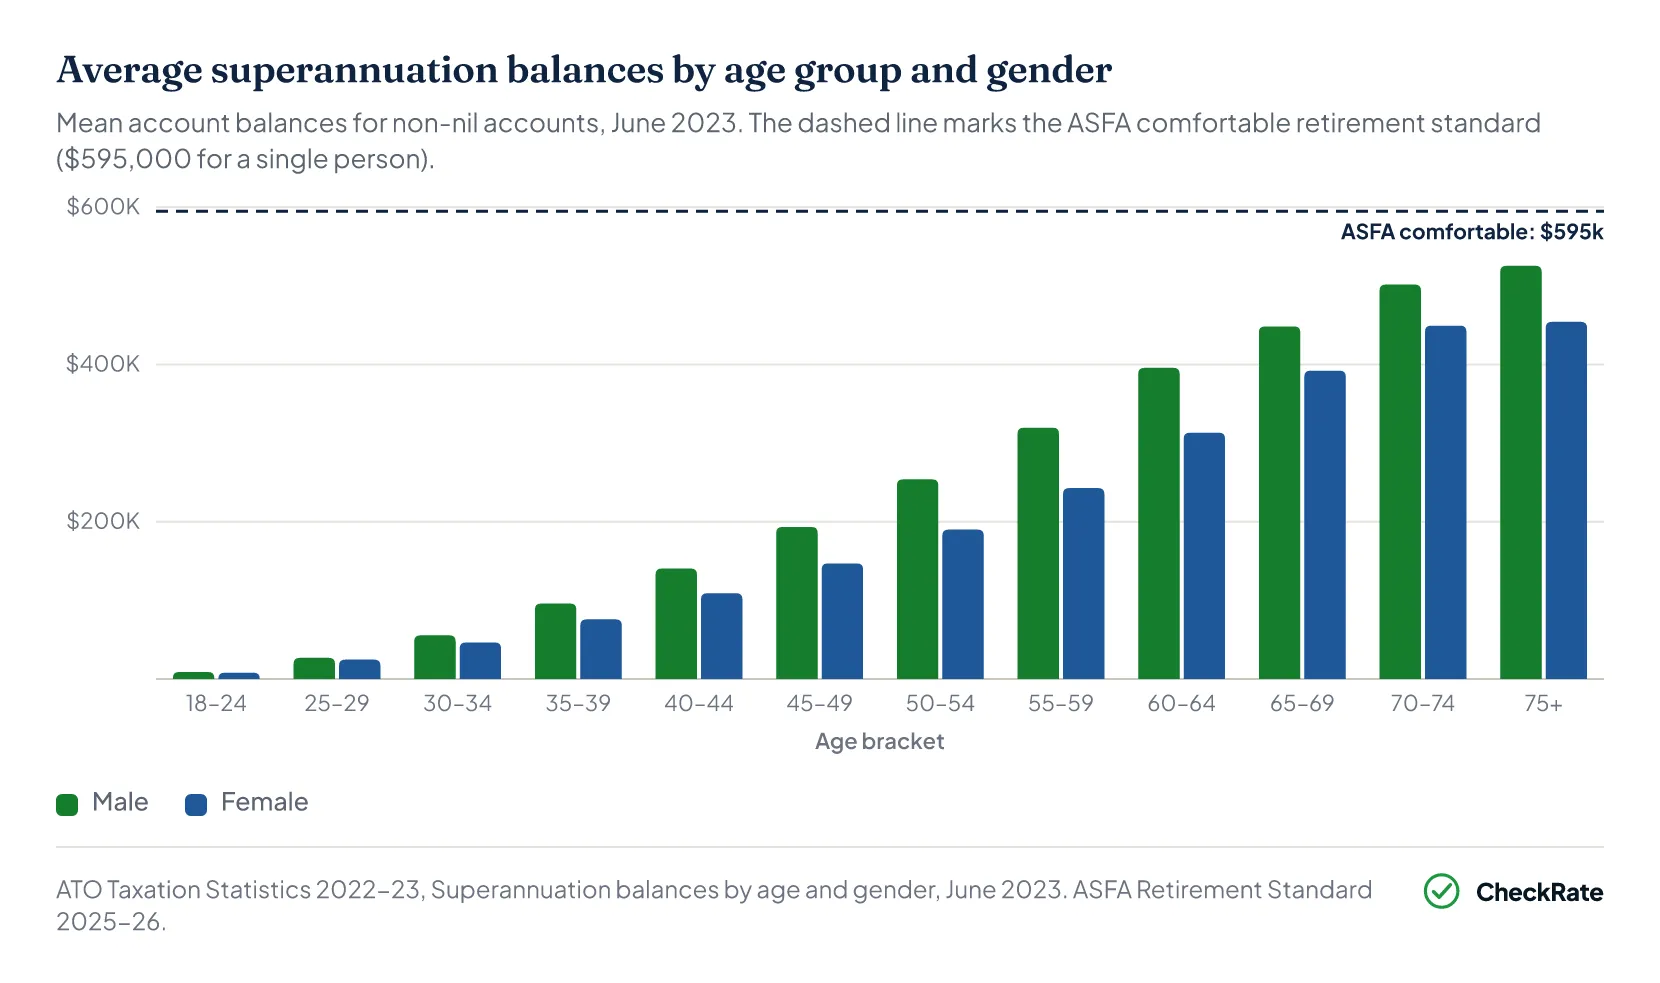
Super balances vary by age and gender. For Australians aged 60 to 64, the average balance was $395,852 for men and $313,360 for women at June 2023. That is a difference of $82,492, or 20.8%. The gender gap starts at less than $1,000 for younger workers and reaches its widest point in the 60 to 64 age group, just before retirement. Both average balances remain below the Association of Superannuation Funds of Australia (ASFA)'s $595,000 benchmark for a comfortable single-person retirement.
The super gender gap starts small and widens with age. At ages 18 to 24, the difference between male and female average balances is under $1,000. By ages 50 to 54, it has grown to nearly $64,000. It reaches its widest point at ages 60 to 64, at $82,492.
The gap does not close before retirement. It builds over decades as differences in earnings, hours worked, and time out of paid work affect super contributions.
The gap is shaped by the way the super system is linked to paid work. Super is calculated as a percentage of ordinary time earnings, meaning base wages for standard hours and excluding overtime. Periods of part-time work, unpaid work or time out of the workforce can therefore reduce the amount of super accumulated over time.
Women are more likely to take career breaks for caring responsibilities, work part-time, or be employed in lower-paid industries. Because super builds through regular contributions and investment returns, these differences can compound across a working life.
The super system has historically been built around continuous full-time employment, which does not reflect the working patterns experienced by many women.
| Full data: superannuation balances by age group and gender | |||||
|---|---|---|---|---|---|
| Age group | Male avg | Male median | Female avg | Female median | Avg gap (M–F) |
| Under 18 | $7,687 | $350 | $4,699 | $220 | $2,988 |
| 18–24 | $9,062 | $5,394 | $8,163 | $4,963 | $899 |
| 25–29 | $27,021 | $19,220 | $24,821 | $19,162 | $2,200 |
| 30–34 | $55,690 | $41,268 | $46,586 | $36,016 | $9,104 |
| 35–39 | $96,122 | $74,130 | $76,020 | $57,566 | $20,102 |
| 40–44 | $140,680 | $108,344 | $109,209 | $79,445 | $31,471 |
| 45–49 | $193,501 | $144,272 | $147,146 | $101,888 | $46,355 |
| 50–54 | $254,071 | $177,194 | $190,175 | $122,150 | $63,896 |
| 55–59 | $319,743 | $202,583 | $242,945 | $140,662 | $76,798 |
| 60–64 | $395,852 | $219,773 | $313,360 | $163,218 | $82,492 |
| 65–69 | $448,518 | $217,954 | $392,274 | $199,006 | $56,244 |
| 70–74 | $501,785 | $214,749 | $449,540 | $215,202 | $52,245 |
| 75 or more | $525,627 | $185,228 | $454,333 | $179,928 | $71,294 |
Source · ATO Taxation Statistics 2022–23, Superannuation balances by age and gender, June 2023.
Section 05 · Wealth across age groups
Older Australians hold the highest household wealth
How does household net worth vary by age in Australia?
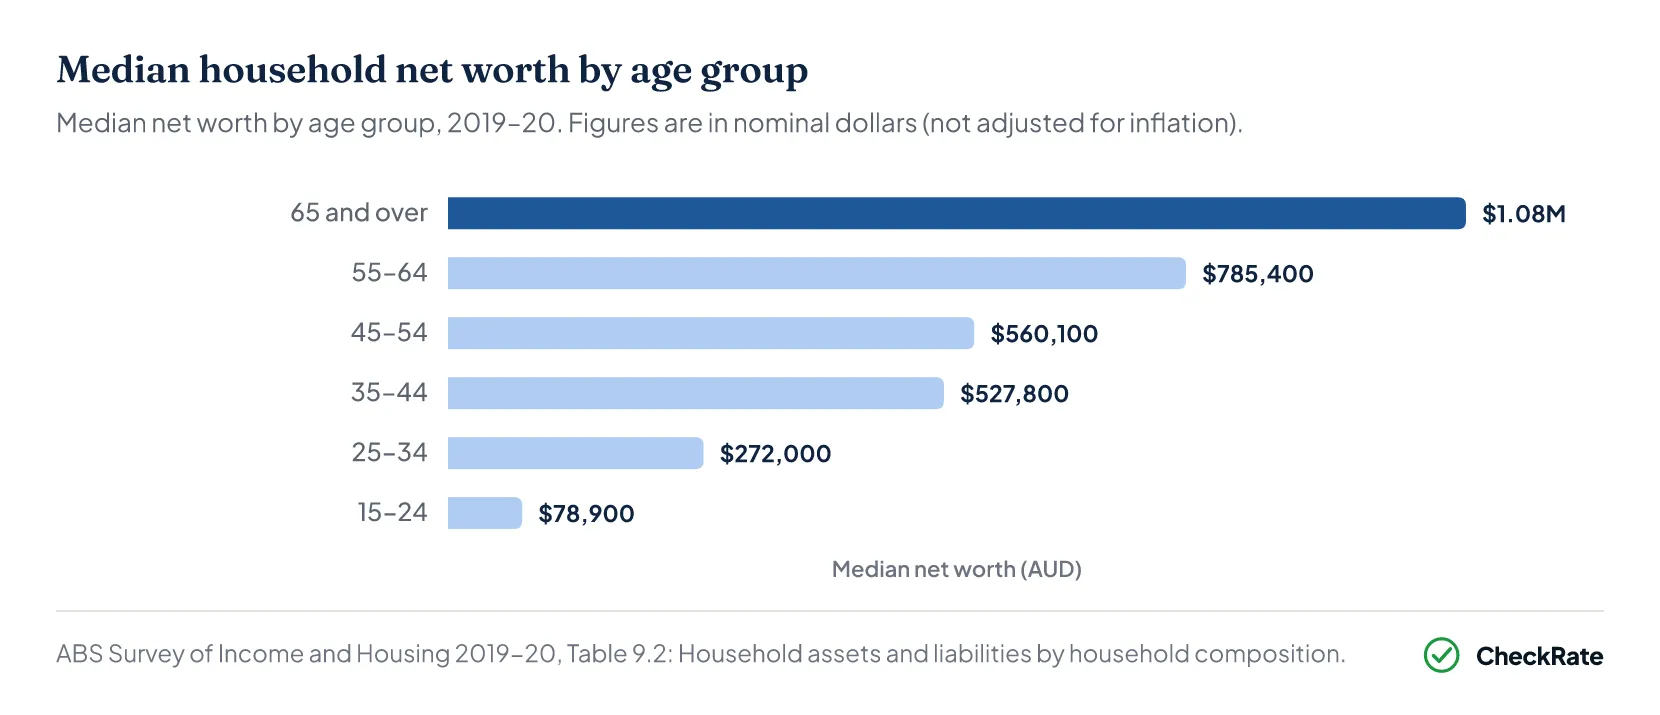
Net worth rises with age. Households aged 65 and over had a median net worth of $1,083,300, compared with $272,000 for those aged 25 to 34 and $78,900 for those under 25. This is a 14-fold difference between the oldest and youngest groups.
Much of older households' wealth is held in mortgage-free property. On average, households aged 65 and over hold approximately $734,000 in fully paid-off net land wealth, built up over decades of property ownership and price growth.
Property is a major driver of the age-based wealth divide. In 1999, the median house price was roughly 4.4 times median income. By 2024, it had risen to approximately 8.6 times. This means the main wealth-building asset of the past 25 years has become harder for younger households to access.
For younger households on average wages in major cities, higher price-to-income ratios indicate greater barriers to entering the property market. Households that remain outside the property market may continue facing rental costs without building housing equity.
Section 06 · Income versus wealth
Wealth is distributed less evenly than income in Australia
Income inequality in Australia is moderate by international standards. Progressive tax rates, minimum wage settings and the industrial award system help keep earnings more evenly distributed than in many comparable countries.
Why wealth grows differently from income
Wealth inequality works differently. Capital gains on assets held for more than 12 months receive a tax discount, and investment property losses can be offset against other income. Asset values can also compound over time, allowing wealth to grow faster than wages for households that already own property or other investments.
This means two households with similar incomes can end up in very different positions by retirement. A household that bought a home in a major city in 2005 and held it to 2025 may have accumulated substantial capital gains. A household that did not buy property will not have built that housing equity.
Income data on its own gives an incomplete picture. A high earner who rents, recently entered the workforce or carries student debt may have good income but limited wealth. Someone on more modest wages who bought a home earlier may have built substantial wealth despite earning less.
Section 07
Explore Australian wealth data
- Median net worth
- $78,900
- Mean net worth
- $126,500
- Median net worth
- $272,000
- Mean net worth
- $389,100
- Median net worth
- $527,800
- Mean net worth
- $560,100
- Median net worth
- $560,100
- Mean net worth
- $827,800
- Median net worth
- $785,400
- Mean net worth
- $1.09M
- Median net worth
- $1.08M
- Mean net worth
- $1.33M
References
- ABS Australian National Accounts: Finance and Wealth, December 2025 · Australian Bureau of Statistics
- ABS Household Income and Wealth, Australia, 2019-20 · Australian Bureau of Statistics
- ACOSS and UNSW Sydney: Inequality in Australia 2024 · povertyandinequality.acoss.org.au
- ATO Taxation Statistics: average superannuation balances by age group and gender, 2022-23 · ato.gov.au
- ASFA Retirement Standard, December quarter 2025 · superannuation.asn.au
- McKell Institute: Funding Fairer Housing (2026) · mckellinstitute.org.au
- ABS: Household and Family Projections, 2021 to 2046 · Australian Bureau of Statistics