

Published
Featured research
 Housing2 Jul 2026Australian home ownership statistics: how many Australians own their home?The 2021 Census counted 10,852,208 occupied private dwellings across Australia. Roughly two in three were owner-occupied, split almost evenly between households that own outright and those still payin…
What shapes an RBA decision
The Reserve Bank looks at a mix of signals before each cash rate decision, from prices and jobs to wages and household spending. These pages explain the indicators it watches, and the dates below show when the remaining 2026 decisions are announced.
The signals the Reserve Bank watches
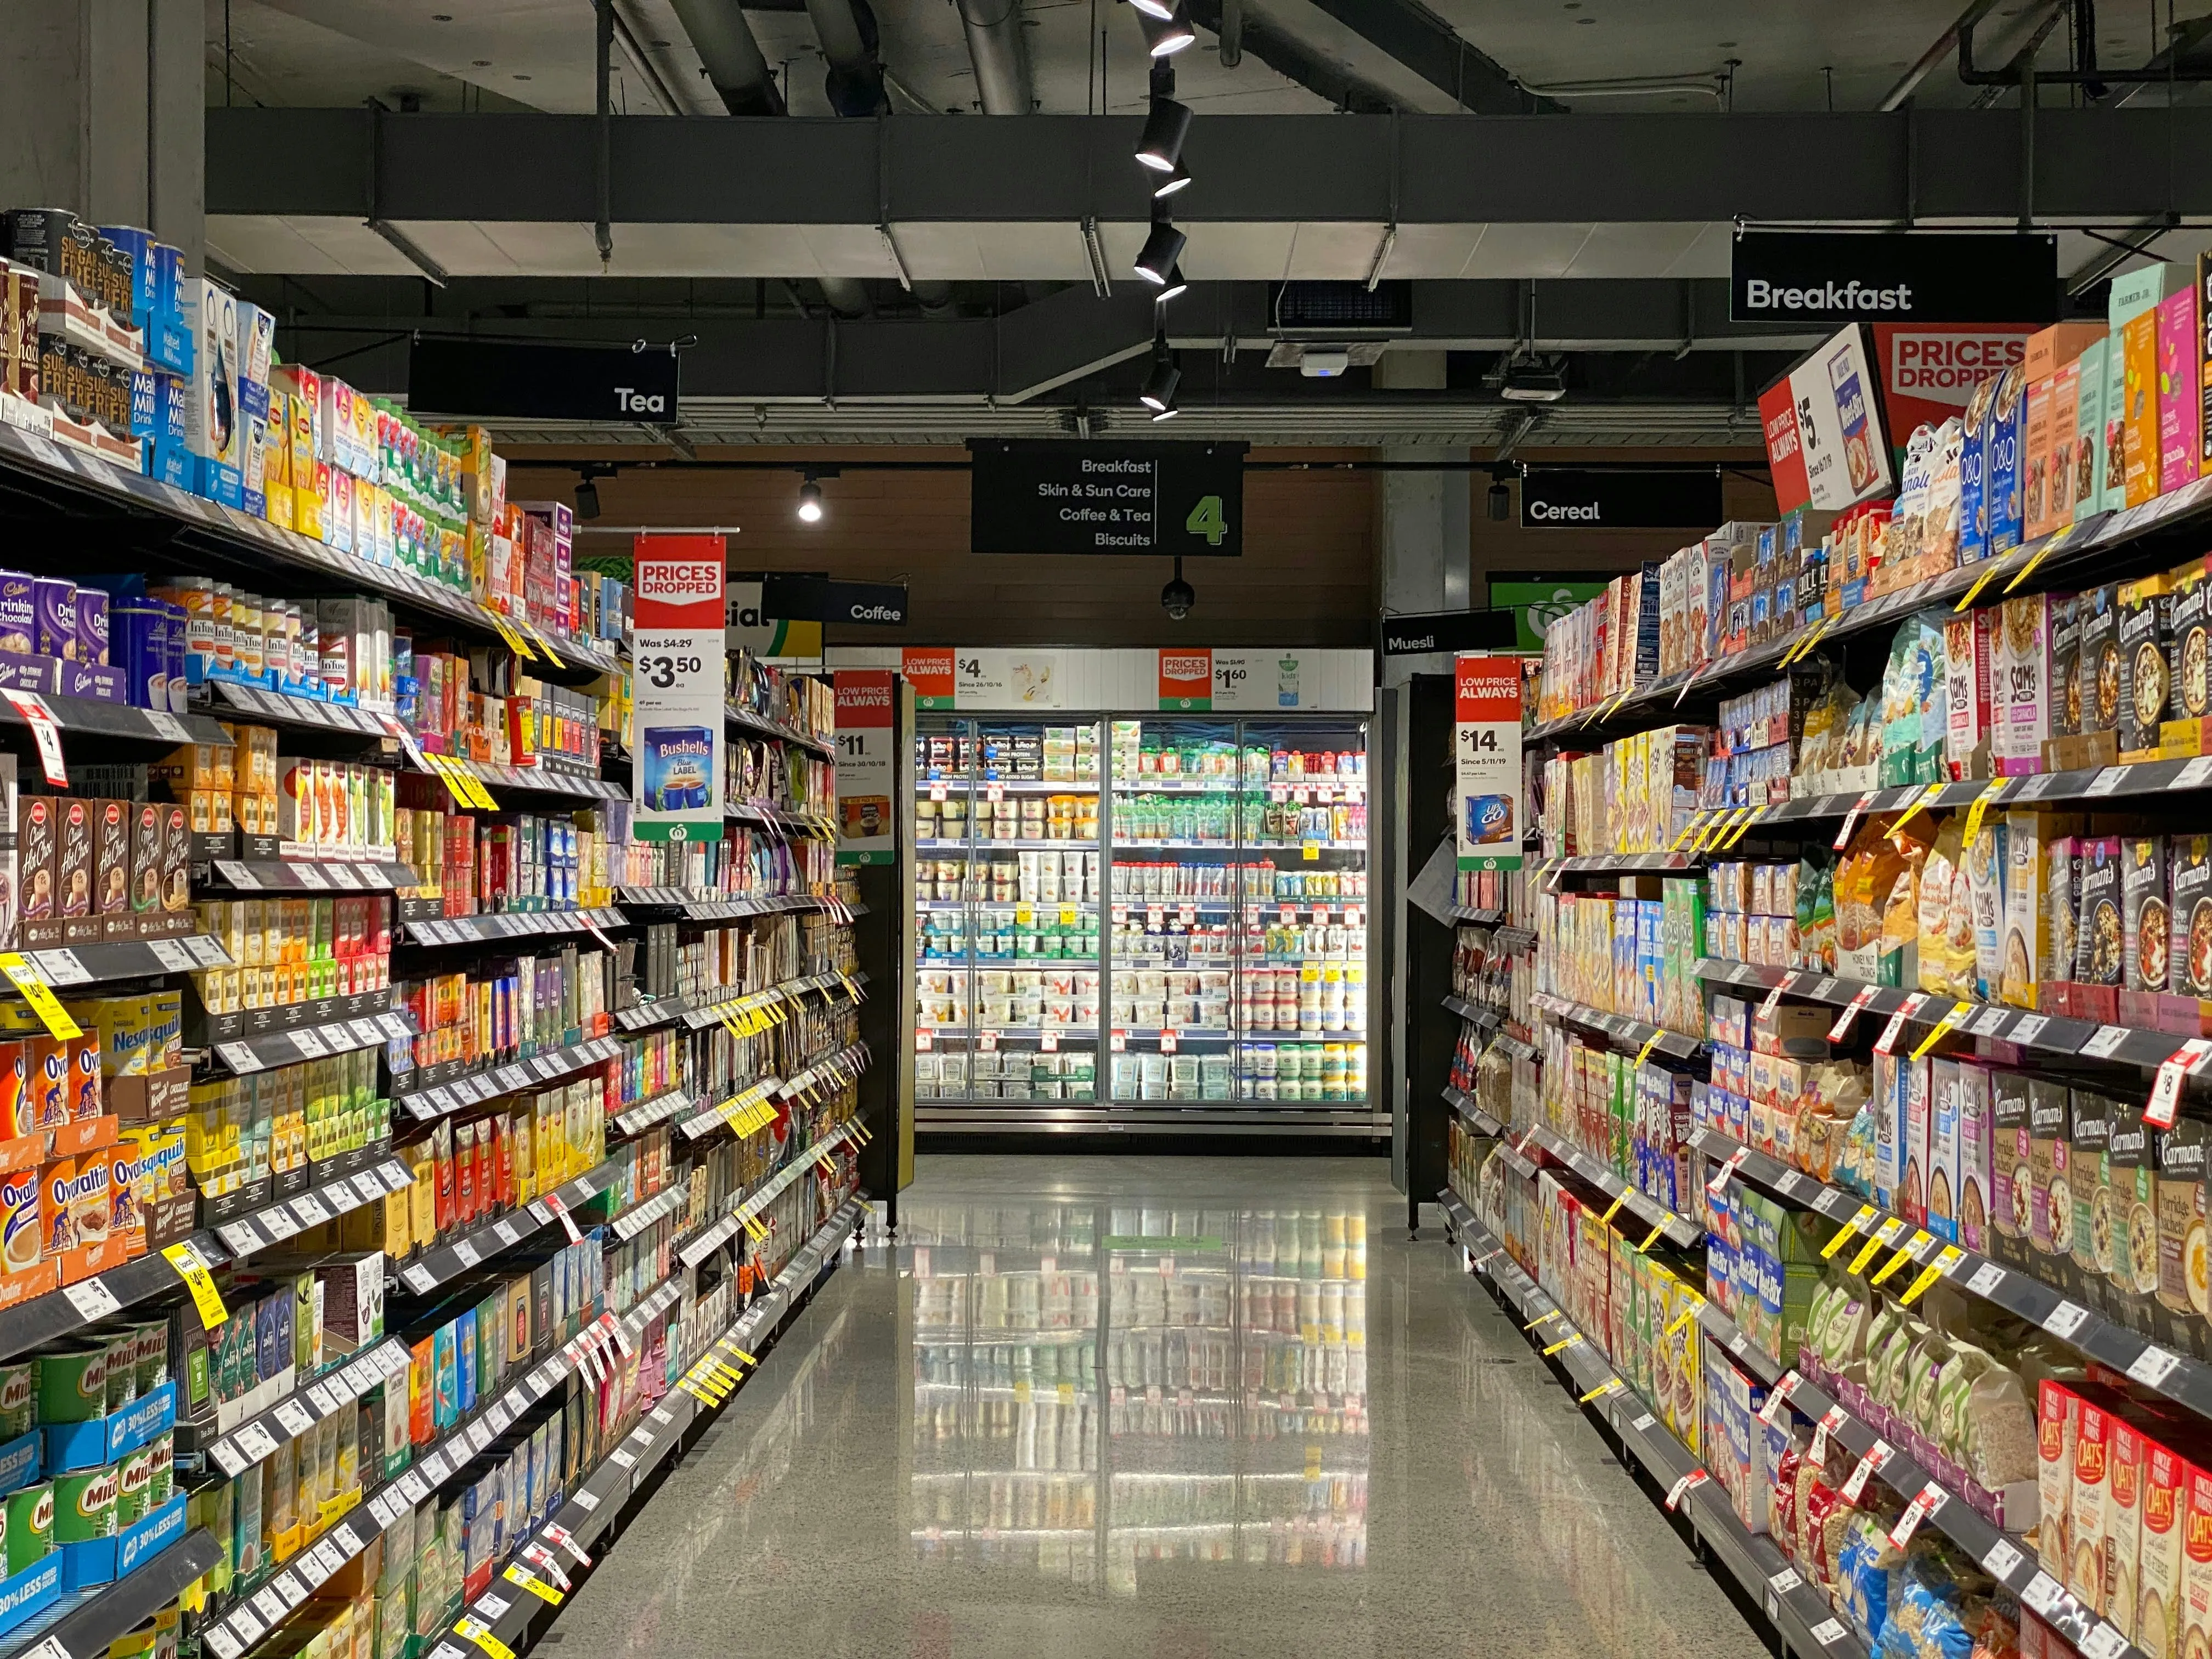 Spending5 Oct 2026What everyday spending says about the economySpending is one of the clearest ways to see how households are feeling.
 Employment9 Oct 2026Why the RBA watches the jobs market so closelyEmployment matters because it sits right at the centre of household life. For most people, wages, salaries or business income are what pay the rent, cover the mortgage, fill the trolley, keep the ligh…
 Inflation9 Oct 2026Understanding changes in the cost of livingAustralia’s inflation target is 2 to 3%, but most households do not experience inflation as a neat number.
RBA cash rate decisions still to come in 2026
- Sep29Monetary policy decision
- Nov03Monetary policy decision
- Dec08Final 2026 monetary policy decision
Australia by the numbers
How we source our data
Authoritative sources
We use reliable sources like the RBA, ABS, APRA, CoreLogic and lenders directly, so readers can see where the information comes from.
Transparent methodology
Every article cites its sources and explains any calculations clearly, using trusted public data so readers can check the numbers.
No sponsored rankings
Our data and analysis are not shaped by paid placements or commercial partnerships. We present the information as it appears in the data.
Latest insights
View all analysis → Housing15 Oct 2026Stamp duty by state: how much do home buyers pay in Australia?For most home buyers, stamp duty is the single biggest upfront cost after the deposit, adding between $28,179 and $53,057 at average state dwelling prices in June quarter 2026. It is a state governmen…
 12 Oct 2026Card surcharges and merchant fees in Australia: what businesses pay and what changed in October 2026Businesses paid an average total merchant fee of 1.00% of the transaction value on Visa credit cards in the June quarter 2026. Mastercard credit cards cost 0.99%. Mastercard debit cards cost 0.59% and…Inflation9 Oct 2026Understanding changes in the cost of livingAustralia’s inflation target is 2 to 3%, but most households do not experience inflation as a neat number.