


Published
- Median taxable income (ATO)
- $55,868
- Midpoint of all individual tax returns, 2022–23
- Median income, all employees (ABS)
- $74,100
- Midpoint of all workers including part-time, August 2025
- Top 10% income threshold
- $142,000+
- Taxable income needed to reach the top 10% of Australian earners
- Below the poverty line
- 14.2%
- Share of Australians living below the relative poverty threshold in 2025
 What is considered a high income in Australia in 2026?Australia doesn't have a single official definition of a high income. Three separate government thresholds each serve a different purpose, ranging from $101,000 for singles under the Medicare levy sur…
 Australian income tax brackets: the full history since 1983The 2026–27 scale changed in one respect from 1 July 2026. The rate on income between $18,201 and $45,000 fell from 16% to 15% on 1 July 2026 under the Treasury Laws Amendment (More Cost of Living Rel…
 Australian wages and wealth since 2000: why higher pay has not gone as farThe average full-time Australian worker earned $2,051.10 a week in ordinary-time wages in November 2025, equal to $106,657 a year. That was 157% higher than in November 2000, when the same measure was…
Section 01 · National overview
Median income in Australia vs average salary
The median taxable income in Australia was $55,868 in 2022-23. The median is the midpoint of the income range, meaning half of all individual taxpayers earned more and half earned less.
The full-time average salary commonly quoted in Australia was $106,657. Both figures come from official sources, but they measure different groups.
The Australian Taxation Office (ATO) records income for people who file tax returns, including part-time workers, casual employees, retirees with some taxable income, and platform or contract workers. Because this is a broad group, the median taxable income is lower.
The Australian Bureau of Statistics (ABS) collects earnings data through employer payroll records, and some ABS figures cover full-time workers only. This can push the average much higher, especially when higher earners are included.
Within each dataset, the gap between the mean and the median also matters. The mean is the mathematical average: all incomes are added together and then divided by the number of people.
A small number of very high earners, such as senior executives, specialist doctors, and top earners in finance and mining, can pull the mean well above where most Australians sit.
The median is less affected by very high earners because it simply marks the midpoint.
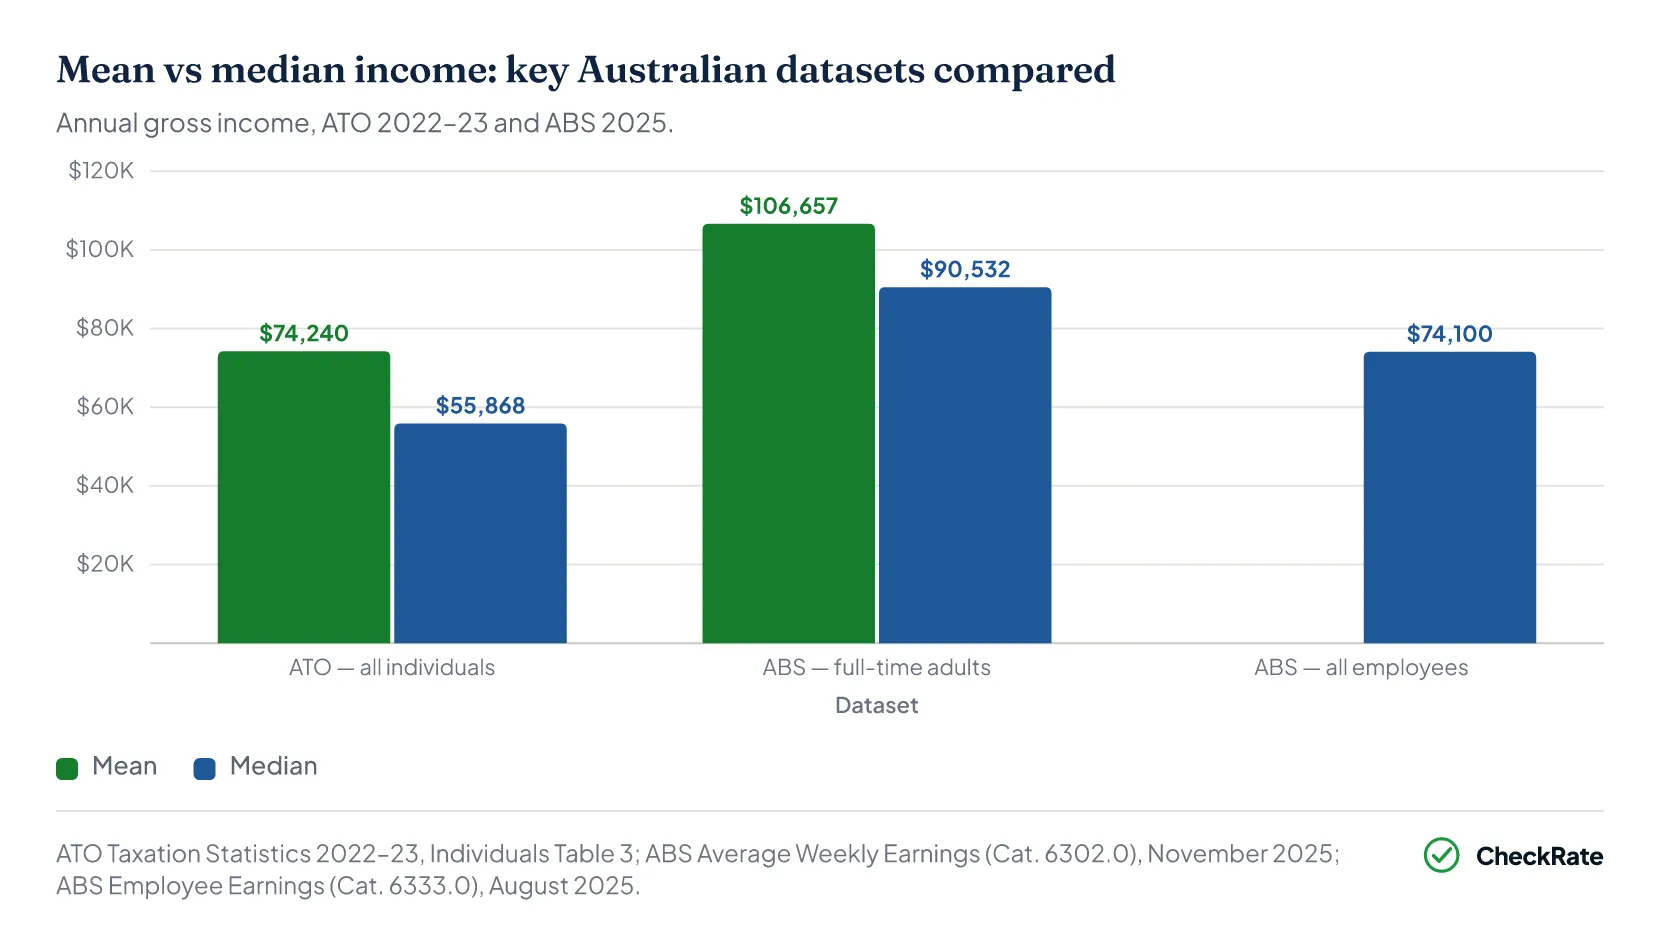
The ABS all-employees median of $74,100 per year, or $1,425 per week, is a useful single figure for comparing individual incomes. It covers full-time and part-time workers, uses recent data, and is not pulled upward by high earners in the same way as the mean. It is a useful benchmark for describing typical employee income, living costs and mortgage affordability.
What is the latest median income in Australia?
It depends on which dataset is used. The ATO median, which is the midpoint of all individual tax returns, was $55,868 in 2022–23. The ABS median for all employees, including part-time workers, was $74,100 per year, or $1,425 per week, as at August 2025. The ATO figure is lower because it includes people working minimal hours or reporting small amounts of secondary income. The ABS figure is higher because it covers people who are actively employed.
Why does the ATO show a lower income figure than the ABS?
The ATO records everyone who files a tax return, including people working a few hours a week, casual workers between jobs, and retirees with a small taxable income. The ABS collects income data from employer payroll records and counts workers who are actively employed. Limiting the count to full-time adult workers produces a higher figure, $106,657, because it excludes many part-time and low-hour workers who pull the broader average down. Both figures are accurate. They answer different questions.
Which income figure best represents what the typical Australian earns?
The ABS median for all employees, $74,100 per year, is generally a useful benchmark. It represents the midpoint of actively employed Australians, uses recent data, and is not skewed by very high earners in the same way as the mean. The ATO median of $55,868 is more useful for comparisons with the broader taxpayer population, which includes many low-hour earners and people with secondary income sources. The ABS full-time median of $90,532 applies specifically to people in full-time work.
Section 02 · Deciles & percentiles
What each income decile earns: from the bottom 10% to the top 10%
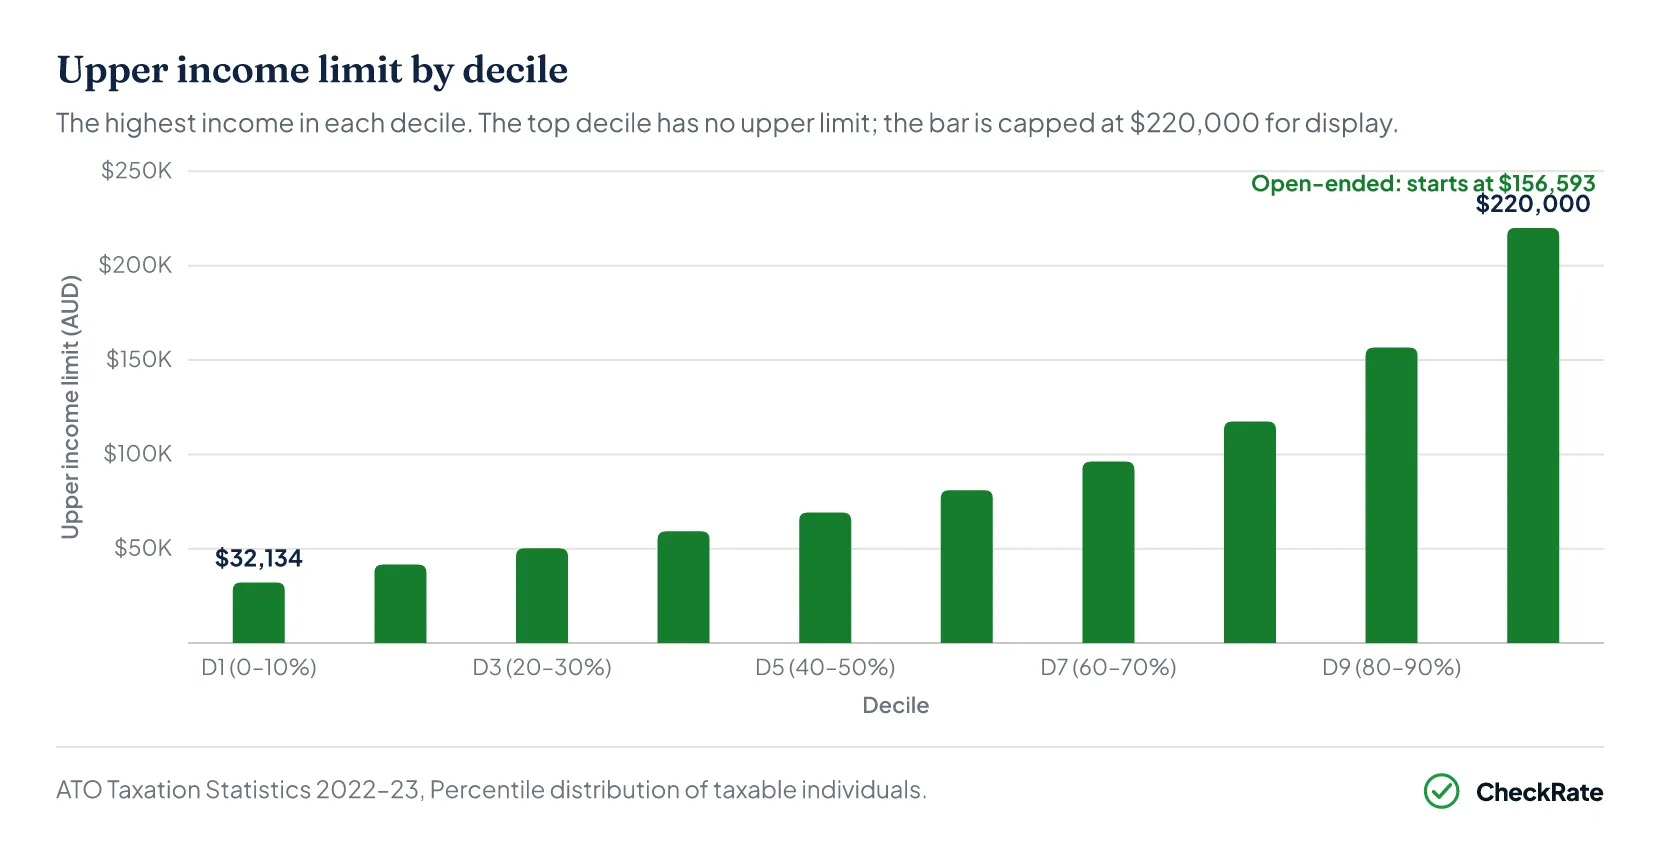
The 12.6 million Australians who reported a positive taxable income in 2022–23 can be divided into ten income groups, known as deciles. Each decile contains about 1.26 million people.
The bottom decile earns up to $32,134 per year. The middle deciles range from $59,216 to $81,008. The top decile starts at $156,593, with no upper limit.
| Income by decile: taxable income thresholds and individual counts | ||||
|---|---|---|---|---|
| Decile | Income range | Upper limit | Number of people | Income class |
| Bottom 10% | Up to $32,134 | $32,134 | 1,264,830 | Low income |
| 10th–20th | $32,135 – $41,590 | $41,590 | 1,264,802 | Low income |
| 20th–30th | $41,591 – $50,201 | $50,201 | 1,264,783 | Lower-middle |
| 30th–40th | $50,202 – $59,215 | $59,215 | 1,264,790 | Lower-middle |
| 40th–50th (median) | $59,216 – $69,161 | $69,161 | 1,264,680 | Middle |
| 50th–60th | $69,162 – $81,008 | $81,008 | 1,264,817 | Middle |
| 60th–70th | $81,009 – $96,173 | $96,173 | 1,264,745 | Upper-middle |
| 70th–80th | $96,174 – $117,412 | $117,412 | 1,264,747 | Upper-middle |
| 80th–90th | $117,413 – $156,592 | $156,592 | 1,264,768 | High income |
| Top 10% | $156,593 and above | No upper limit | 1,264,767 | High income |
Source · ATO Taxation Statistics 2022–23, Percentile distribution of taxable individuals by taxable income, state/territory and sex.
The income ranges within each decile are not evenly sized. Lower deciles span narrow bands while upper deciles span much wider ones. A $100,000 salary, for example, sits in approximately the 73rd percentile of ATO taxpayers, well above most of the working population.
Where does a $100,000 income rank in Australia?
A gross income of $100,000 sits around the 73rd to 74th percentile of ATO taxable individuals. This means it is higher than the income reported by about 73% of the 12.6 million people in the dataset. Against the ABS all-employees distribution, $100,000 is above the median of $74,100, but below the 75th percentile threshold of about $110,604. This places it in the upper-middle income range. These are all pre-tax figures.
How many Australians earn more than $150,000 per year?
The 90th percentile upper limit is $156,592, which means about 1.26 million taxable individuals in the top decile earned above this level in 2022–23. Because $150,000 falls within the 80th to 90th percentile band, rather than above it, a slightly larger group earned more than $150,000. That is roughly 1.3 million to 1.4 million people, or about 10% to 11% of the ATO dataset.
What percentage of Australians earn more than $50,000?
The upper limit of the 30th percentile is $50,201. This means around 70% of taxable individuals earned more than $50,000 in 2022–23, or about 8.8 million Australians. The remaining 30%, or about 3.8 million people, earned $50,201 or less. This group includes many part-time and casual workers, as well as people who only worked for part of the year.
Section 03 · Low income
What counts as a low income in Australia?
Three figures show the lower end of Australia's income scale in 2026. The national minimum wage is $948 per week, or $49,296 per year. The ACOSS relative poverty line, set at 50% of median household income for a single adult, is $584 per week, or $30,368 per year. The base JobSeeker payment is $404.35 per week, or $21,026 per year. That is $179.65 below the poverty line. An estimated 3.7 million Australians, or 14.2% of the population, live below the poverty threshold.
A full-time minimum wage worker sits $364 per week above the poverty line. A person relying solely on the base JobSeeker payment is $179.65 per week below it.
ACOSS poverty line
- Relative poverty threshold · single adult
$584 per week
JobSeeker payment
- Government base rate · March 2026
$404 per week — $179.65 below poverty line
The $179.65 weekly gap between the base JobSeeker payment and the poverty line shows how limited that income is for people who rely on it alone. At that level, paying market rent and covering basic utilities can be difficult without other income or government supplements.
People already below the poverty line have incomes averaging $390 per week below the threshold. For families with children, the average gap is $464 per week. This shows that the shortfall is not small or temporary for many households.
The minimum wage offers more protection for people in full-time work. It sits $364 per week above the poverty line. However, many Australians work part-time, casually, or in contract and platform-based roles, and do not earn the full annualised minimum wage.
A casual worker on the minimum award rate working 20 hours per week earns about $25,945 per year, based on $24.95 per hour over 52 weeks. That is above the poverty line, but leaves little room for higher rent, utilities, transport or other essential costs.
What is the poverty line for a single person in Australia in 2026?
The ACOSS relative poverty line for a single adult in 2026 is $584 per week, or $30,368 per year. ACOSS, the Australian Council of Social Service, sets this at 50% of national median household income. An estimated 3.7 million Australians, or 14.2% of the population, live below this level. Because it is a relative measure, the poverty line moves with median household income rather than tracking a fixed cost of living. Other poverty measures also exist. These include the Henderson poverty line and the OECD threshold, which uses 60% of median income and produces higher figures.
Is JobSeeker enough to live on in Australia in 2026?
The base JobSeeker payment of $404.35 per week, or $21,026 per year, sits $179.65 per week below the ACOSS poverty line of $584 per week. A single adult relying only on the base rate, without Rent Assistance or other supplements, falls below the poverty threshold. Some recipients receive Rent Assistance and other payments that reduce this gap, but many remain below the poverty line even with those additions.
How many Australians are below the poverty line?
Approximately 3.7 million Australians, or 14.2% of the population, live below the ACOSS relative poverty line, defined as 50% of median household income. People below the line have incomes averaging $390 per week below the threshold. Families with children average $464 per week below it. The share rises to around 17% to 20% under the OECD measure, which uses 60% of median income as the threshold.
Section 04 · Middle income
What counts as a middle income in Australia?
The middle 20% of all employees, those between the 40th and 60th percentiles, earn between approximately $65,000 and $88,400 per year. The median for all employees is $74,100 per year or $1,425 per week.
At the median income of $74,100, a worker earns more than half the workforce and less than the other half. Because the median is based on position rather than an average, it is not pulled upward by high earners. This makes it a useful single figure for representing the typical Australian in employment.
What that income covers depends heavily on where a person lives. The same $74,100 will usually go further in regional areas than in high-cost inner-city markets such as Sydney, where rent can take up a much larger share of income. In major capital cities, housing, transport and everyday costs can leave less room in the budget for someone earning around the national median.
The gender pay gap at the median
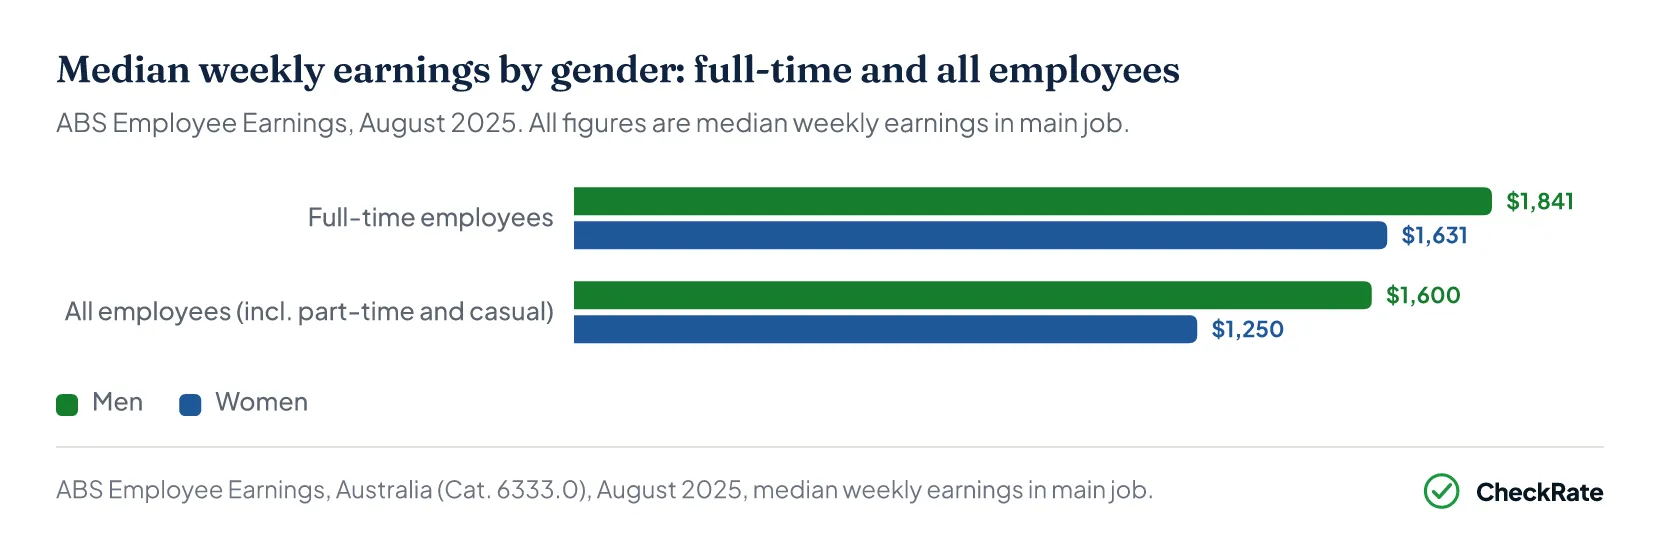
Among full-time workers, the median gender pay gap is $210 per week, or $10,920 per year. Men earn a median of $1,841 per week, or $95,732 per year, compared with $1,631 per week, or $84,812 per year, for women.
When part-time and casual workers are included, the gap widens to $350 per week, or $18,200 per year.
What is considered a middle-class income in Australia in 2026?
Statistically, the middle class covers the middle 20% of earners, between the 40th and 60th percentiles of the all-employee income distribution. This range runs from about $65,000 to $88,400 per year, with the median at $74,100 per year, or $1,425 per week. People in this range typically earn too much to qualify for most government support, but may have limited money left over for saving or investing after housing and everyday costs, especially in major capital cities.
How large is the gender pay gap in Australia in 2026?
Among full-time adult workers, it is $210 per week, or $10,920 per year. Men earn a median of $1,841 per week, compared with $1,631 per week for women. Across all employment types, including part-time and casual roles, the gap grows to $350 per week, or $18,200 per year, as women hold a higher share of part-time roles. The gap has narrowed since the 1970s but persists due to differences in occupation type, career breaks linked to caring responsibilities, and lower representation in senior roles.
At what age do Australians earn the most?
The 45 to 54 age group records the highest median weekly earnings, at $1,750 per week, or $91,000 per year. Earnings typically rise through the 20s and 30s as workers gain skills and experience, peak between 45 and 54, then taper as workers approach retirement. This means younger workers who are starting families or trying to buy a home may still be some distance from their highest-earning years.
Section 05 · Top 10%
What income puts an individual in the top 10% of Australian earners?
A taxable income above $142,000 places an individual in the top 10% of Australian earners, based on Parliamentary Budget Office modelling. The ATO's income distribution data puts the entry point higher, at $156,593, because it only covers people with a positive taxable income. Together, the two sources suggest the top 10% threshold sits between $142,000 and $157,000, covering about 1.26 million people.
Western Australia has a higher share of top income earners
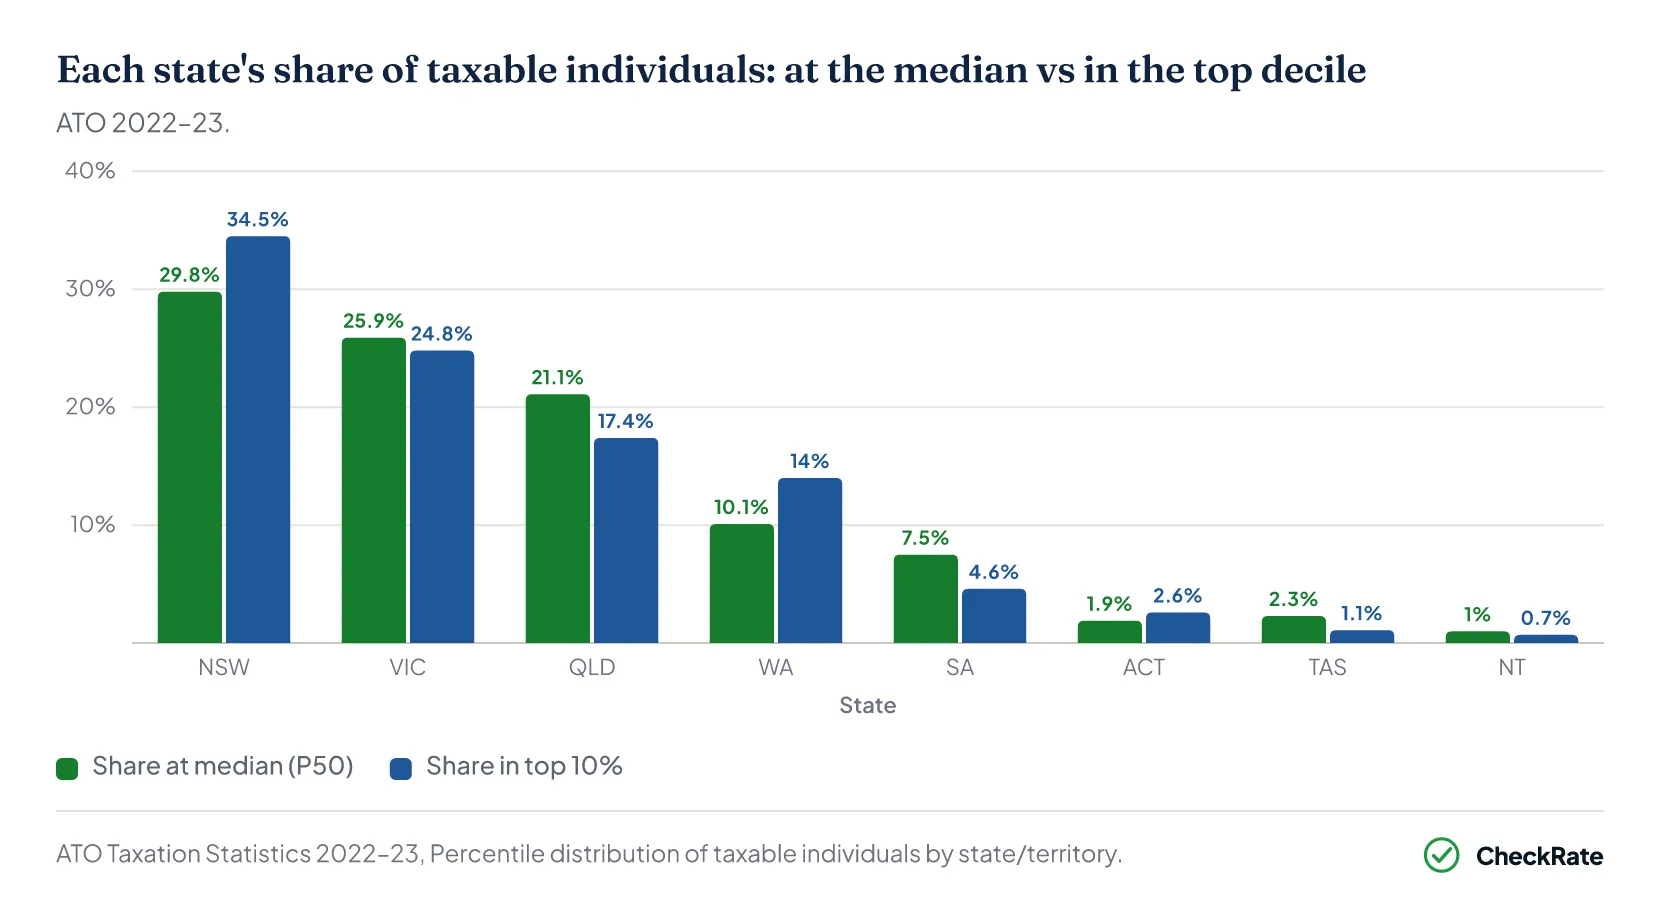
Western Australia accounts for around 10.1% of people with taxable income at the median, broadly in line with its population share. In the top decile, its share rises to 14.0%.
The ACT also has a higher share of top earners than its population size suggests. It accounts for 2.6% of the top decile, despite representing about 1.9% of the median distribution. This reflects the concentration of senior public sector and professional services jobs in Canberra.
WA's advantage is not evenly spread across all upper-income groups. Its share rises from 10.1% at the median to 14.0% in the top decile, but falls back to 11.2% among the top 1%.
That pattern reflects WA's strength in well-paid mining roles below the very highest income levels. The top 1% is more heavily concentrated in NSW and Victoria, where corporate and financial sector earners make up a larger share of the highest-income group.
What salary puts an individual in the top 10% in Australia?
A declared taxable income above $142,000 places an individual in the top decile of Australian taxpayers, based on Parliamentary Budget Office modelling. The ATO puts the top decile entry point higher, at $156,593. The $14,593 difference reflects the different populations covered. The Parliamentary Budget Office covers all taxpayers, while the ATO data covers only the 12.6 million people with positive taxable income. Together, both sources point to a top 10% threshold in the $142,000 to $157,000 range. These figures include salary, wages and other taxable income, but exclude discounted capital gains. This means the actual income of some high earners may be higher than their declared taxable income.
Which Australian state has the highest income?
New South Wales has the largest share of high-income earners in absolute terms. It accounts for approximately 34.5% of the top decile despite representing about 29.8% of the median distribution. Western Australia has the highest over-representation relative to its population. Its share of the top decile is 14.0%, compared with 10.1% at the median. This reflects higher wages in the mining and resources sector. The ACT also has a higher share of top earners than its population size suggests, due to the concentration of senior public sector jobs in Canberra.
Why does WA have more high earners than its population would suggest?
WA's higher share of earners in the upper percentile range reflects the higher wages paid in the resources sector. Mining workers in WA often earn above national averages because of FIFO allowances, remote area loadings, overtime pay, and demand for specialised trades and engineering workers. WA's share of the top decile is 14.0%, compared with 10.1% at the median. That is a gap of nearly 4 percentage points. The advantage fades at the very highest income levels. NSW accounts for around 39% of the top 1%, consistent with the concentration of corporate and financial sector jobs in Sydney.
Section 06 · Top 1%
What income puts an individual in the top 1% of Australian earners?
A declared taxable income above $362,900 places an individual in the top 1% of Australian taxpayers, based on Parliamentary Budget Office modelling. The top 2% threshold is $262,400. These figures reflect declared taxable income only. They do not capture the full financial position of the wealthiest individuals, especially where capital gains are involved. Capital gains from assets such as property or shares may only be partly included in taxable income under CGT discount rules.
Why high-income earners can pay different tax rates
For most income levels, effective tax rates broadly follow the official tax scale. Above $187,000, however, the rate paid can vary more widely between individuals. For someone in the top 1% declaring $390,000, the lowest 10% of effective tax rates falls to just 19%.
That means 10% of people at this income level pay a lower effective tax rate than many Australians earning $71,000.
None of these arrangements are unlawful. They reflect options available under Australian tax law. They do illustrate that declared taxable income and actual income can differ considerably at the very top of the distribution. This is important when comparing income figures across different datasets.
What income puts an individual in the top 1% in Australia?
A declared taxable income above $362,900 places an individual in the top 1% of Australian taxpayers, based on Parliamentary Budget Office modelling. The ATO's own data shows the top 1% starting above $408,974, covering approximately 126,476 people. The Budget Office's lower threshold reflects a broader taxpayer population. Income from assets held for more than 12 months can qualify for the CGT 50% discount, meaning only half of that gain is counted as taxable income. This means some people in this group may have higher actual income than their declared taxable income shows.
How do the highest-earning Australians reduce their tax?
Several features of the tax system can reduce taxable income or the tax paid on some income types. These include
- The CGT 50% discount, which halves the taxable portion of capital gains on assets held for more than 12 months
- Large deductions, such as investment property loan interest
- Structuring income through a company, trust or self-managed superannuation fund at a lower tax rate
- Timing when assets are sold to control when a gain is declared
ATO data shows that 10% of people declaring $390,000 pay an effective tax rate as low as 19%, below the rate paid by many workers earning $71,000. These are lawful arrangements that reflect features of the tax system, not non-compliance.
What is the average income of the top 1% in Australia?
The precise mean income of the top 1% is not published directly in ATO summary tables. The ATO data shows the 99th percentile band spanning $292,594 to $408,973, with the top 1% starting above $408,974. The average capital gain alone for people in the top 1% was $850,690 in 2022–23. Given that some individuals in this group earn very high incomes, the mean income of the top 1% is likely to sit well above the entry threshold.
Section 07 · Income inequality
Income inequality fell in 2022–23
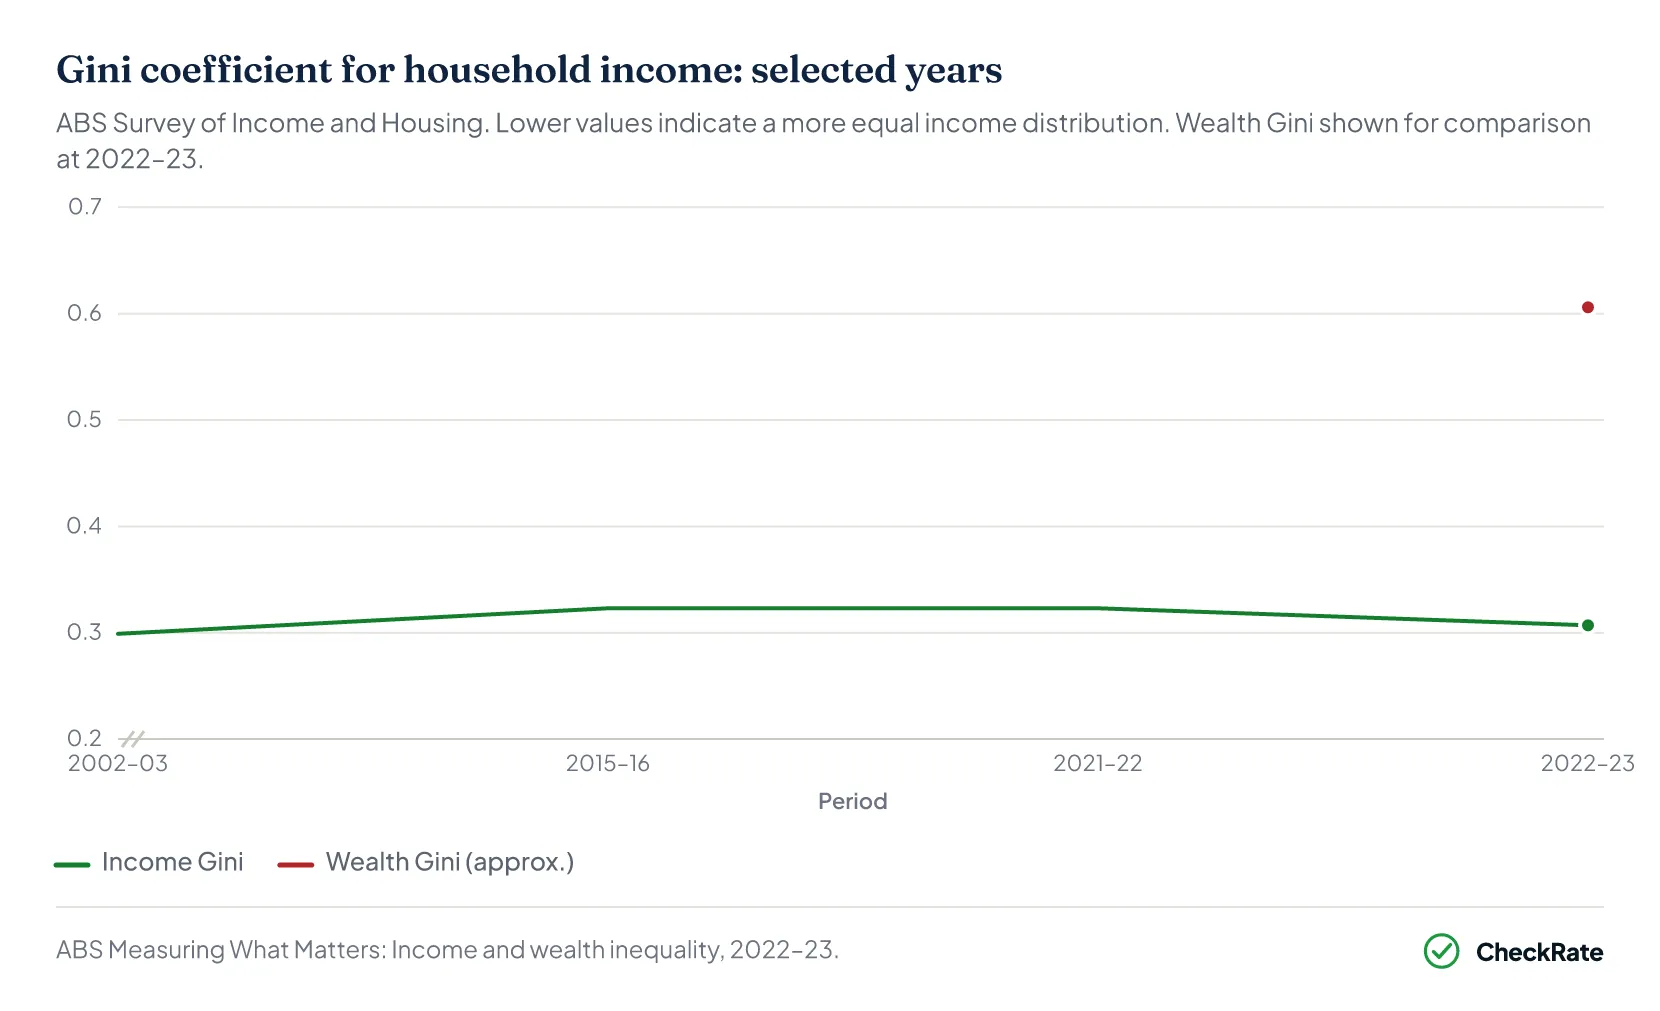
The Gini coefficient is a standard measure of how evenly income or wealth is spread across a population. A score of 0 means complete equality, while a score of 1 means one person holds everything. Australia's income Gini coefficient fell from 0.323 in 2021–22 to 0.307 in 2022–23, reversing the increase recorded in the previous period. The decline was linked to low unemployment and above-inflation minimum wage increases, which helped lift incomes at the lower end of the distribution faster than incomes at the top. Wealth inequality tells a different story. Australia's wealth Gini coefficient is approximately 0.606, more than twice the income Gini. This shows that while income inequality improved in 2022–23, wealth remains far more unevenly distributed than income.
Australia's income Gini was 0.323 in both 2015–16 and 2021–22, up from 0.299 in 2002–03, before falling to 0.307 in 2022–23. This means income inequality rose over the longer term before easing in the latest available year.
When unemployment is low, employers need to compete for workers across all types of jobs. That gives lower-paid workers more bargaining power and leads to faster wage growth at the lower end of the scale.
The 3.5% increase to the National Minimum Wage in 2025–26, following similar above-inflation rises in earlier years, lifted the income floor for the lowest-paid workers.
The gap between the income Gini (0.307) and the wealth Gini (approximately 0.606) is large.
While wages at the lower end of the job market have grown, the top decile continues to accumulate property, shares, and investment assets at a rate that lower-income groups cannot match through wages alone.
The two Gini coefficients describe genuinely different aspects of inequality in Australia.
Is income inequality getting better or worse in Australia?
Income inequality improved in the latest available data. The Gini coefficient fell from 0.323 in 2021–22 to 0.307 in 2022–23. The improvement was driven mainly by low unemployment and above-inflation minimum wage increases, which lifted wages at the lower end faster than at the top. Whether this continues will depend on labour market conditions, wage growth and government policy.
What does a Gini coefficient of 0.307 mean in practice?
The Gini coefficient runs from 0 to 1, where 0 means everyone earns the same and 1 means one person holds everything. A score of 0.307 means Australia's income distribution is moderately unequal. In global terms, Australia sits in a similar range to Germany, Canada and the United Kingdom. A Gini around 0.30 typically means the top 20% of households receive about 40% to 45% of household income, while the bottom 20% receive around 7% to 9%. The ABS figure is based on after-tax income adjusted for household size, which better reflects what households have available to spend.
Why is wealth inequality so much higher than income inequality in Australia?
Income is earned over a year and flows broadly through the economy. Wealth accumulates over a lifetime through property price growth, investment returns, superannuation, and business ownership, and it grows faster for people who start with more. The benefit of the CGT discount is heavily concentrated: the top 10% of income earners receive about 83% of it, and the top 1% alone receive close to 60%. This means investment gains flow mainly to those who already hold large assets. The concentration of investment property among higher-income households contributes to the wealth Gini, which has not improved in the same way as the income Gini has.
Section 08 · Income finder
Find a position in the income distribution
Enter a gross (before-tax) income to see where it sits among 12.6 million Australians with a taxable income, how it compares to key income thresholds, and which income class it falls into. Based on ATO data for 2022–23.
Income percentile finder
See where your gross income sits among Australian taxable individuals — your percentile, how many people earn less and more, and which milestones you have passed.
| Taxable income by percentile, Australia, 2022–23 | |
|---|---|
| Percentile | Taxable income range |
| 1 | Up to $22,240 |
| 2 | $22,241 – $23,506 |
| 3 | $23,507 – $24,679 |
| 4 | $24,680 – $25,761 |
| 5 | $25,762 – $26,856 |
| 6 | $26,857 – $27,939 |
| 7 | $27,940 – $29,022 |
| 8 | $29,023 – $30,076 |
| 9 | $30,077 – $31,105 |
| 10 | $31,106 – $32,134 |
| 11 | $32,135 – $33,160 |
| 12 | $33,161 – $34,111 |
| 13 | $34,112 – $35,053 |
| 14 | $35,054 – $35,999 |
| 15 | $36,000 – $36,949 |
| 16 | $36,950 – $37,897 |
| 17 | $37,898 – $38,834 |
| 18 | $38,835 – $39,759 |
| 19 | $39,760 – $40,668 |
| 20 | $40,669 – $41,590 |
| 21 | $41,591 – $42,499 |
| 22 | $42,500 – $43,400 |
| 23 | $43,401 – $44,274 |
| 24 | $44,275 – $45,011 |
| 25 | $45,012 – $45,833 |
| 26 | $45,834 – $46,702 |
| 27 | $46,703 – $47,578 |
| 28 | $47,579 – $48,441 |
| 29 | $48,442 – $49,330 |
| 30 | $49,331 – $50,201 |
| 31 | $50,202 – $51,089 |
| 32 | $51,090 – $51,978 |
| 33 | $51,979 – $52,872 |
| 34 | $52,873 – $53,769 |
| 35 | $53,770 – $54,663 |
| 36 | $54,664 – $55,554 |
| 37 | $55,555 – $56,458 |
| 38 | $56,459 – $57,374 |
| 39 | $57,375 – $58,297 |
| 40 | $58,298 – $59,215 |
| 41 | $59,216 – $60,133 |
| 42 | $60,134 – $61,073 |
| 43 | $61,074 – $62,029 |
| 44 | $62,030 – $62,998 |
| 45 | $62,999 – $63,986 |
| 46 | $63,987 – $64,983 |
| 47 | $64,984 – $65,996 |
| 48 | $65,997 – $67,030 |
| 49 | $67,031 – $68,089 |
| 50 | $68,090 – $69,161 |
| 51 | $69,162 – $70,240 |
| 52 | $70,241 – $71,349 |
| 53 | $71,350 – $72,480 |
| 54 | $72,481 – $73,634 |
| 55 | $73,635 – $74,800 |
| 56 | $74,801 – $75,997 |
| 57 | $75,998 – $77,220 |
| 58 | $77,221 – $78,459 |
| 59 | $78,460 – $79,719 |
| 60 | $79,720 – $81,008 |
| 61 | $81,009 – $82,353 |
| 62 | $82,354 – $83,722 |
| 63 | $83,723 – $85,127 |
| 64 | $85,128 – $86,573 |
| 65 | $86,574 – $88,052 |
| 66 | $88,053 – $89,536 |
| 67 | $89,537 – $91,072 |
| 68 | $91,073 – $92,726 |
| 69 | $92,727 – $94,422 |
| 70 | $94,423 – $96,173 |
| 71 | $96,174 – $97,995 |
| 72 | $97,996 – $99,840 |
| 73 | $99,841 – $101,761 |
| 74 | $101,762 – $103,776 |
| 75 | $103,777 – $105,847 |
| 76 | $105,848 – $108,012 |
| 77 | $108,013 – $110,228 |
| 78 | $110,229 – $112,526 |
| 79 | $112,527 – $114,916 |
| 80 | $114,917 – $117,412 |
| 81 | $117,413 – $119,840 |
| 82 | $119,841 – $122,416 |
| 83 | $122,417 – $125,431 |
| 84 | $125,432 – $128,713 |
| 85 | $128,714 – $132,329 |
| 86 | $132,330 – $136,319 |
| 87 | $136,320 – $140,679 |
| 88 | $140,680 – $145,490 |
| 89 | $145,491 – $150,730 |
| 90 | $150,731 – $156,592 |
| 91 | $156,593 – $163,262 |
| 92 | $163,263 – $170,833 |
| 93 | $170,834 – $178,890 |
| 94 | $178,891 – $187,520 |
| 95 | $187,521 – $200,515 |
| 96 | $200,516 – $218,176 |
| 97 | $218,177 – $244,451 |
| 98 | $244,452 – $292,593 |
| 99 | $292,594 – $408,973 |
| 100 | $408,974 and above |
Source · ATO Taxation Statistics 2022–23, Percentile distribution of taxable individuals.
References
- ATO, Taxation statistics 2022-23, Individuals Table 16: percentile distribution of taxable individuals, by taxable income and sex · ato.gov.au
- ABS, Average Weekly Earnings, Australia, Nov 2025 · Australian Bureau of Statistics
- ABS Employee Earnings, Australia · Australian Bureau of Statistics
- Parliamentary Budget Office, Revenue foregone due to Capital Gains Tax discount for individuals and trusts · pbo.gov.au
- e61 Institute, Effective Tax Rate micronote (ATO administrative data) · e61.in
- ACOSS / UNSW, Poverty in Australia 2025: Overview · acoss.org.au
- Fair Work Commission, Annual Wage Review 2025–26: National Minimum Wage · fairwork.gov.au
- Services Australia, JobSeeker Payment rates (effective 20 March 2026) · servicesaustralia.gov.au
- ABS, Household Income and Wealth, Australia 2024 · Australian Bureau of Statistics
- ABS, Measuring What Matters: Income and wealth inequality, 2022–23 · Australian Bureau of Statistics