


Updated
- $923B
- Total tracked spending in 2025, up from $606B in 2016
- +52%
- Rise in tracked expenditure since 2016, with +19.8% in 2022 alone
- $2,856
- Estimated weekly spend per household in 2025, up from $1,956 in 2016
- $86.2B
- December 2025: the highest single month on record
 Average grocery bill in Australia: what households spendThe average Australian household spends $178 a week on groceries in 2025, up from $168 in 2024 and $160 in 2023. Over three years, that is an $18 rise at the checkout, or roughly $936 more a year.
 Australian mortgage statistics 2026Australia had about 9.3 million occupied private dwellings at the 2021 Census. Of these, around 3.24 million (35.0%) were owned with a mortgage, 2.87 million (31.0%) were owned outright, and 2.84 mill…
 Australian electricity costs 2026: average bills, prices and household spendingAustralian household electricity usage was valued at $23.9 billion in 2024–25, up from $11.674 billion in 2009–10. That represents an increase of around 105% in nominal terms over 15 years.
Section 01 · National spending
A decade of rising household costs
Australian households spent a combined $923 billion across tracked consumer categories in 2025, up 52% from $606 billion in 2016. When housing costs are included, the average household is estimated to need around $12,376 per month to maintain its standard of living.
The ABS Monthly Household Spending Indicator tracks nine categories: food, health, transport, recreation, hospitality, clothing, furnishings, alcohol and tobacco, and miscellaneous goods. Mortgage repayments and rent are not included, so these figures only show part of total household spending.
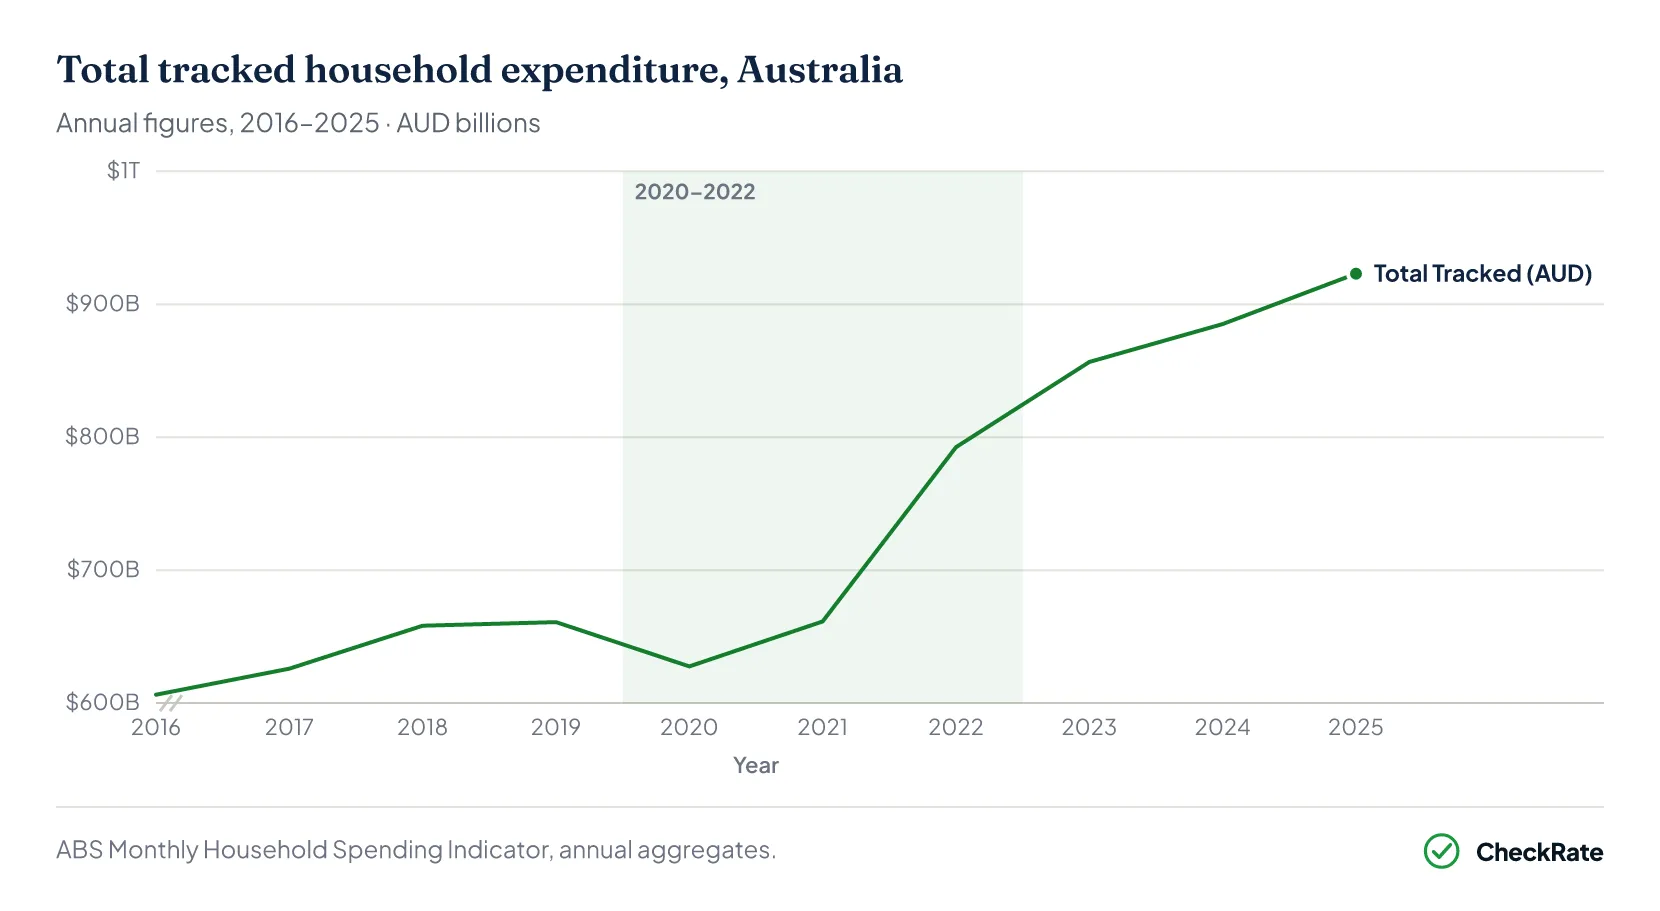
Between 2016 and 2019, spending rose steadily, increasing by 9% over four years of contained inflation. The pandemic interrupted that pattern. In 2020, total tracked expenditure fell to $627.6 billion, the only annual decline in the dataset.
The lowest month on record was April 2020, when Australians spent just $39.8 billion nationally as lockdowns closed large parts of hospitality, retail and transport almost overnight.
APR 2020
The pandemic low
April 2020 recorded the lowest monthly household spending in the dataset, at $39.8 billion. Hotels, cafes and restaurants fell sharply from their usual 10% share of spending, while transport, clothing and recreation also dropped. Only food and health spending held firm.
2022 SURGE
The post-lockdown spending jump
In 2022, total tracked expenditure rose from $661.4 billion to $792.5 billion, an increase of almost $131 billion in twelve months. It was the sharpest annual rise in the dataset, driven by pent-up demand, strained supply chains and higher fuel costs.
When do Australians spend the most?
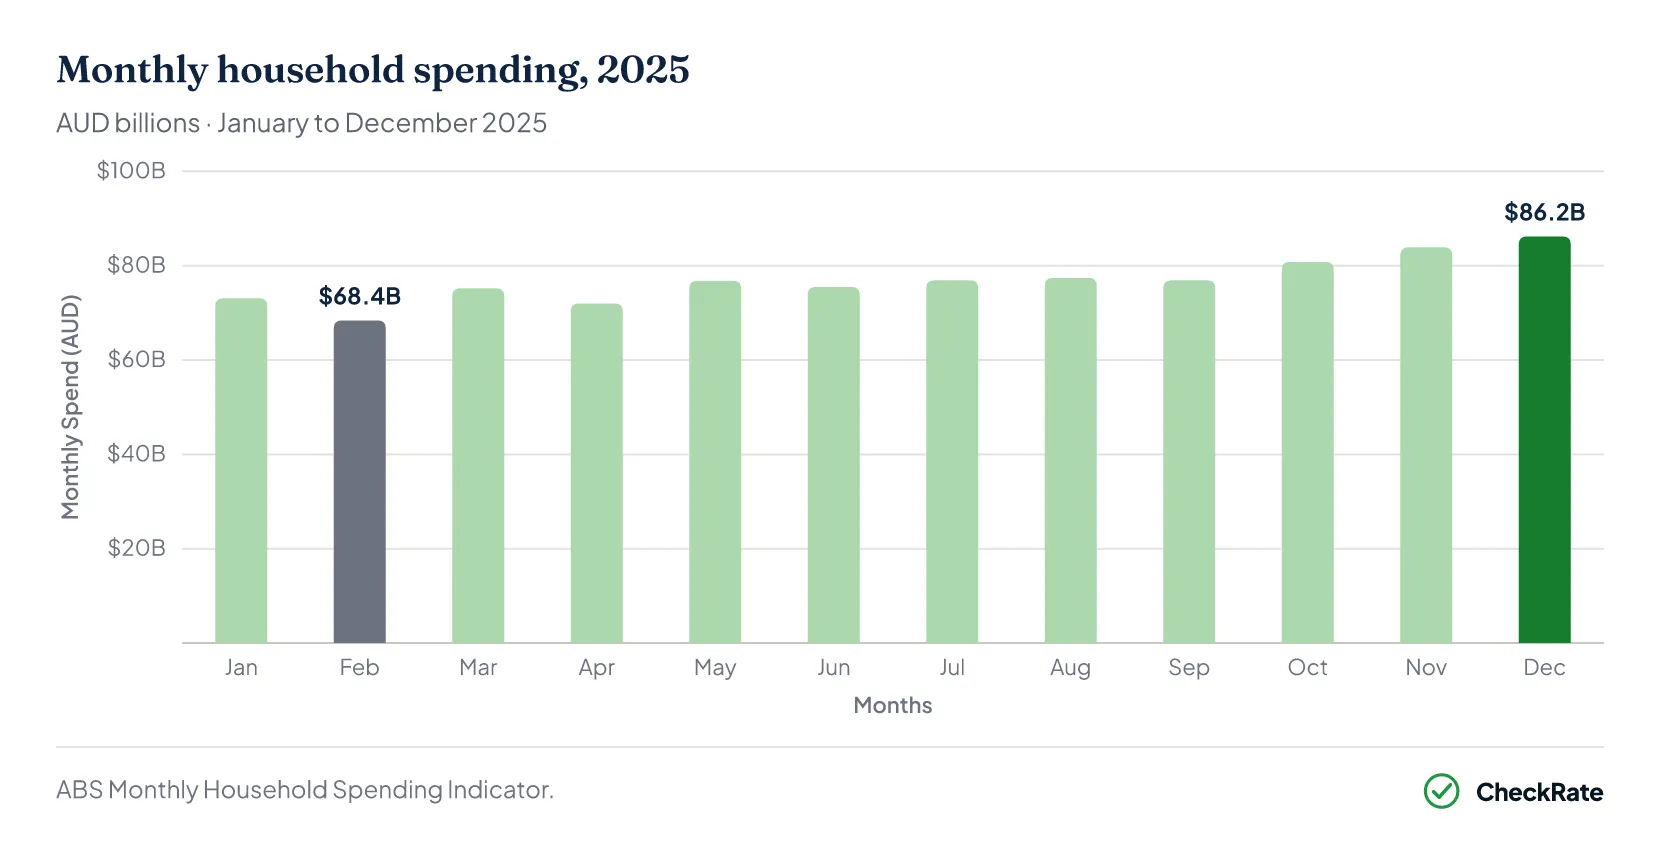
Seasonal patterns are a consistent feature of Australian household spending. In 2025, monthly totals climbed from a February low of $68.4 billion to a December high of $86.2 billion, a swing of $17.8 billion within a single calendar year. That December figure was 5.2% higher than December 2024 and the highest month recorded in the dataset.
December spending consistently runs 15–20% above the February trough, driven by Christmas retail, summer hospitality and school-year preparation. February is usually lower because it has fewer days and follows the holiday spending period. This seasonal pattern holds across every year in the dataset.
Section 02 · What the money goes on
What do Australians spend their money on?
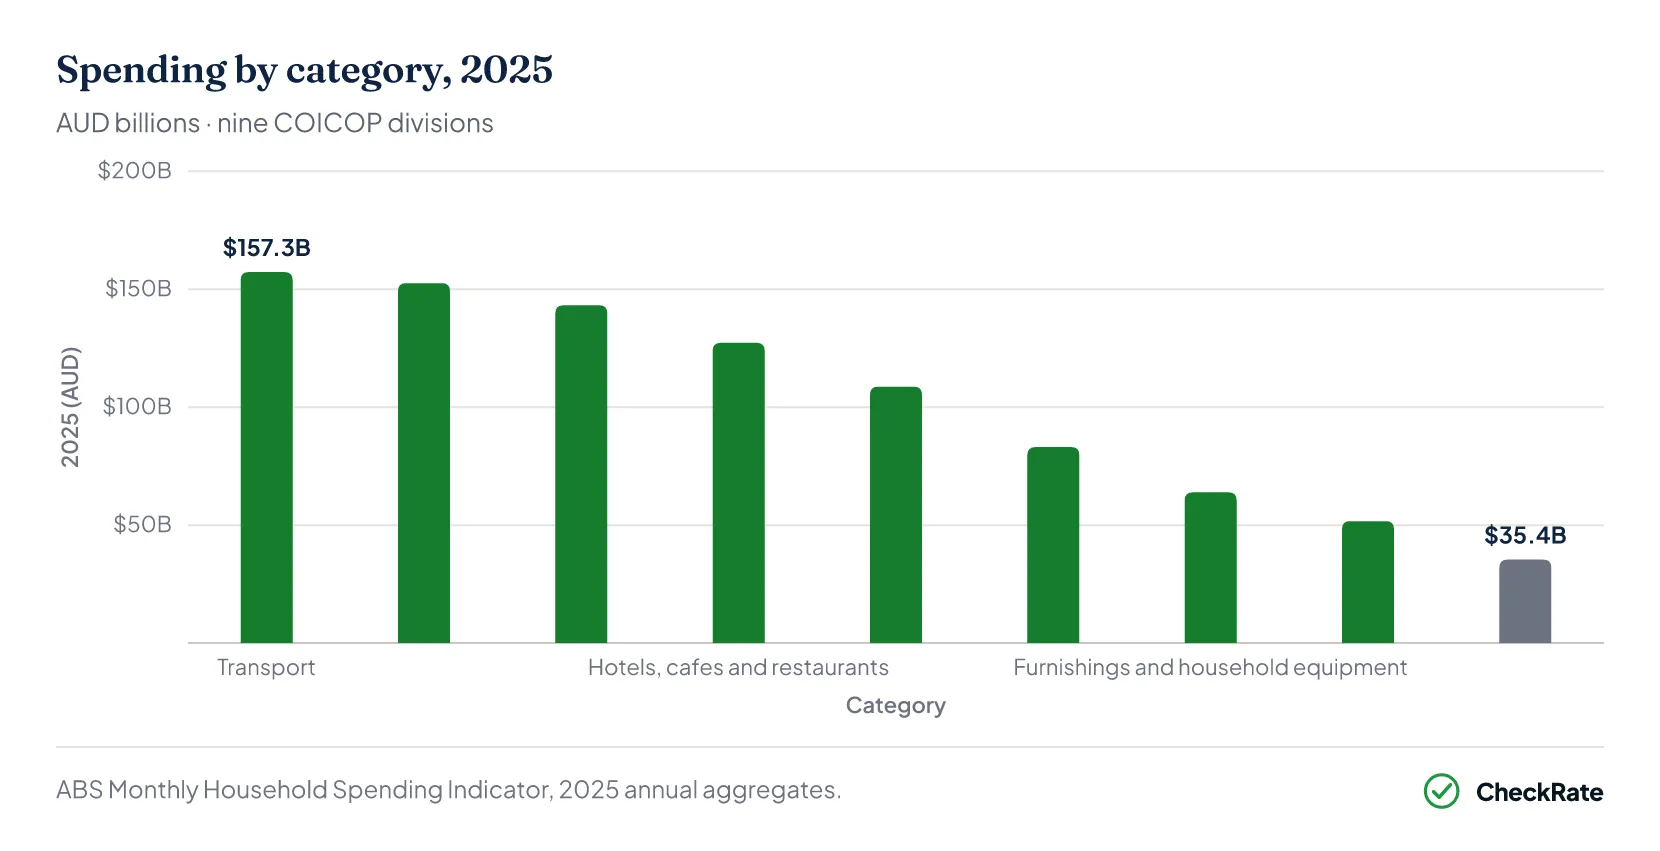
Transport is the single largest tracked category at $157.3 billion in 2025, up from $101.9 billion in 2016. Recreation and culture ($152.6 billion) and food ($143.2 billion) follow closely, with those three categories together accounting for nearly half of all tracked national expenditure.
Health spending was among the fastest-growing categories, rising 73% from $62.7 billion in 2016 to $108.7 billion in 2025.
Hotels, cafes and restaurants rose by 75%, from $72.8 billion to $127.3 billion, reflecting both higher spending on eating out and rising service-sector costs after the pandemic.
Category data: 2016 vs 2025
Highlighted rows show the fastest-growing categories and the only category to decline.
| Tracked household spending by category · AUD billions | ||||
|---|---|---|---|---|
| Category | 2016 ($B) | 2025 ($B) | Change | National share |
| Hotels, cafes and restaurants | 72.8 | 127.3 | +74.9% | 13.8% |
| Health | 62.7 | 108.7 | +73.3% | 11.8% |
| Food | 92.6 | 143.2 | +54.7% | 15.5% |
| Transport | 101.9 | 157.3 | +54.3% | 17.0% |
| Recreation and culture | 100.5 | 152.6 | +51.8% | 16.5% |
| Clothing and footwear | 35.3 | 51.7 | +46.5% | 5.6% |
| Miscellaneous goods and services | 58.3 | 83.1 | +42.5% | 9.0% |
| Furnishings and household equipment | 45.6 | 63.9 | +40.0% | 6.9% |
| Alcohol and tobacco | 36.4 | 35.4 | −2.8% | 3.8% |
| Total (tracked categories) | 606.3 | 923 | +52.2% | 100% |
Source · ABS Monthly Household Spending Indicator.
How has health spending changed?
In 2016, health was the smallest of the nine tracked categories at $62.7 billion, sitting below food ($92.6B), transport ($101.9B) and recreation ($100.5B). By 2025, it had grown to $108.7 billion, overtaking clothing, furnishings and miscellaneous goods combined. The increase reflects broader cost pressures in health care. Over the same period, the ABS Wage Price Index for health care and social assistance rose by around 24%, while private health insurance premiums increased by more than 30% across the decade. Hospitality followed a different pattern. Spending fell sharply in April 2020, then recovered faster than any other category. By 2022, it had already passed its 2019 nominal value and continued rising through 2025.
Section 03 · State by state
Household spending by state: where costs are rising fastest
New South Wales accounts for the largest share of national tracked expenditure at $292.1 billion in 2025, representing 31.6% of the national total.
Victoria follows at $224.9 billion and Queensland at $190.7 billion. These figures largely reflect population size, with NSW and Victoria home to the largest shares of Australia's population.
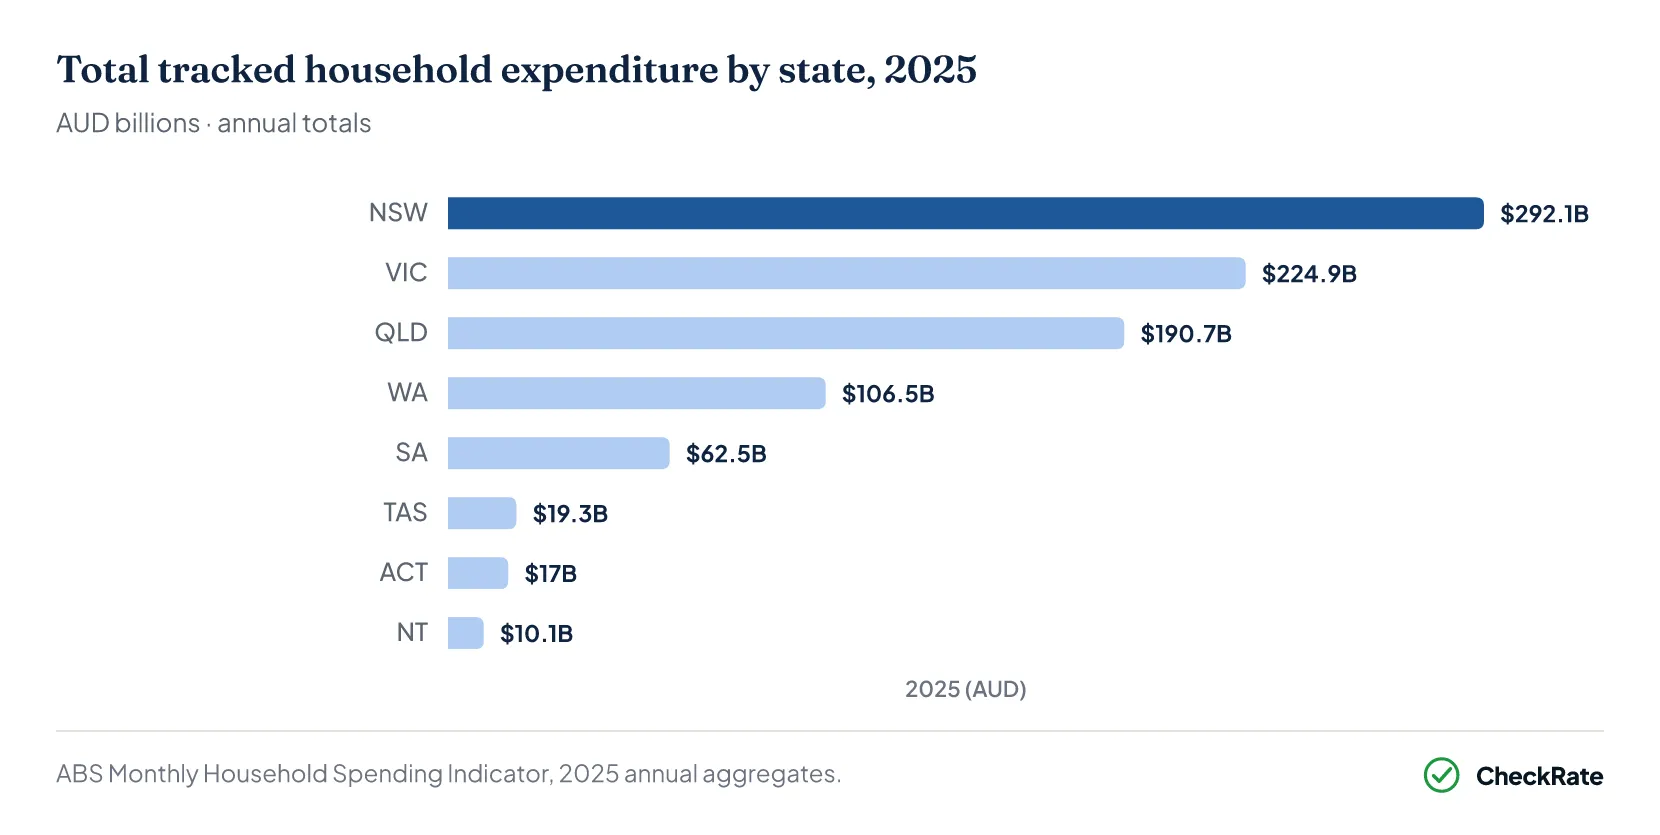
Growth rates since 2016 show a different pattern. Western Australia (+65.1%) and Queensland (+63.0%) both grew well above the national average of 52.2%. NSW (+43.9%) and Victoria (+47.7%) recorded slower growth despite their larger spending bases.
Queensland's faster growth closely tracks strong interstate migration, which has tightened housing availability and increased service costs across south-east Queensland.
State and territory data: 2016 vs 2025
Green rows indicate states with above-average growth since 2016.
| Tracked spending by state and territory · AUD billions | ||||
|---|---|---|---|---|
| State / Territory | 2016 ($B) | 2025 ($B) | Growth | National share (2025) |
| NSW | 203.1 | 292.1 | +43.9% | 31.6% |
| VIC | 152.3 | 224.9 | +47.7% | 24.4% |
| QLD | 117 | 190.7 | +63.0% | 20.7% |
| WA | 64.5 | 106.5 | +65.1% | 11.5% |
| SA | 39.3 | 62.5 | +59.0% | 6.8% |
| TAS | 12.3 | 19.3 | +57.3% | 2.1% |
| ACT | 11.2 | 17 | +51.6% | 1.8% |
| NT | 6.7 | 10.1 | +51.1% | 1.1% |
| Australia total | 606.3 | 923 | +52.2% | 100% |
How does Queensland's spending growth compare to NSW and Victoria since 2016?
Queensland's tracked household expenditure grew by 63.0% between 2016 and 2025, compared to 47.7% for Victoria and 43.9% in NSW. That puts Queensland more than 19 percentage points ahead of the two larger states. In dollar terms, Queensland added $73.7 billion in annual spending over the period, slightly more than Victoria's $72.6 billion, even though Victoria's population is around 20% larger. One major driver is migration. ABS data show that Queensland recorded a net interstate inflow of more than 100,000 people between 2020 and 2024, the highest among states. Brisbane's median house price also rose by around 75% over the same period, compared with about 45% for Melbourne.
Section 04 · Per household spending
How much does one household actually spend?
Behind the national total of $923 billion is a more personal figure: the amount flowing out of a single Australian household each week.
In 2025, that is estimated at $2,856 per week, or $12,376 per month. This includes housing, utilities and other living expenses.
A decade ago, the equivalent figure was $1,956 per week. That is a 46% rise in nominal terms over nine years.
Of the $2,856 weekly total, housing alone accounts for $634, making it the largest household expense and more than twice the discretionary spend on recreation and culture ($292).
Household spending broadly falls into three groups. Essential non-discretionary costs, including housing, food, health, utilities, insurance and education, account for around $1,509 per week, or 52.8% of total spending. Transport makes up $298 per week (10.4%), while discretionary spending accounts for $1,049 per week (36.8%).
Full weekly cost breakdown per household
| Estimated household spending by category, weekly · AUD · 2025 national averages | |||||
|---|---|---|---|---|---|
| Category | Type | Weekly | Monthly | Annual | Share of total |
| Rent and dwelling services | Essential | $634 | $2,747 | $32,968 | 22.2% |
| Recreation and culture | Discretionary | $292 | $1,265 | $15,184 | 10.2% |
| Food | Essential | $272 | $1,178 | $14,144 | 9.5% |
| Hotels, cafes and restaurants | Discretionary | $244 | $1,057 | $12,688 | 8.5% |
| Insurance and financial services | Essential | $227 | $983 | $11,804 | 7.9% |
| Health | Essential | $210 | $909 | $10,920 | 7.4% |
| Other goods and services | Discretionary | $162 | $702 | $8,424 | 5.7% |
| Operation of vehicles | Transport | $127 | $550 | $6,604 | 4.4% |
| Furnishings and equipment | Discretionary | $120 | $520 | $6,240 | 4.2% |
| Clothing and footwear | Discretionary | $102 | $442 | $5,304 | 3.6% |
| Education services | Essential | $101 | $437 | $5,252 | 3.5% |
| Transport services | Transport | $98 | $424 | $5,096 | 3.4% |
| Purchase of vehicles | Transport | $73 | $316 | $3,796 | 2.6% |
| Electricity, gas and fuel | Essential | $65 | $282 | $3,380 | 2.3% |
| Alcoholic beverages | Discretionary | $52 | $225 | $2,704 | 1.8% |
| Communications | Discretionary | $52 | $225 | $2,704 | 1.8% |
| Cigarettes and tobacco | Discretionary | $25 | $108 | $1,300 | 0.9% |
| Total | — | $2,856 | $12,376 | $148,493 | 100% |
Source · ABS National Accounts; 2025 cost-of-living research.
Per-household weekly spend by state
Weekly household costs vary widely across Australia. The Northern Territory is the most expensive, partly because geographic isolation pushes up freight and living costs. Western Australia also sits above the national average, supported by higher wages in the resources sector. Tasmania is the lowest, reflecting lower median wages, an older population and lower property values.
NT and WA figures from 2025 cost-of-living research. TAS and national are ABS estimates.
How much of the average household budget goes to essential costs?
Based on 2025 ABS National Accounts data, 52.8% of average household spending goes to essential costs, including housing, food, health, utilities, insurance and education. Transport accounts for another 10.4%, leaving 36.8% as discretionary spending. Housing alone accounts for 22.2% of the total weekly budget, or $634 out of $2,856. That makes it larger than food and health combined, which total $482 per week. In the 2016 ABS Household Expenditure Survey, housing represented about 19% of total spending. This suggests housing's share of the weekly budget has grown by roughly 3 percentage points over the decade.
Section 05 · By household type
Cost of living by household type
The national average of $2,856 per week masks very different financial realities depending on household size, income and life stage. A single student in inner-city Sydney will face very different costs from a couple nearing retirement in regional Tasmania, even within the same national economy.
Singles
For a single person, monthly living costs are estimated between $2,500 and $3,500 nationally, though that range is heavily skewed by location. In inner-city Sydney, total monthly expenses, including rent, can exceed $6,000, driven by an average one-bedroom rental of around $3,771 per month. Excluding rent, a single Sydneysider's everyday costs average approximately $1,984 per month.
Couples without children
Sharing income and expenses changes the cost calculation. For a working-age couple without children, monthly living costs typically fall between $3,500 and $5,500. Splitting housing costs provides a buffer that single-person households do not have. A couple sharing a $2,500 monthly rental effectively halves that cost per person.
Families with children
A family of four typically requires between $5,000 and $7,000 per month nationally, rising to $7,500 to $8,000 in major metropolitan areas. The marginal cost of children is substantial and largely unavoidable.
Even within nominally free public schooling, families face unavoidable annual costs of between $500 and $1,200 per child. These essential costs leave families with less room for discretionary spending. Families may cut back on domestic travel, dining and entertainment to manage fixed child-rearing costs.
Retirement
The Association of Superannuation Funds of Australia (ASFA) publishes quarterly benchmarks for retirement living standards. In the December 2025 quarter, a comfortable retirement required near-ideal conditions: good health, an owned home, and a substantial superannuation balance at drawdown.
| Weekly cost of modest and comfortable retirement living standards | ||||
|---|---|---|---|---|
| Category | Couple comfortable | Couple modest | Single comfortable | Single modest |
| Housing (rates, insurance, repairs) | $161.25 | $148.45 | $154.42 | $131.38 |
| Electricity and gas | $62.88 | $53.75 | $50.70 | $40.02 |
| Food and groceries | $263.41 | $217.31 | $151.55 | $117.22 |
| Household goods and services | $101.64 | $48.11 | $80.19 | $40.76 |
| Clothing and footwear | $53.59 | $40.94 | $28.78 | $21.54 |
| Transport (car and public) | $189.88 | $117.30 | — | $110.28 |
| Health (insurance, chemist, co-payments) | $225.46 | $114.86 | $120.29 | $59.28 |
| Leisure (dining, holidays, media) | $360.21 | $196.49 | $238.79 | $126.78 |
| Total weekly | $1,482 | $983 | $1,051 | $680 |
| Annual equivalent | $77,375 | $51,299 | $54,792 | $35,360 |
Source · ASFA Retirement Standard, December Quarter 2025.
References
- ABS Monthly Household Spending Indicator — household spending, Australia · Australian Bureau of Statistics
- ABS: Australian National Accounts: National Income, Expenditure and Product, March quarter 2026 · Australian Bureau of Statistics
- Lending Indicators, June Quarter 2026, Table 24, cat. 5601.0 · Australian Bureau of Statistics
- ASFA Retirement Standard, December quarter 2025 · superannuation.asn.au
- ABS, Household Income and Wealth, Australia 2024 · Australian Bureau of Statistics
- ABS, National, state and territory population (latest release) · Australian Bureau of Statistics
- AMP Financial Services, cost of raising children estimates · amp.com.au
- RBA, Lenders' Interest Rates (Statistical Table F6) — housing rates, February 2026 · Reserve Bank of Australia