

Updated
- Annual cost, child aged 0–12
- $14,9021
- 2026 Costs of the Children Table, combined child support income of $93,137
- Annual cost, child aged 13+
- $20,9561
- 2026 Costs of the Children Table, combined child support income of $93,137
- Average share of income spent on non-discretionary items
- 54.3%2
- Couples with dependent children, 2024 (single parents: 62.6%), HILDA Statistical Report 2026
- Added annual cost, second child aged 0–12
- $6,986
- 2026 Costs of the Children Table, combined child support income of $93,137
 Childcare costs in AustraliaThe average daily fee for centre-based day care in Australia was $146.00 for a 10-hour session in the June quarter 2026, before the Child Care Subsidy.
 Family finances in AustraliaCouple families with dependent children had a median disposable household income of $2,285 a week in 2019-20.
 How much does school cost in Australia?Independent schools in Australia received $13,341 per student from fees, charges and parent contributions in 2024.
Section 01 · 2026 costs
What is the estimated annual cost of a child in Australia in 2026?
The estimated cost of one child aged 0 to 12 is $14,902 a year for parents with a combined child support income of $93,137, according to 2026 child support cost estimates from the Department of Social Services (DSS)1. For one child aged 13 and over at the same income, the estimated cost is $20,956 a year.
The Department of Social Services updates the estimates annually. The 2026 figures use annualised male total average weekly earnings (MTAWE) of $93,137 to set the income levels used in the calculations14.
Combined child support income is what remains of both parents’ adjusted taxable income after each parent’s self-support amount is deducted, along with any relevant dependent child amount or multi-case allowance5. The self-support amount is $31,046 for each parent in 20266. For parents who both earn more than that amount and have no other children to support, a combined child support income of $93,137 equals a combined adjusted taxable income of $155,229: $93,137 plus two self-support amounts.
When parents live apart, Services Australia uses these estimates to calculate child support5. The estimated costs are shared between the parents according to each parent’s income percentage and percentage of care.
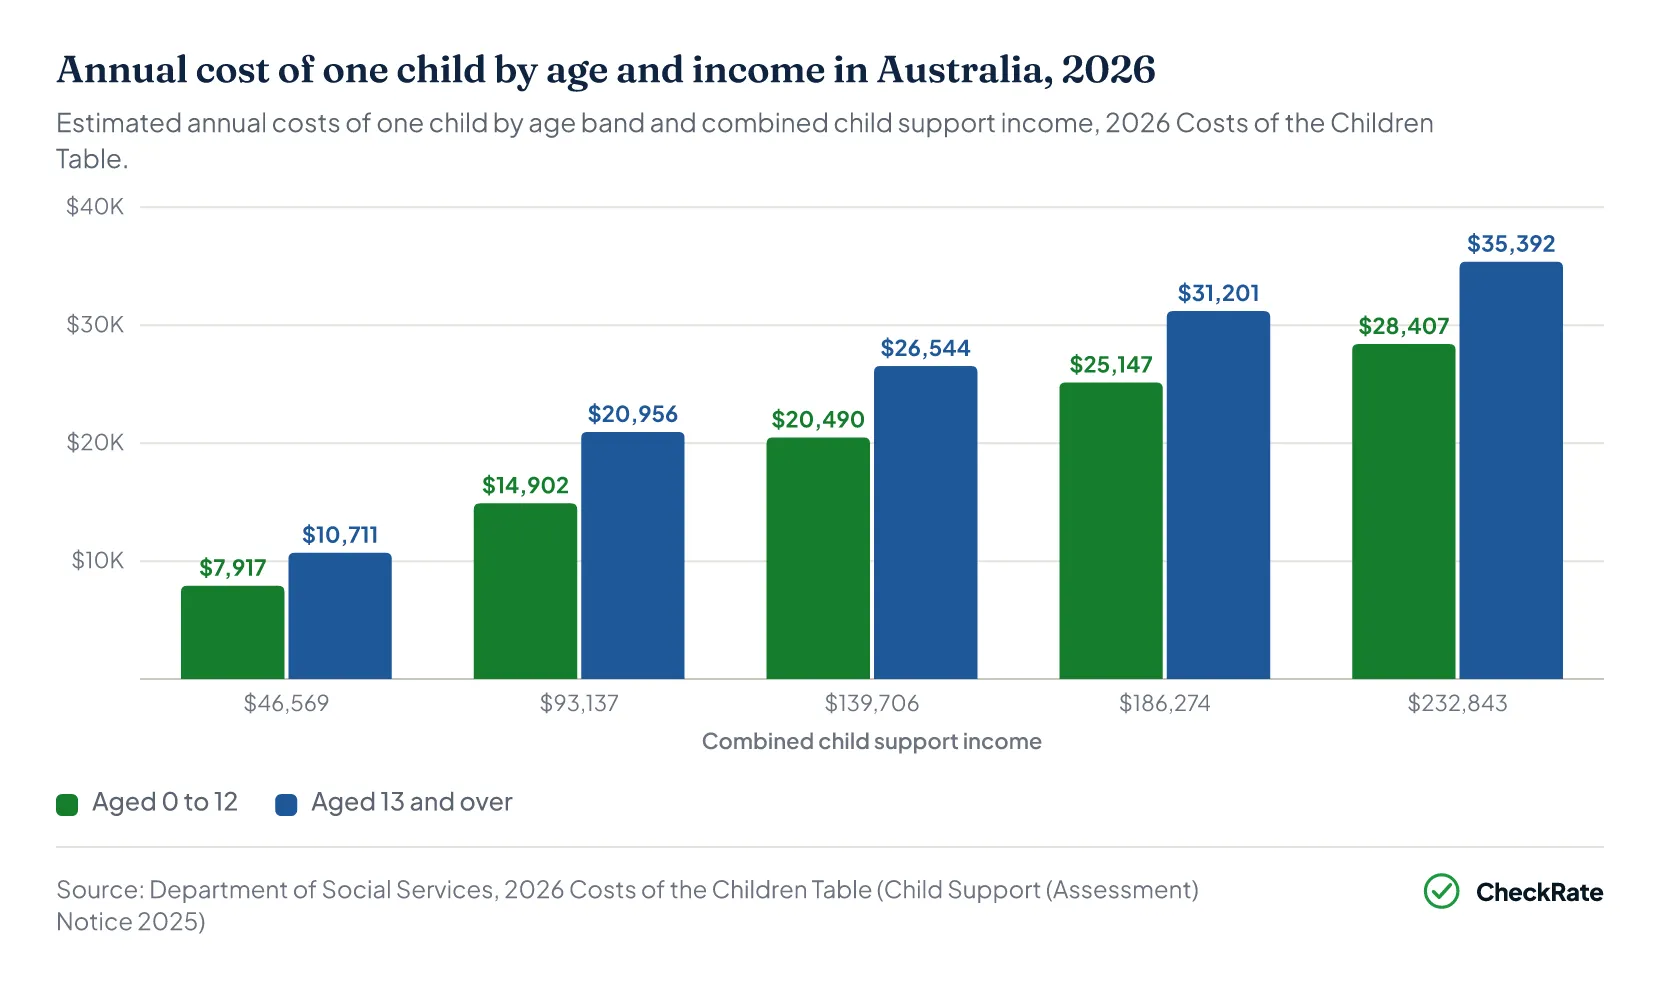
The estimated cost does not increase above a combined child support income of $232,843, which is 2.5 times MTAWE1. Above that income, the estimated cost is $28,407 a year for one child aged 0 to 12 and $35,392 for one child aged 13 and over.
Research published by the DSS on 18 June 2026 estimates a different kind of cost. Its Budget Standards for Child Support Research, by researchers at UNSW Sydney's Social Policy Research Centre7, prices minimum budgets for a healthy life and social participation for low-paid and unemployed families, at June quarter 2024 prices, with rents for working families at the 40th percentile for Sydney. A low-paid couple with one partner working full-time and the other part-time needs $224 a week more with one child than with no children, and $456 a week more with two. The children are assumed to be a girl aged 8 and a boy aged 11.
These are minimum budgets for low-paid families, not policy estimates at a set income, so they are not comparable with the Costs of the Children Table.
How much does it cost to raise a child to 18 in Australia?
If combined child support income stays at $93,137 every year, the 2026 estimates add up to $298,506 for one child from birth to 18: 13 years at $14,902 and five years at $20,956. This calculation holds the 2026 amounts constant and does not account for future changes in costs1.
| Estimated annual costs of children by age, number and combined child support income, Australia, 2026 | |||||
|---|---|---|---|---|---|
| Children | $46,569 | $93,137 | $139,706 | $186,274 | $232,843 or more |
| 1 child aged 0 to 12 | $7,9179 | $14,9029 | $20,4909 | $25,1479 | $28,4079 |
| 2 children aged 0 to 12 | $11,1779 | $21,8889 | $31,2029 | $39,5849 | $44,2419 |
| 3 or more children aged 0 to 12 | $12,5749 | $24,6829 | $36,3249 | $47,5009 | $55,8829 |
| 1 child aged 13 and over | $10,7119 | $20,9569 | $26,5449 | $31,2019 | $35,3929 |
| 2 children aged 13 and over | $13,5059 | $26,5449 | $38,1869 | $47,5009 | $53,5549 |
| 3 or more children aged 13 and over | $14,9029 | $29,3389 | $43,3099 | $56,8149 | $66,1289 |
| 2 children of mixed ages | $12,3419 | $24,2169 | $34,6949 | $43,5429 | $48,8979 |
| 3 or more children of mixed ages | $13,7389 | $27,0109 | $39,8169 | $52,1579 | $61,0059 |
Source · Department of Social Services, 2026 Costs of the Children Table.
Section 02 · By age
How does the cost of raising a child change with the child’s age?
One child aged 13 and over has an estimated cost of $20,956 a year at a combined child support income of $93,137, compared with $14,902 for one child aged 0 to 121. That is $6,054 a year more, or 40.6% higher than the estimate for a child aged 0 to 12.
At the income cap of $232,843, the estimated cost of one child aged 13 and over is $6,985 a year higher than for one child aged 0 to 12, or 24.6% higher1.
The estimates use two age groups: children aged 0 to 12 and those aged 13 and over. Costs are calculated daily based on the child's age, so the estimate changes on their 13th birthday4.
The Ministerial Taskforce on Child Support based the 0 to 12 age band on its estimates for children aged 5 to 12, which were higher than its estimates for children aged 0 to 48. This allowed for child care costs or income lost while caring for younger children.
In 2015-16, couple families whose youngest dependent child was under 5 spent an average of $114.33 a week per household on child care services, compared with $20.63 for couple families whose youngest child was aged 5 to 14, according to the Australian Bureau of Statistics (ABS) Household Expenditure Survey10.
The HILDA survey gives a newer figure on a different basis. Among families paying for child care for children not yet at school, including informal paid care such as nannies, the median cost was $190 a week after subsidies in 2024, in December 2024 prices, according to the Melbourne Institute's HILDA Statistical Report 20262. This is a median among families that paid for care, not an average across all couple families, so it is not comparable with the 2015-16 figures.
Education spending in 2015-16 was $25.91 a week in couple families whose youngest child was under 5, $172.41 when the youngest was aged 5 to 14 and $131.00 when the youngest was 15 or over10. These are household averages, not spending on each child.
| Average weekly household spending by age of the youngest child, couple families with dependent children only, Australia, 2015-16 | |||
|---|---|---|---|
| Spending | Youngest under 5 | Youngest 5 to 14 | Youngest 15 and over |
| Child care services | $114.3310 | $20.6310 | nil10 |
| Education | $25.9110 | $172.4110 | $131.0010 |
| Primary and secondary school fees | $17.4410 | $156.4510 | $106.3810 |
| Food and non-alcoholic beverages | $282.2710 | $336.3710 | $331.7310 |
| Total goods and services | $1,833.4610 | $2,084.6410 | $1,990.2910 |
Source · ABS, Household Expenditure Survey, Australia: Summary of Results, 2015-16, Tables 9.1 and 9.3A.
Child care fees and subsidies are covered in childcare costs in Australia.
Section 03 · By category
What do families with children spend the most on?
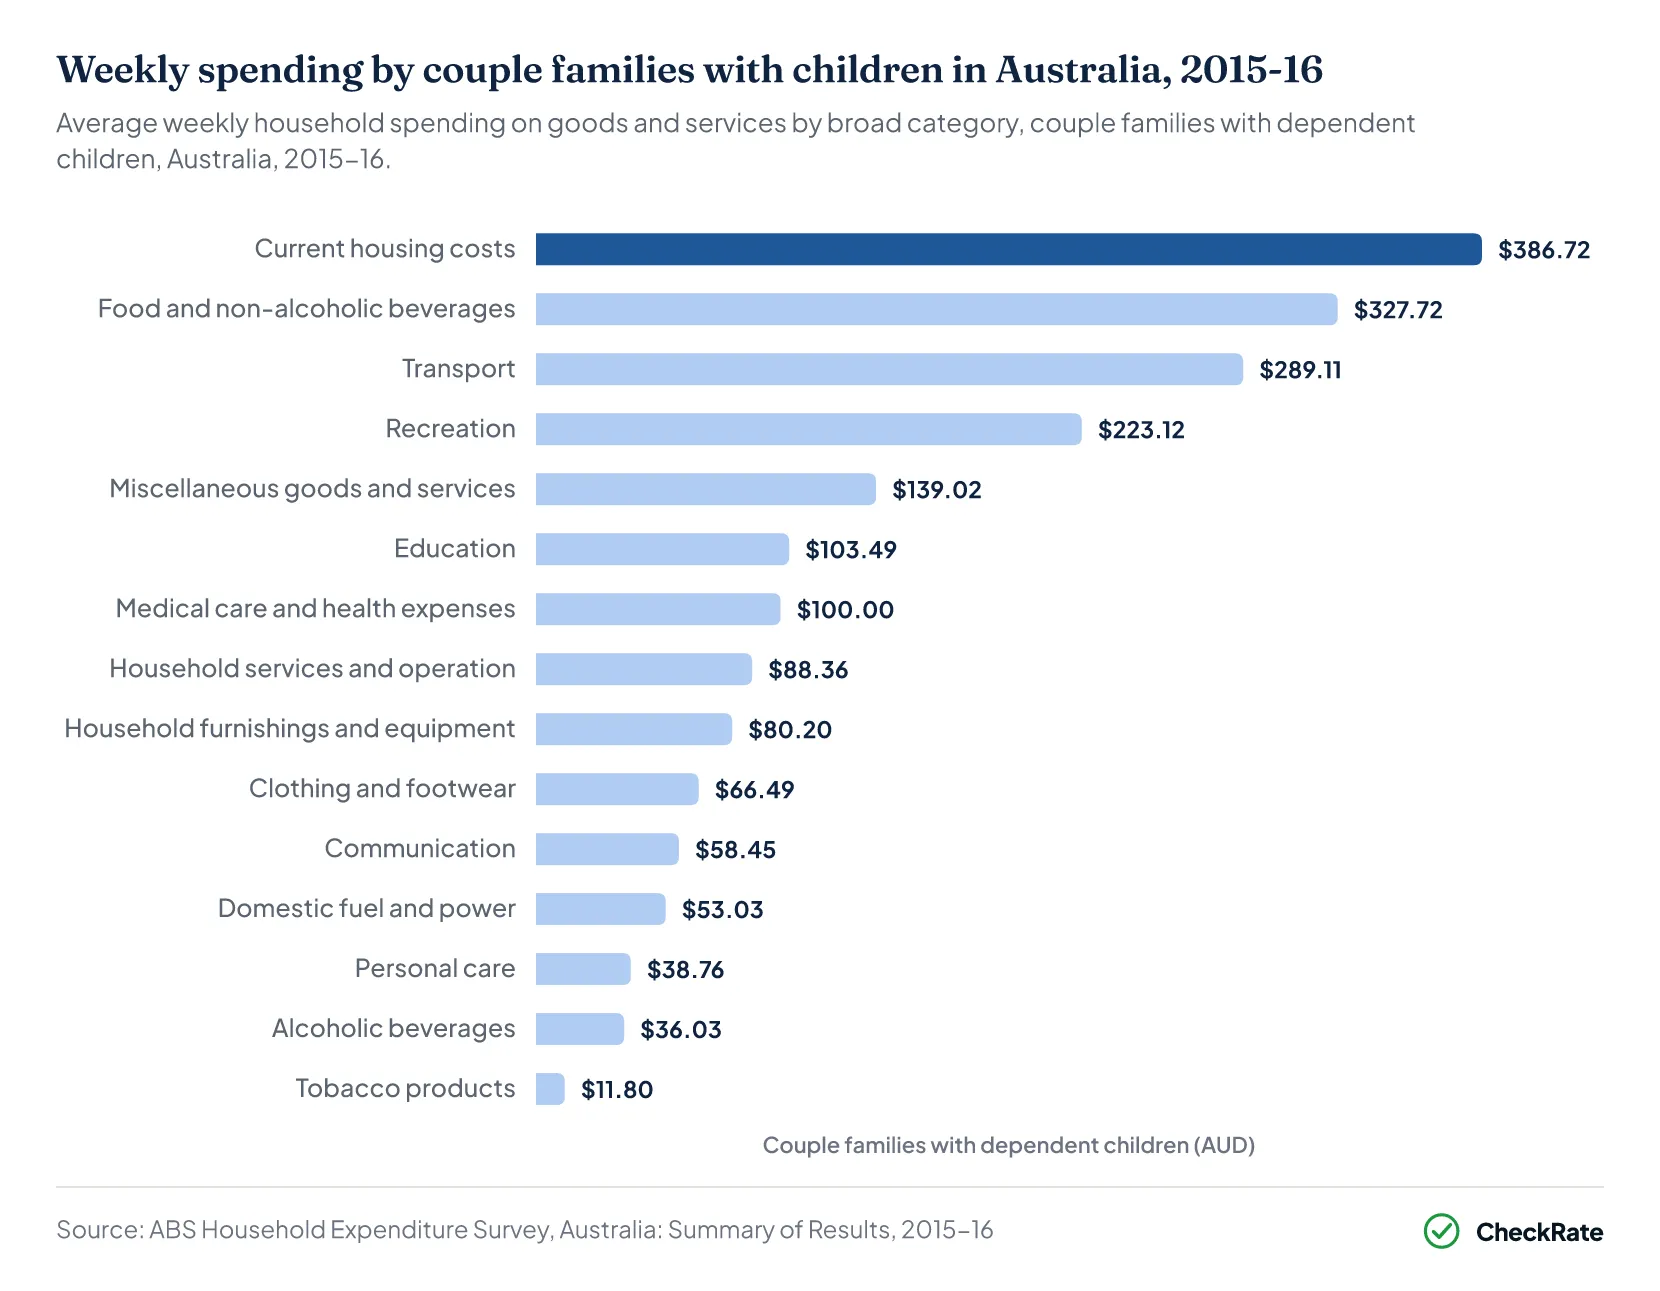
Current housing costs accounted for the largest share of household spending across 15 broad categories for couple families with dependent children in 2015-16. According to the ABS Household Expenditure Survey, housing costs averaged $386.72 a week, representing 19.4% of total average weekly household spending of $1,991.85 on goods and services10.
In 2015-16, food and non-alcoholic beverages accounted for $327.72 a week, or 16.4%10. Transport accounted for $289.11 a week, or 14.5%, and recreation accounted for $223.12 a week, or 11.2%.
Couple families with dependent children spent $103.49 a week on education in 2015-16, compared with $16.14 for couple-only households10. Their spending on household services and operation, which includes child care, was $88.36 a week in 2015-16, compared with $30.76 for couple-only households.
Couple-only households also differ from families with children in age and size, so the differences in household spending between them are not estimates of what children cost3.
| Average weekly household spending by category and household type, Australia, 2015-16 | ||||
|---|---|---|---|---|
| Expenditure category | Couple, dependent children | One parent, dependent children | Couple only | All households |
| Current housing costs | $386.7210 | $291.7110 | $247.3210 | $279.1210 |
| Food and non-alcoholic beverages | $327.7210 | $200.8910 | $226.5410 | $236.9710 |
| Transport | $289.1110 | $134.9710 | $203.7110 | $206.6910 |
| Recreation | $223.1210 | $109.1910 | $188.7310 | $171.8510 |
| Miscellaneous goods and services | $139.0210 | $63.8510 | $98.8910 | $97.0810 |
| Education | $103.4910 | $42.6710 | $16.1410 | $43.8610 |
| Medical care and health expenses | $100.0010 | $55.6210 | $98.9310 | $82.3810 |
| Household services and operation | $88.3610 | $44.11*10 | $30.7610 | $44.9010 |
| Household furnishings and equipment | $80.2010 | $49.2810 | $63.6010 | $57.8710 |
| Clothing and footwear | $66.4910 | $41.0210 | $40.5210 | $43.7510 |
| Communication | $58.4510 | $45.7810 | $43.5110 | $46.6210 |
| Domestic fuel and power | $53.0310 | $42.5210 | $38.1710 | $40.9210 |
| Personal care | $38.7610 | $26.3310 | $29.4210 | $28.6410 |
| Alcoholic beverages | $36.0310 | $15.7910 | $36.4410 | $31.9510 |
| Tobacco products | $11.8010 | $13.4010 | $9.6710 | $12.8410 |
| Total goods and services | $1,991.8510 | $1,187.4710 | $1,376.7910 | $1,425.0310 |
Source · ABS, Household Expenditure Survey, Australia: Summary of Results, 2015-16, Table 9.1.
Spending across all household types is covered in the cost of living in Australia.
Section 04 · Number of children
How much does a second or third child add to child-raising costs?
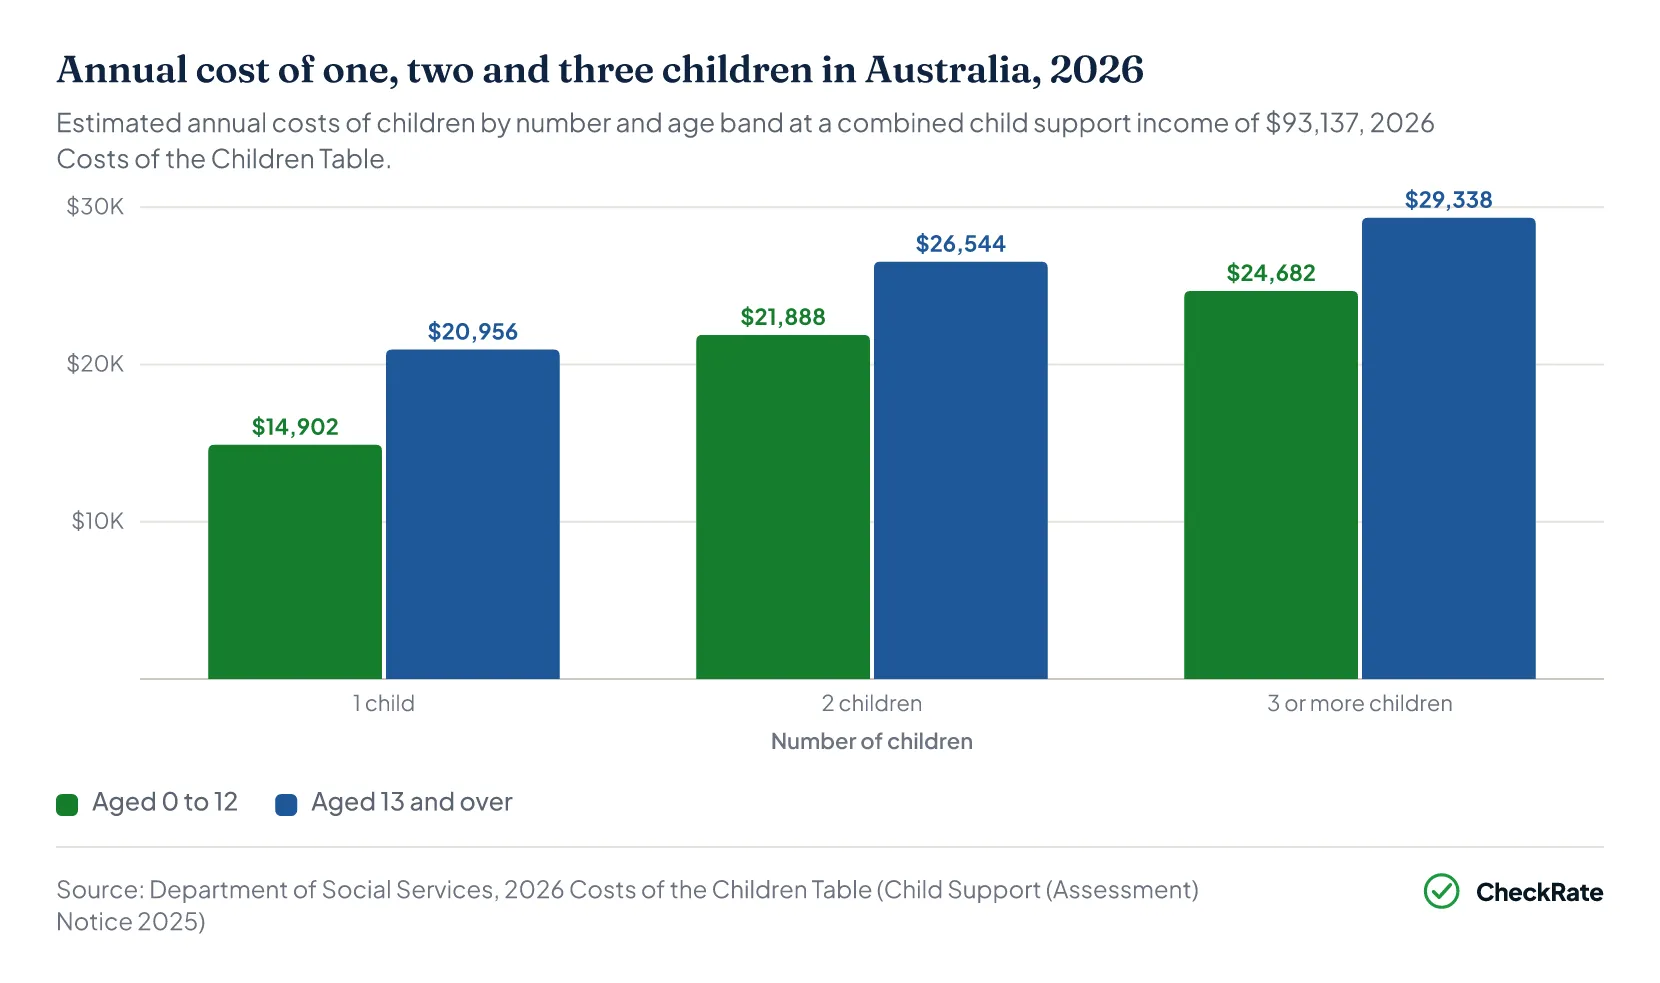
A second child aged 0 to 12 adds an estimated $6,986 a year at a combined child support income of $93,1371. According to the DSS, the estimate is $14,902 for one child, $21,888 for two children and $24,682 for three or more children.
A third child aged 0 to 12 adds an estimated $2,794 a year at the same income1. For two children, the average estimated cost is $10,944 per child, compared with about $8,227 per child for three children4.
For children aged 13 and over, a second child adds an estimated $5,588 and a third adds $2,794 at the same income, taking the estimate from $20,956 for one child to $26,544 for two and $29,338 for three or more1.
Families with four or more children are assessed using the cost of three children, based on the ages of the three oldest4. The Ministerial Taskforce on Child Support found that the net costs of four or more children were little different from the costs of three, partly because Family Tax Benefit is paid for each child8.
Section 05 · Single parents
How does one-parent family spending compare with couple families?
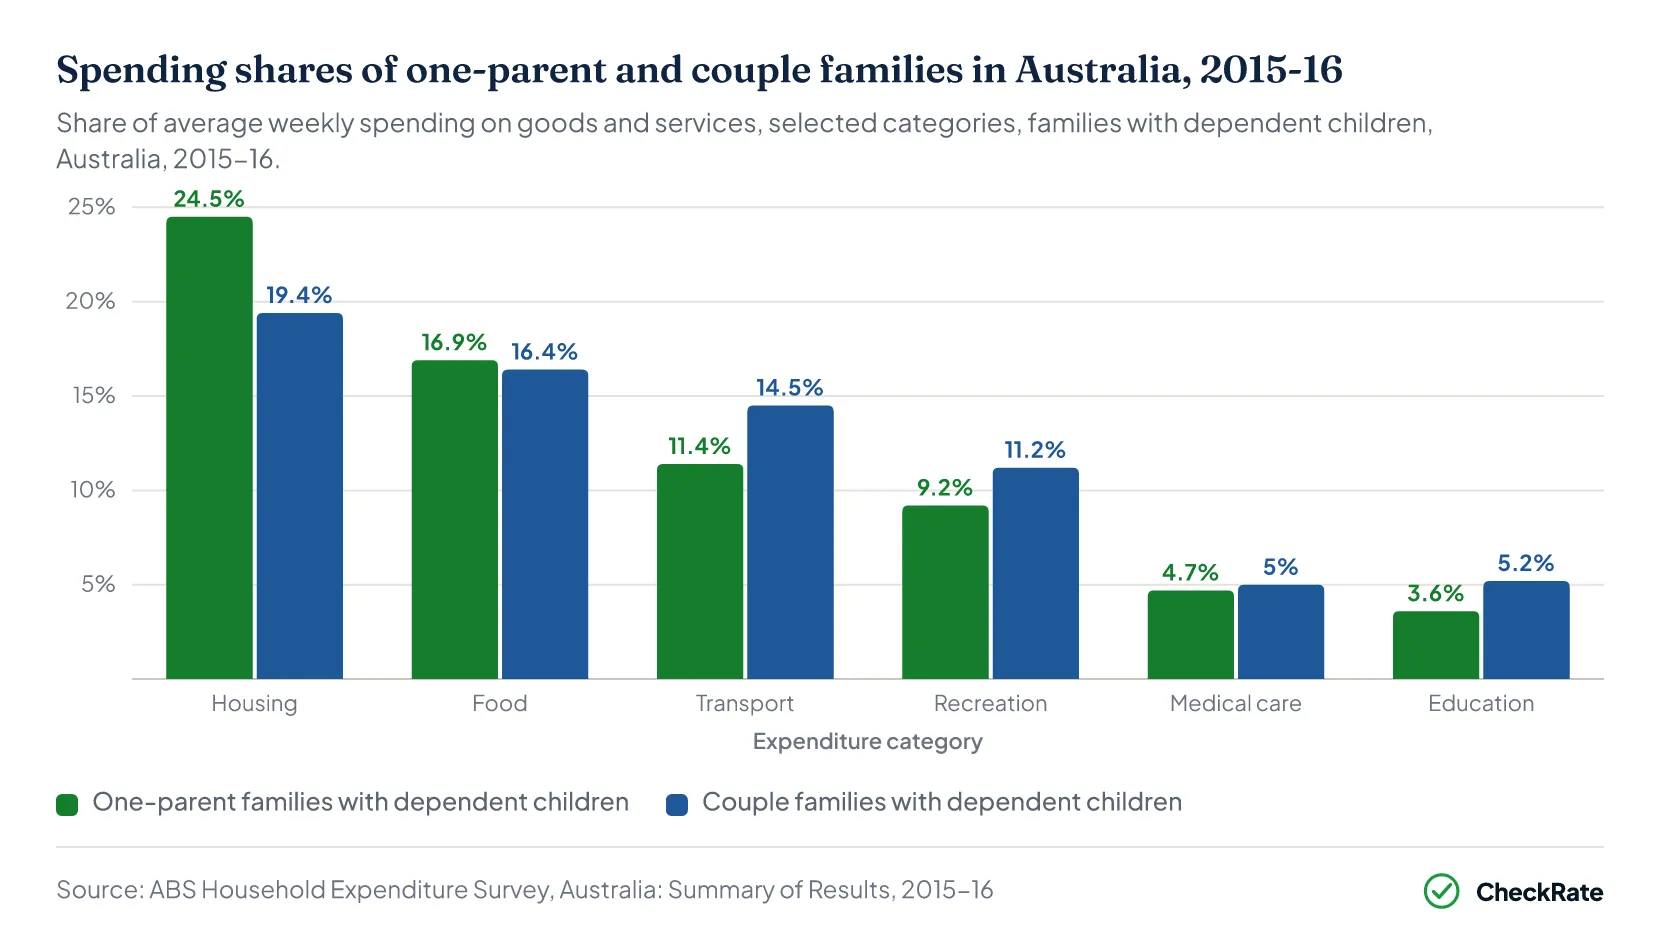
One-parent families with dependent children spent an average of $1,187.47 a week per household on goods and services in 2015-16, or 59.6% of the $1,991.85 spent by couple families with dependent children, according to the ABS Household Expenditure Survey10. One-parent families had an average of 3.0 people and 1.7 dependent children per household, compared with 4.1 people and 1.9 dependent children in couple families.
Median gross household income was $1,106 a week for one-parent families with dependent children in 2015-16, compared with $2,475 for couple families with dependent children10. Government pensions and allowances were the main source of income for 42.4% of one-parent families, compared with 6.5% of couple families.
Current housing costs accounted for 24.5% of weekly spending by one-parent families in 2015-16, compared with 19.4% for couple families with dependent children10.
Renters made up 58.6% of one-parent families with dependent children in 2015-16, compared with 25.4% of couple families with dependent children10.
The HILDA survey gives newer figures on a different measure. In its HILDA Statistical Report 2026, the Melbourne Institute at the University of Melbourne reports that in 2024 single parents with dependent children spent an average of 62.6% of their household income on non-discretionary items, compared with 54.3% for couples with dependent children2. These are shares of income, not of total spending, and cover a different list of items, including mortgage repayments, so they are not comparable with the 2015-16 figures.
Section 06 · By income
How does the estimated cost of a child change with parents’ combined income?
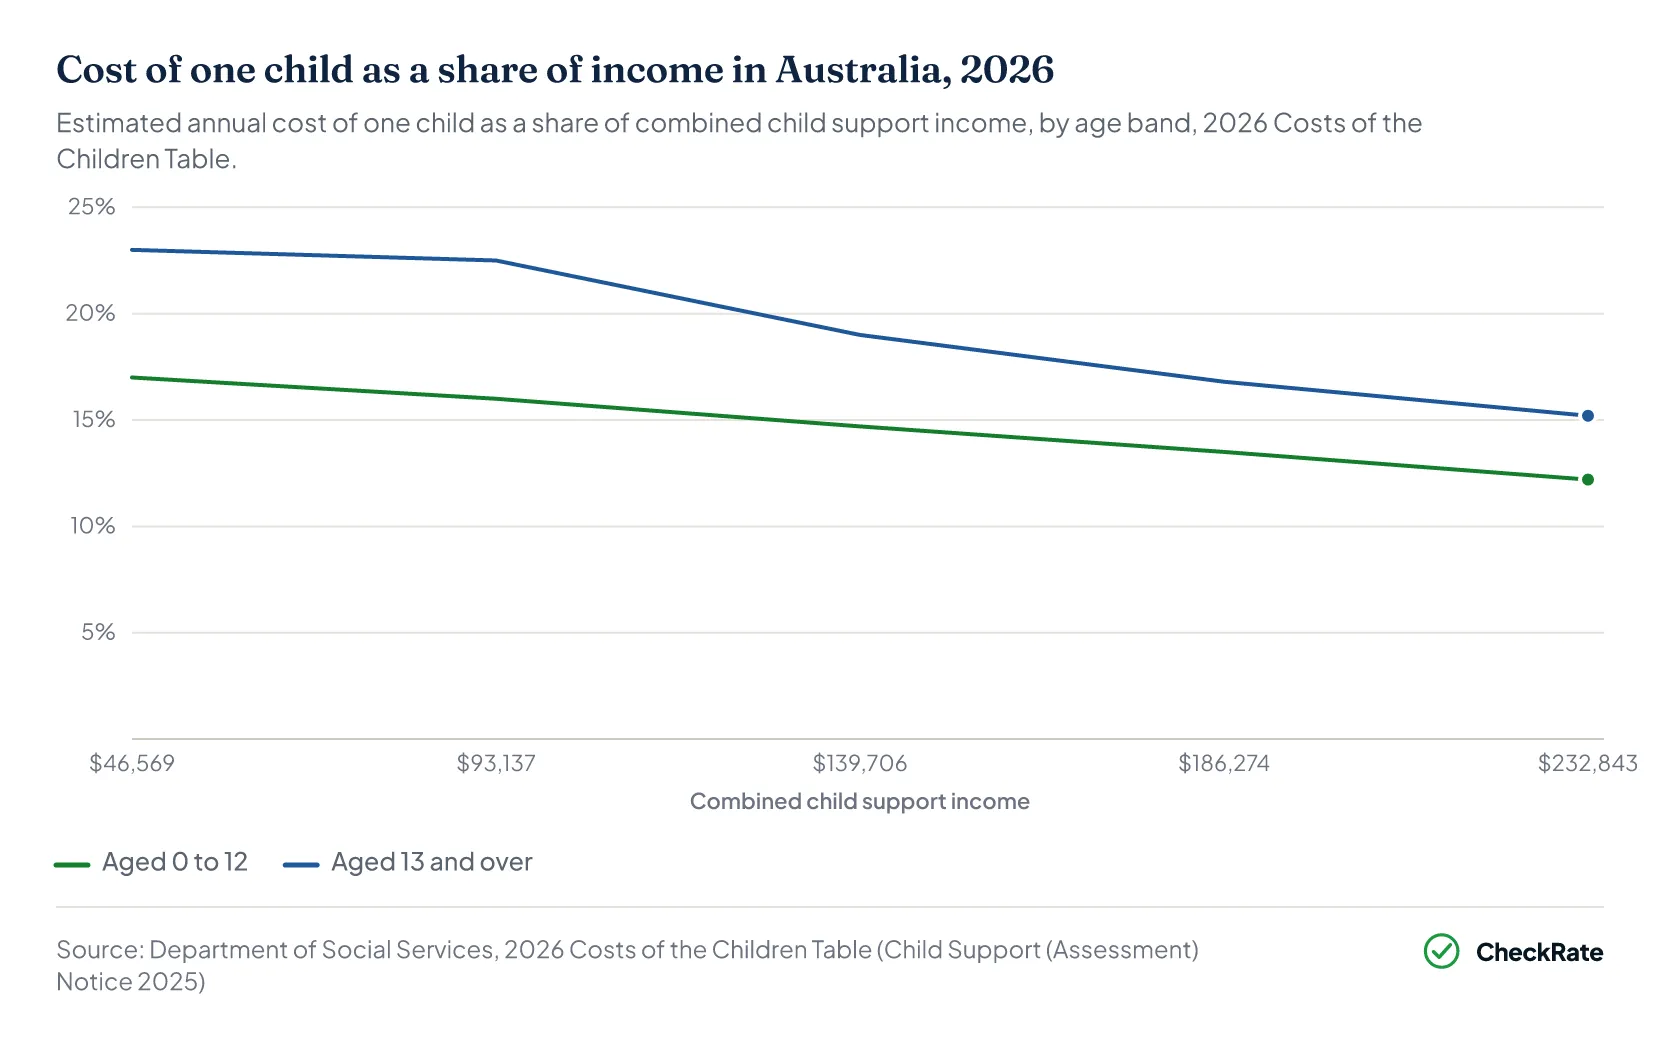
The estimated cost of one child aged 0 to 12 rises from $7,917 a year at a combined child support income of $46,569 to $28,407 at $232,8431. As a share of combined child support income, the estimate falls from 17.0% to 12.2% over the same range.
For one child aged 13 and over, the estimate rises from $10,711 to $35,392 over the same income range1. Its share of combined child support income falls from 23.0% to 15.2%.
The estimated cost increases at a lower rate as income rises. For one child aged 0 to 12, the rate is 17 cents for each dollar up to $46,569 and 7 cents for each dollar from $186,275 to $232,8431. No further cost is added above $232,843.9
The Ministerial Taskforce on Child Support recommended that the estimates reflect research showing that spending on children increases as income rises, but decreases as a percentage of income8.
Family Tax Benefit and other payments for families are covered in government support for families in Australia.
Section 07 · Since 2008
How has the cost of raising a child changed since 2008?
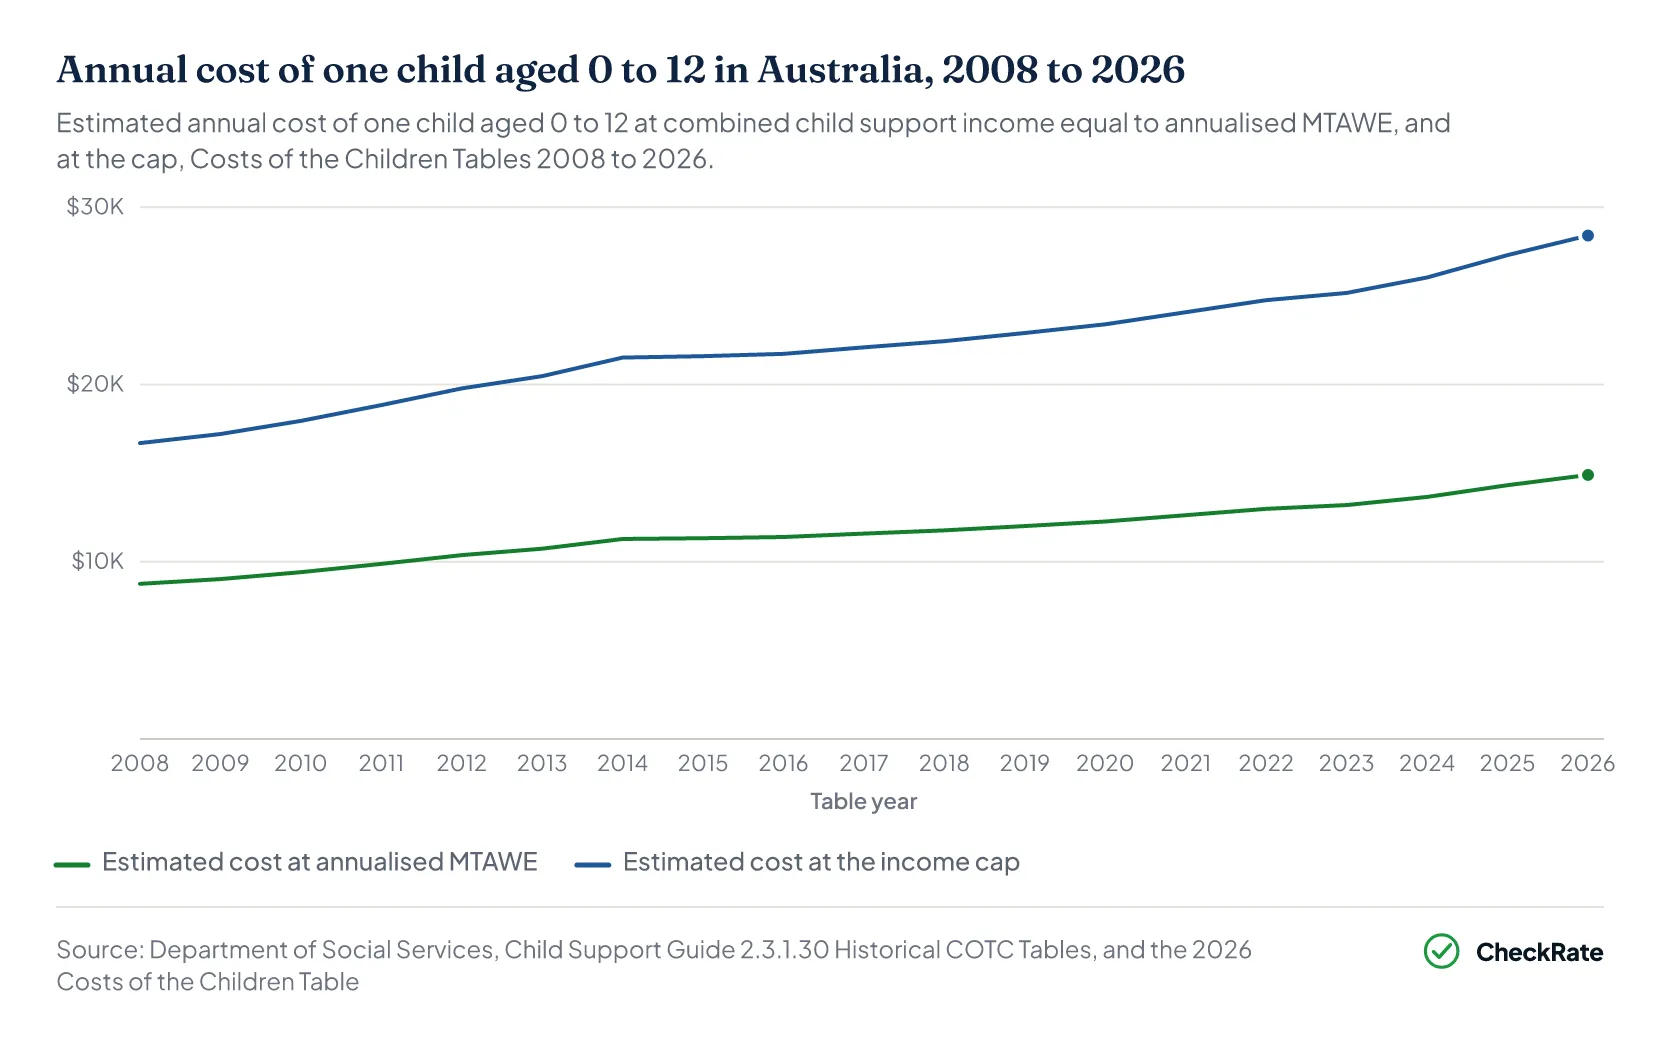
The estimated cost of one child aged 0 to 12 increased 70.1% between 2008 and 2026, from $8,76112 to $14,9029, according to the Department of Social Services' historical child support cost estimates. This comparison uses an income benchmark based on male average weekly earnings converted to a yearly amount11.
The increase reflects the rise in this earnings benchmark from $54,75612 to $93,1379, as the rates used to calculate estimated child costs have not changed since 2008.
Each year's estimates use average earnings from the June quarter of the previous year. The 2008 figures therefore use earnings from June 2007, while the 2026 figures use earnings from June 202511.
Consumer prices increased 61.6% between June 2007 and June 2025, according to the ABS Consumer Price Index13.
The annual cost estimate increased 4.0% from 2025 to 2026, from $14,32414 to $14,9029.
The estimated cost at the maximum income level used in the calculations for one child aged 0 to 12 increased from $16,700 in 200812 to $28,407 in 20269.
| Annualised MTAWE and estimated annual cost of one child aged 0 to 12, Australia, 2008 to 2026 tables | |||
|---|---|---|---|
| Table year | Annualised MTAWE | Estimated cost at annualised MTAWE | Estimated cost at the income cap |
| 2008 | $54,75612 | $8,76112 | $16,70012 |
| 2009 | $56,42515 | $9,02815 | $17,21015 |
| 2010 | $58,85416 | $9,41716 | $17,95116 |
| 2011 | $61,78117 | $9,88517 | $18,84317 |
| 2012 | $64,86518 | $10,37918 | $19,78418 |
| 2013 | $67,13719 | $10,74219 | $20,47719 |
| 2014 | $70,56920 | $11,29120 | $21,52320 |
| 2015 | $70,82921 | $11,33321 | $21,60321 |
| 2016 | $71,25622 | $11,40122 | $21,73322 |
| 2017 | $72,46223 | $11,59423 | $22,10123 |
| 2018 | $73,60624 | $11,77724 | $22,44924 |
| 2019 | $75,11425 | $12,01925 | $22,91125 |
| 2020 | $76,72626 | $12,27626 | $23,40126 |
| 2021 | $78,95727 | $12,63327 | $24,08227 |
| 2022 | $81,18828 | $12,99028 | $24,76228 |
| 2023 | $82,52429 | $13,20429 | $25,16929 |
| 2024 | $85,38930 | $13,66230 | $26,04330 |
| 2025 | $89,52314 | $14,32414 | $27,30414 |
| 2026 | $93,1379 | $14,9029 | $28,4079 |
Source · Department of Social Services, Costs of the Children Tables 2008 to 2026.
Section 08 · Common questions
Cost of raising a child: quick answers
How much does it cost to raise a child to 18 in Australia?
Raising one child from birth to 18 costs an estimated $298,506 at a constant combined child support income of $93,137, based on 13 years at $14,902 and five years at $20,956 from the Department of Social Services' 2026 Costs of the Children estimates1. This is an illustrative calculation that holds 2026 values constant, and the data is a policy estimate of costs as a share of parents’ income, not measured spending.
How much more does a teenager cost than a younger child in Australia?
A child aged 13 and over costs an estimated $6,054 a year more than a child aged 0 to 12 at a combined child support income of $93,137, with annual estimates of $20,956 and $14,902 respectively, according to the Department of Social Services' 2026 figures1.
How much does a second child cost in Australia?
A second child aged 0 to 12 adds an estimated $6,986 a year at a combined child support income of $93,137, taking the estimated cost from $14,902 for one child to $21,888 for two, according to the Department of Social Services' 2026 estimates1.
What is the Costs of the Children Table?
The Costs of the Children Table is used by the Department of Social Services to estimate children's costs at different levels of parents' combined child support income for child support assessments. It is based on 2005 research, with amounts updated each year using male average weekly earnings.8 The figures are policy estimates, not actual household spending.
How much do families with dependent children spend each week in Australia?
Couple families with dependent children spent an average of $1,991.85 a week per household on goods and services in 2015-16, and one-parent families with dependent children spent $1,187.47, according to the Australian Bureau of Statistics Household Expenditure Survey10. These are household averages that include the parents’ own spending, not spending on each child.
References
- Child Support (Assessment) (Annualised Male Total Average Weekly Earnings Amount and Costs of the Children Table) Notice 2025 (C2025G00638) · legislation.gov.au ↑ b c d e f g h i j k l m n o p q r s
- Melbourne Institute, University of Melbourne: HILDA Statistical Report 2026 (Selected Findings from Waves 1 to 24) · melbourneinstitute.unimelb.edu.au ↑ b c d e
- ABS, Household Expenditure Survey, Australia: Summary of Results, 2015–16 · Australian Bureau of Statistics ↑ b c d e
- Child Support Guide, 2.3.1.10 About the COTC Table · guides.dss.gov.au ↑ b c d e
- Basic child support formula · servicesaustralia.gov.au ↑ b
- How your income affects your child support · servicesaustralia.gov.au ↑ b
- Department of Social Services: Budget Standards for Child Support Research, final report (published 18 June 2026) · dss.gov.au ↑ b
- In the Best Interests of Children: Reforming the Child Support Scheme (2005), Part C: Detailed Recommendations · dss.gov.au ↑ b c d e f
- Child Support Guide, 2.3.1.20 Current COTC Tables · guides.dss.gov.au ↑ b c d e f g h i j k l m n o p q r s t u v w x y z a2 b2 c2 d2 e2 f2 g2 h2 i2 j2 k2 l2 m2 n2 o2 p2 q2 r2 s2 t2 u2 v2 w2 x2 y2 z2 a3
- ABS, Household Expenditure Survey, Australia: Summary of Results, 2015–16, Household composition data cube (65300DO009) · Australian Bureau of Statistics ↑ b c d e f g h i j k l m n o p q r s t u v w x y z a2 b2 c2 d2 e2 f2 g2 h2 i2 j2 k2 l2 m2 n2 o2 p2 q2 r2 s2 t2 u2 v2 w2 x2 y2 z2 a3 b3 c3 d3 e3 f3 g3 h3 i3 j3 k3 l3 m3 n3 o3 p3 q3 r3 s3 t3 u3 v3 w3 x3 y3 z3 a4 b4 c4 d4 e4 f4 g4 h4 i4 j4 k4 l4 m4 n4 o4
- Child Support (Assessment) Act 1989 · legislation.gov.au ↑ b c d e f
- Costs of the Children Table 2008 · guides.dss.gov.au ↑ b c d e f g h
- ABS, Consumer Price Index, Australia, June quarter 2025 · Australian Bureau of Statistics ↑ b
- Costs of the Children Table 2025 · guides.dss.gov.au ↑ b c d
- Costs of the Children Table 2009 · guides.dss.gov.au ↑ b c
- Costs of the Children Table 2010 · guides.dss.gov.au ↑ b c
- Costs of the Children Table 2011 · guides.dss.gov.au ↑ b c
- Costs of the Children Table 2012 · guides.dss.gov.au ↑ b c
- Costs of the Children Table 2013 · guides.dss.gov.au ↑ b c
- Costs of the Children Table 2014 · guides.dss.gov.au ↑ b c
- Costs of the Children Table 2015 · guides.dss.gov.au ↑ b c
- Costs of the Children Table 2016 · guides.dss.gov.au ↑ b c
- Costs of the Children Table 2017 · guides.dss.gov.au ↑ b c
- Costs of the Children Table 2018 · guides.dss.gov.au ↑ b c
- Costs of the Children Table 2019 · guides.dss.gov.au ↑ b c
- Costs of the Children Table 2020 · guides.dss.gov.au ↑ b c
- Costs of the Children Table 2021 · guides.dss.gov.au ↑ b c
- Costs of the Children Table 2022 · guides.dss.gov.au ↑ b c
- Costs of the Children Table 2023 · guides.dss.gov.au ↑ b c
- Costs of the Children Table 2024 · guides.dss.gov.au ↑ b c