

Published 18 May 2026 · Updated 2 July 2026
- 6.1%
- Saving rate in FY2025, up from 3.0% the year prior
- $274B
- Total household saving, up $58B year on year
- $17.9T
- Total household wealth, more than double the FY2015 level
- $4.33T
- Superannuation balance, up 93% since FY2015
 How much debt do Australian households have?As of December 2025, Australian households owe a combined $3.40 trillion, up from $2.06 trillion ten years earlier. That means household debt has grown by 65% in a decade, adding around $1.34 trillion…
 How long does it take to save a house deposit in Australia?In the March 2026 quarter, Australia’s mean dwelling price reached $1,111,100, up from $677,475 in 2017. A 20% deposit on the national mean home is now $222,220.
 Average savings in Australia by age: 2025 dataThe average male Australian aged 60 to 64 has $395,852 in superannuation. But that headline figure does not show the typical balance. The median balance for men in that age group is $219,773, nearly 4…
Section 01 · National savings
What is Australia's household saving rate?
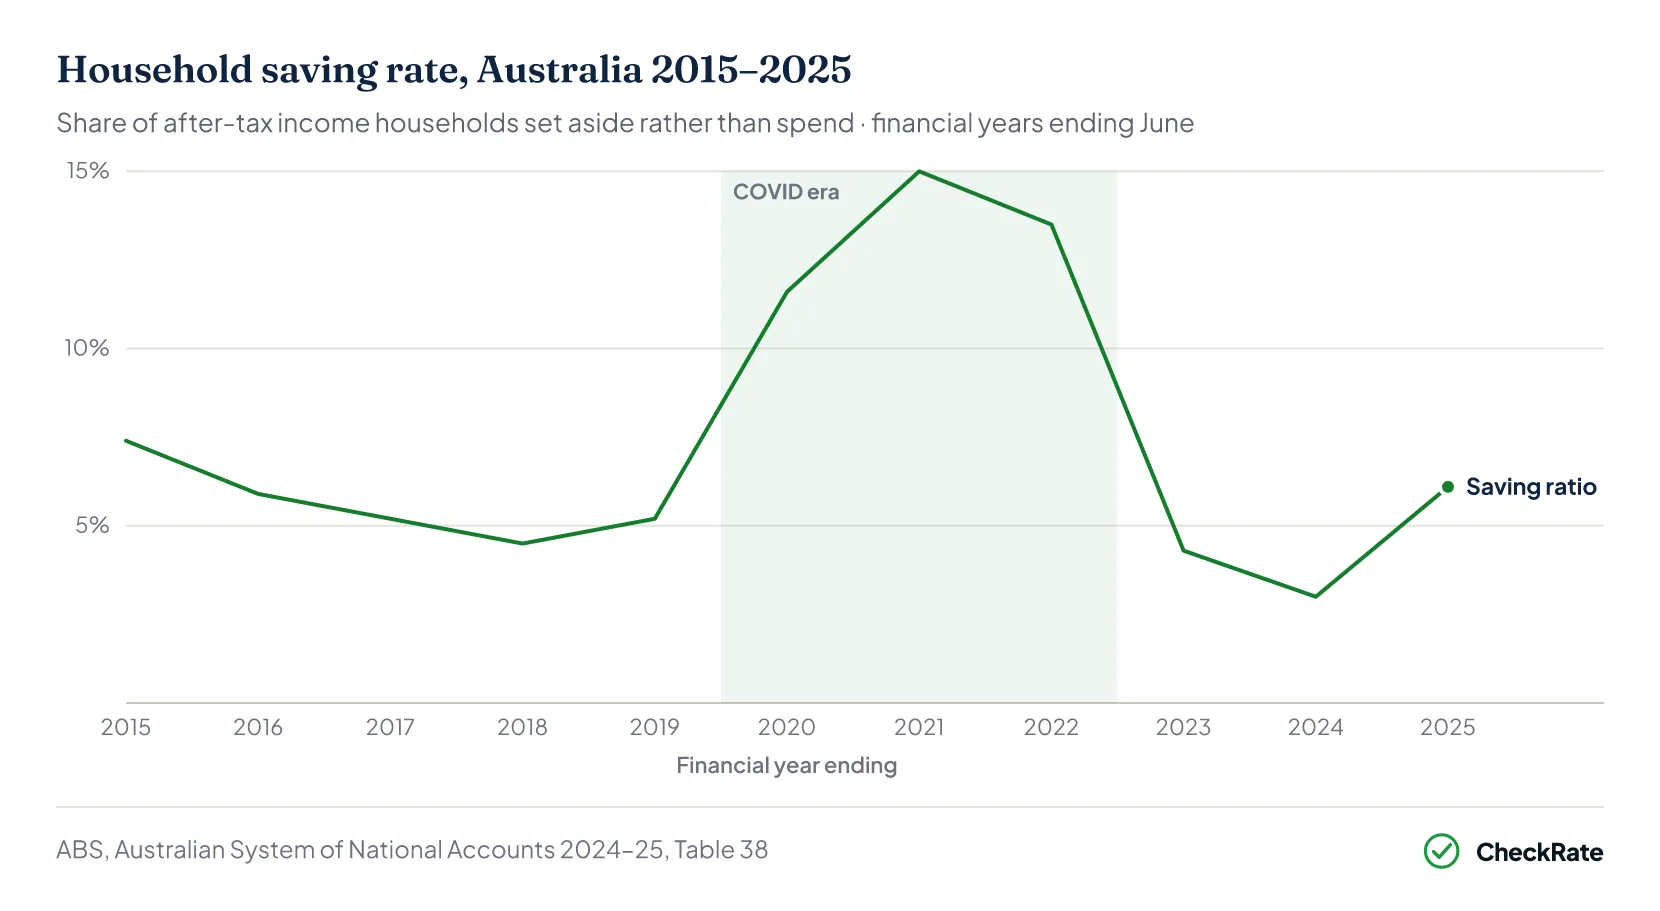
Australia's saving rate shifted over the past decade. Before the pandemic, it sat between 4.5% and 7.4%. When COVID lockdowns limited people's spending, savings increased. By FY2021, the saving rate had reached a peak of 15.0%. As restrictions lifted and spending returned, it fell. Inflation reaching 6.2% in FY2022 and interest rates rising quickly added further pressure. By FY2024, the rate had fallen to 3.0%, the lowest in the decade. The rate returned to 6.1% in FY2025 as income growth outpaced spending.
What is the saving rate?
The saving rate shows what share of after-tax income households set aside rather than spend. At 6.1%, for every $100 earned, $6.10 was saved. It is a national average. Individual results differ, particularly for households with large mortgage repayments at current interest rates.
Section 02 · Gross saving
How much do Australians save each year?
In dollar terms, Australians saved between $166 billion and $179 billion in most years before COVID. During the pandemic years saving rose, reaching a peak of $327.1 billion in FY2022. As spending returned, saving fell. By FY2024, total household saving was down to $216.7 billion. It rose again to $274.7 billion in FY2025, with income growing faster than spending for the first time in several years.
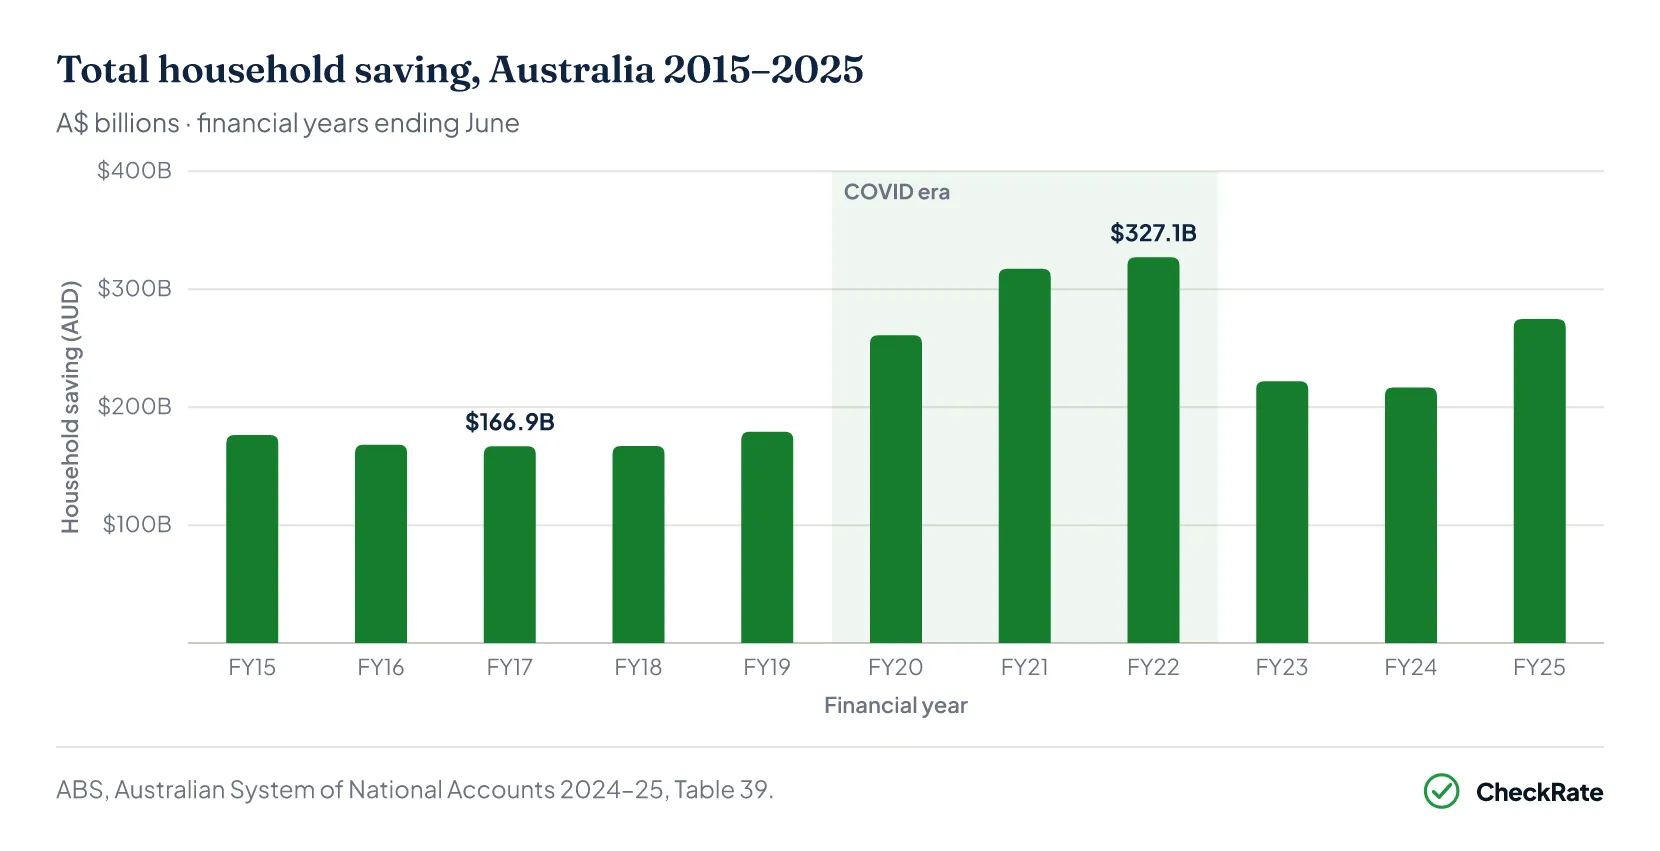
The RBA attributed the pandemic-era rise to three main factors. These included fewer places to spend money during lockdowns, low interest rates on existing debts, and government support payments, including JobKeeper.
The post-pandemic period reversed all three. Inflation peaked at 6.2% in FY2022, interest rates rose quickly, and real incomes fell. The rate recovered in FY2025 as inflation came back to 2.1% and incomes grew.
Australia's national savings data: 2015–2025
| National savings — annual data · FY2015 to FY2025 · A$ billions | ||||||
|---|---|---|---|---|---|---|
| Year | National Saving | Household Saving | Household Income | Household Spending | Saving Rate | Inflation |
| FY2015 | 78.9 | 176.4 | 1,093.7 | 917.3 | 7.4% | 1.5% |
| FY2016 | 39.3 | 168.2 | 1,119.7 | 951.5 | 5.9% | 1.0% |
| FY2017 | 70.1 | 166.9 | 1,150.6 | 983.7 | 5.2% | 1.9% |
| FY2018 | 71.8 | 167.1 | 1,192.4 | 1,025.3 | 4.5% | 2.1% |
| FY2019 | 92.3 | 179.2 | 1,240.7 | 1,061.5 | 5.2% | 1.5% |
| FY2020 | 111.7 | 261.0 | 1,304.5 | 1,043.5 | 11.6% | −0.3% |
| FY2021 | 163.7 | 317.3 | 1,382.7 | 1,065.4 | 15.0% | 3.8% |
| FY2022 | 179.9 | 327.1 | 1,473.5 | 1,146.3 | 13.5% | 6.2% |
| FY2023 | 167.1 | 222.0 | 1,524.0 | 1,302.0 | 4.3% | 6.0% |
| FY2024 | 137.3 | 216.7 | 1,595.1 | 1,378.4 | 3.0% | 3.8% |
| FY2025 | 114.2 | 274.7 | 1,715.7 | 1,441.0 | 6.1% | 2.1% |
Section 03 · Where Australians save
Where do Australians put their savings?
Household savings in Australia usually end up in three main places. Some goes into bank deposits, some into superannuation, and much of it is tied up in physical assets such as residential property.
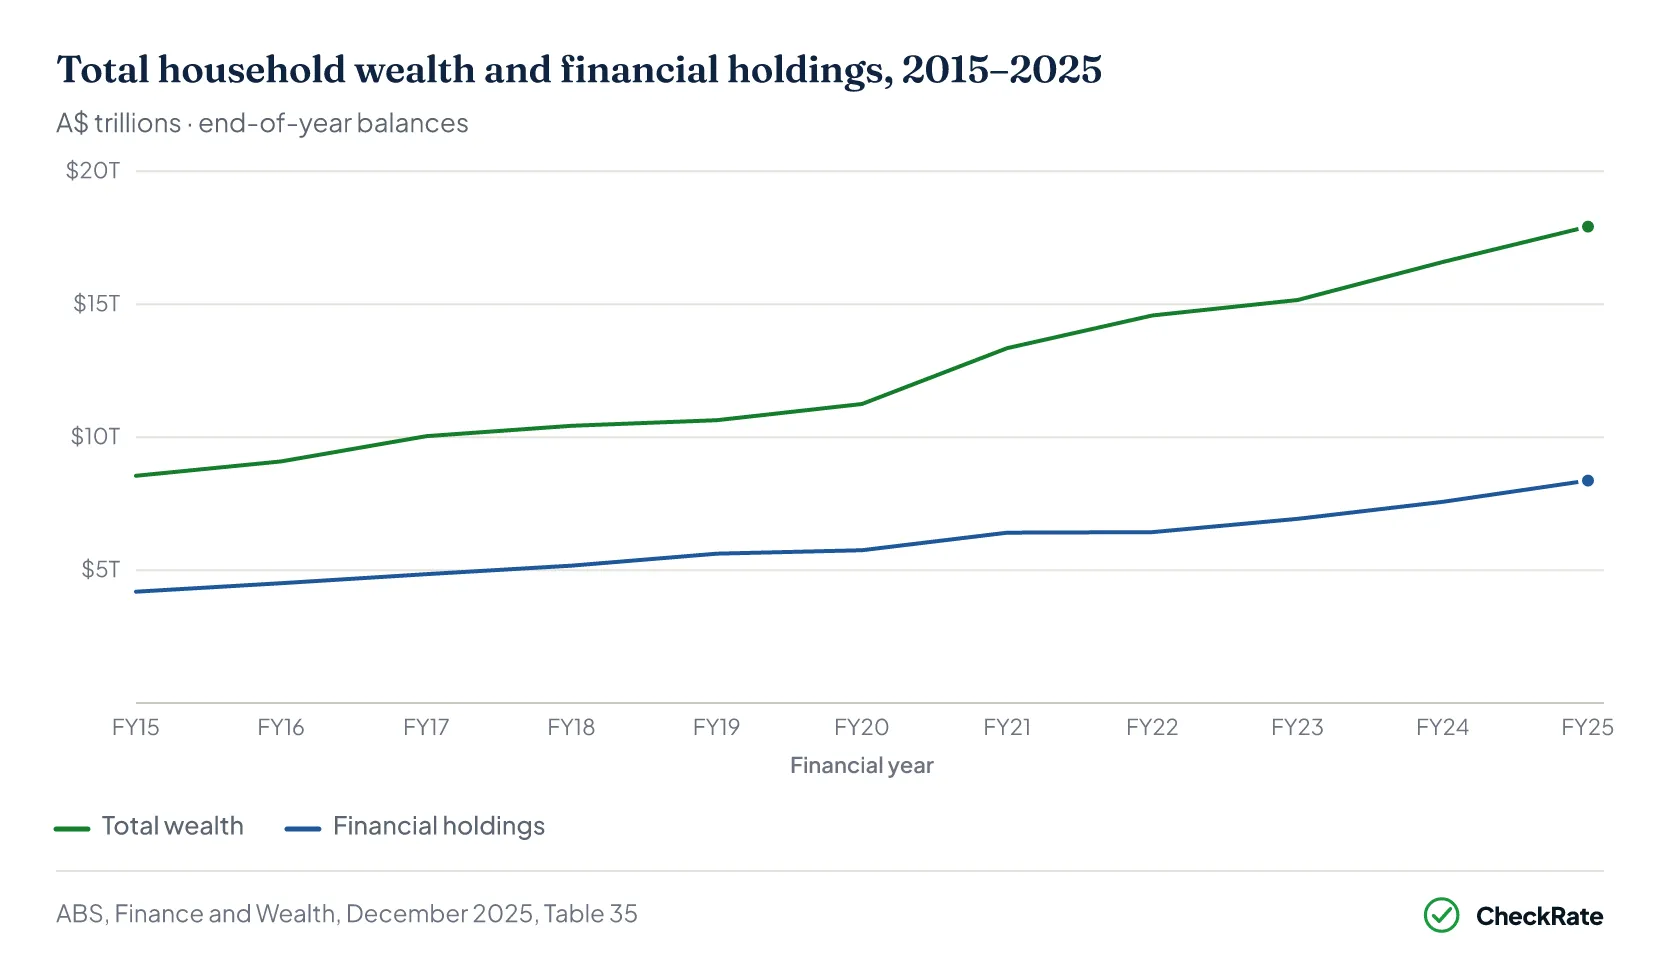
All three have grown over the past decade. Superannuation saw the largest dollar increase, up $2.09 trillion, while property values also rose considerably. Total wealth more than doubled from $8.55 trillion in FY2015 to $17.92 trillion in FY2025, due as much to rising asset values as to new savings each year.
Section 04 · Deposits and super
How much do Australians have in bank deposits and super?
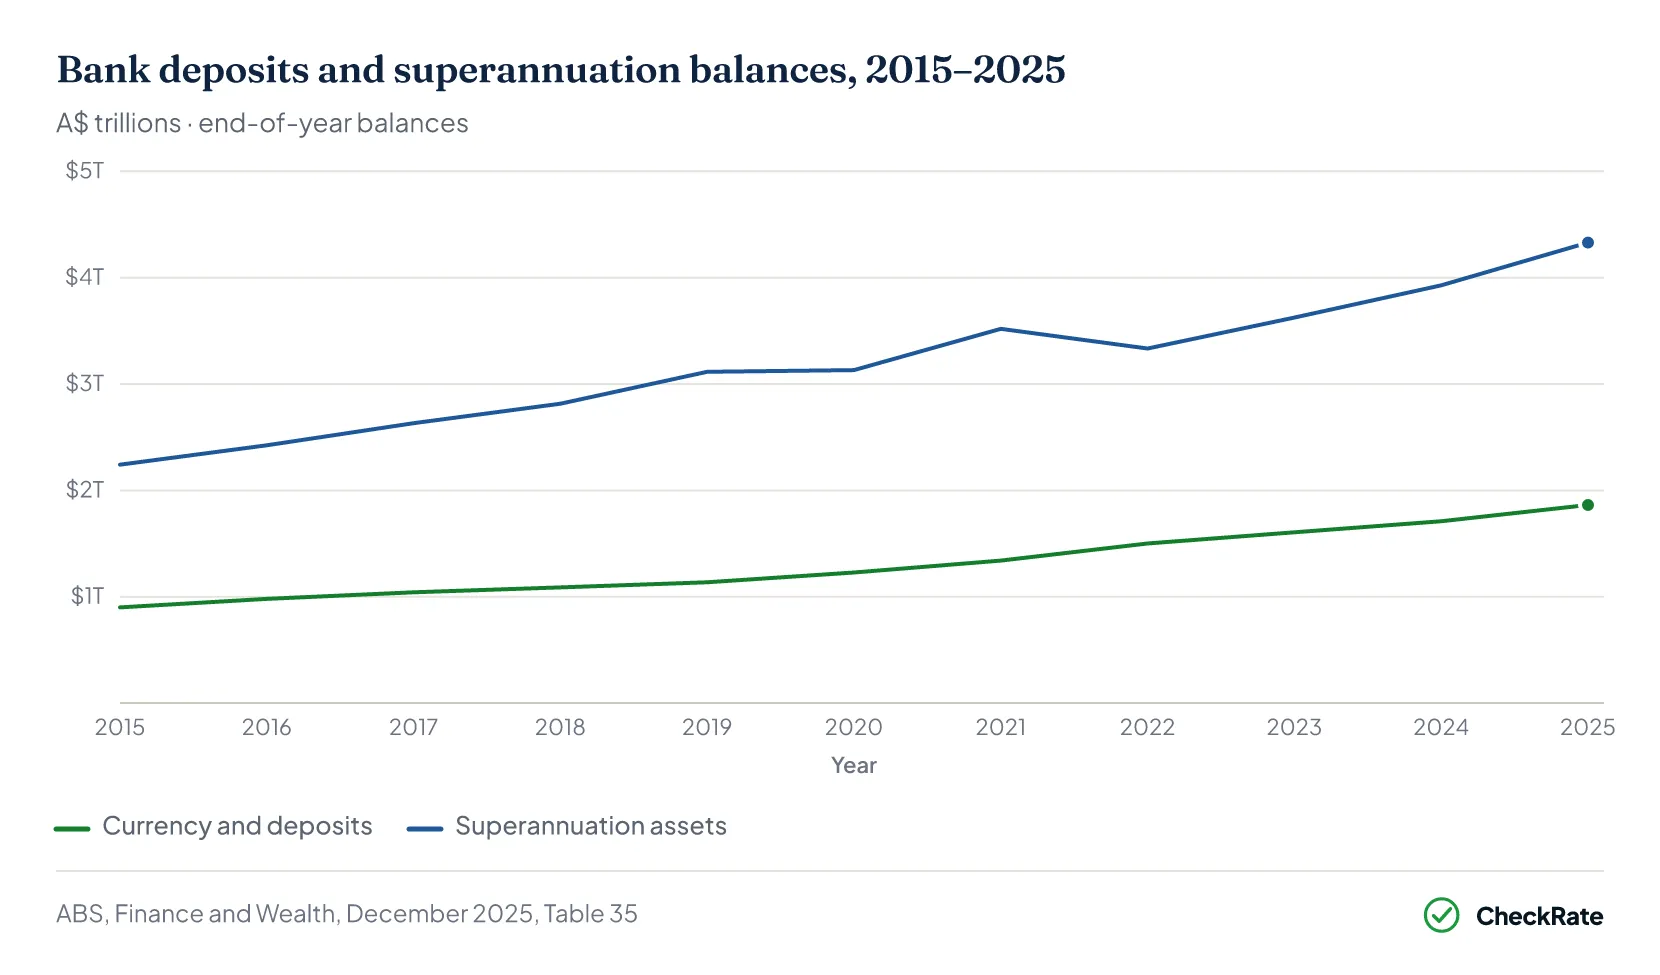
Bank deposits grew from $900.5 billion in FY2015 to $1.86 trillion in FY2025, up 107%. Superannuation grew faster, from $2.24 trillion to $4.33 trillion over the same period, up 93%. This reflects the compulsory super rate rising from 9.5% to 11.5%, as well as investment returns over the period. The dip in super balances in FY2022 was caused by sharemarket falls that year, not withdrawals.
Section 05 · Net worth
What is the average Australian household worth?
Total household wealth, meaning everything households own minus everything they owe, crossed $10 trillion in FY2017 and has more than doubled since FY2015. The largest single-year increase came in FY2021, when property prices rose during the pandemic, and total wealth grew by more than $2.1 trillion. By FY2025, financial holdings alone stood at $8.37 trillion, up from $4.19 trillion a decade earlier. This includes deposits, super, shares and similar assets, but excludes property.
Section 06 · Debt vs income
How much debt do Australians have compared to their income?
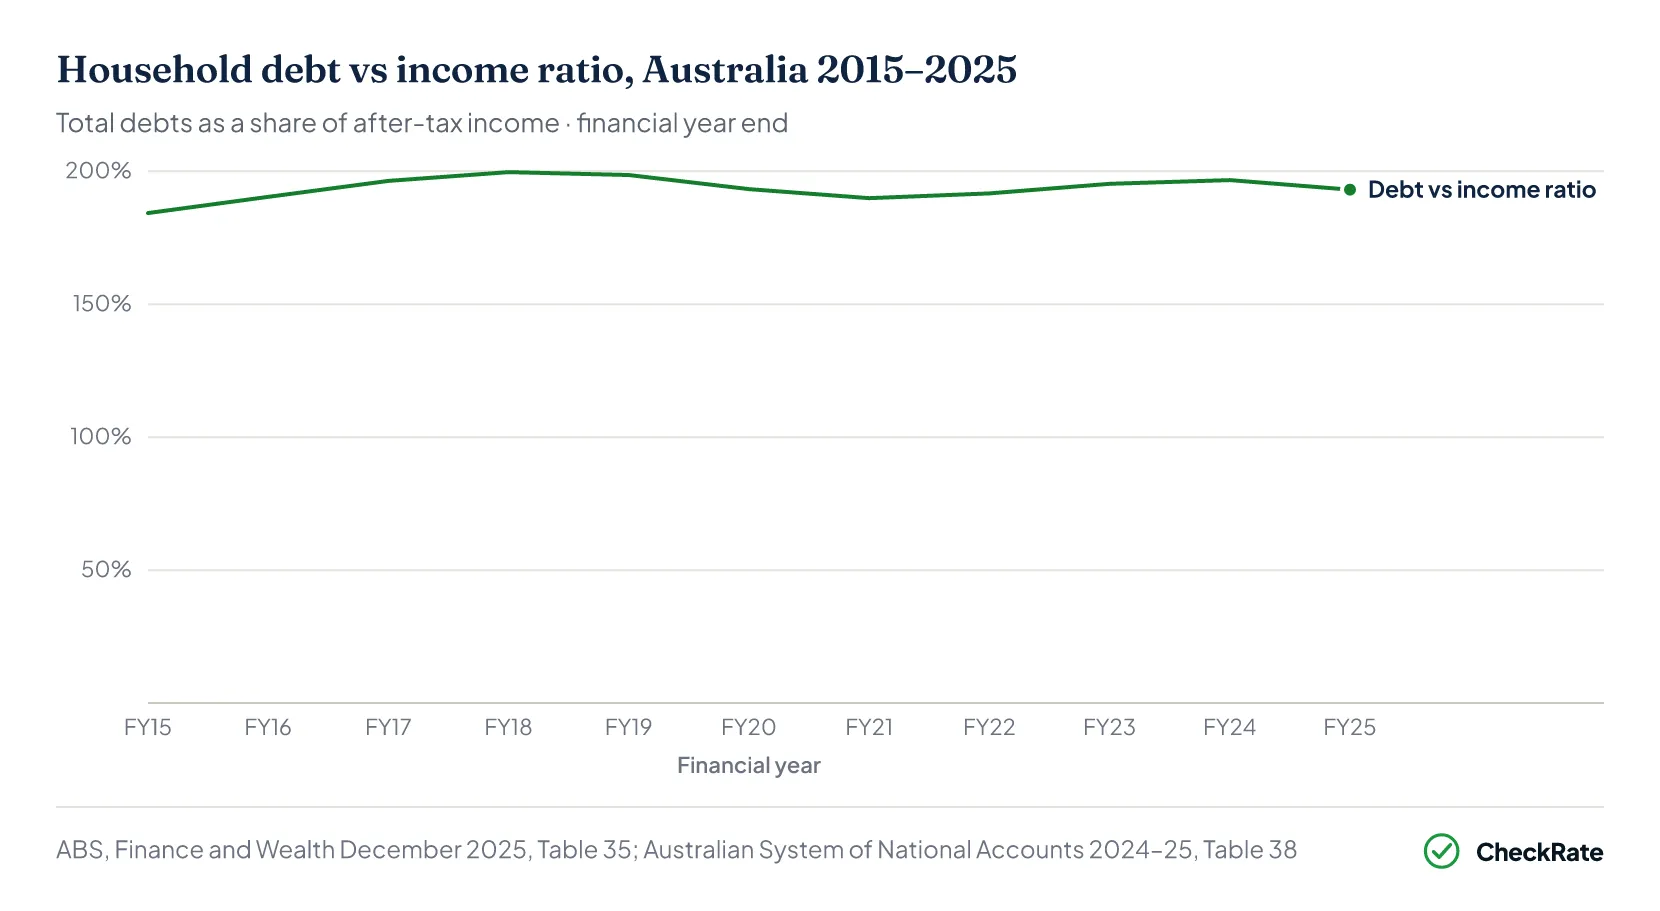
Despite rising wealth, Australian households carry among the highest debt loads in the developed world. Total debt as a share of after-tax income has remained above 184% throughout the decade. The ratio peaked at 199.7% in FY2018 and was at 193.1% in FY2025. The average for developed countries is around 120 to 130%. The main reason is mortgages.
Australian household savings and debts by year: 2015–2025
| Household savings & debts — annual data · FY2015 to FY2025 · A$ billions | ||||||
|---|---|---|---|---|---|---|
| Year | Bank Deposits | Superannuation | Total Assets | Total Debts | Net Worth | Debt vs Income |
| FY2015 | 900.5 | 2,242.0 | 4,188.2 | 2,016.2 | 8,549.4 | 184.3% |
| FY2016 | 980.7 | 2,424.0 | 4,506.3 | 2,132.1 | 9,091.2 | 190.4% |
| FY2017 | 1,042.0 | 2,631.9 | 4,851.6 | 2,259.7 | 10,044.2 | 196.4% |
| FY2018 | 1,088.8 | 2,815.5 | 5,172.3 | 2,381.6 | 10,433.3 | 199.7% |
| FY2019 | 1,136.2 | 3,115.2 | 5,615.7 | 2,464.1 | 10,639.4 | 198.6% |
| FY2020 | 1,228.3 | 3,131.5 | 5,745.7 | 2,521.9 | 11,247.6 | 193.3% |
| FY2021 | 1,340.5 | 3,519.5 | 6,413.8 | 2,625.7 | 13,348.5 | 189.9% |
| FY2022 | 1,501.5 | 3,334.7 | 6,429.3 | 2,825.0 | 14,576.3 | 191.7% |
| FY2023 | 1,606.0 | 3,625.7 | 6,933.4 | 2,975.9 | 15,163.5 | 195.3% |
| FY2024 | 1,710.7 | 3,928.5 | 7,565.4 | 3,138.3 | 16,585.1 | 196.7% |
| FY2025 | 1,863.0 | 4,330.9 | 8,370.1 | 3,312.5 | 17,919.9 | 193.1% |
The national figures don't show the variation at state and territory level. NSW and WA households saved at a very different rate to Victoria or South Australia, and the pandemic widened those differences.
Section 07 · State by state
Which state saves the most money in Australia?
In FY2025, New South Wales led the country with $89.1 billion in household saving, followed by Queensland ($60.2 billion) and Western Australia ($47.8 billion). Together, NSW and Queensland accounted for more than half the national total of $274.7 billion. The figures reflect both population size and income levels, so larger states naturally dominate.
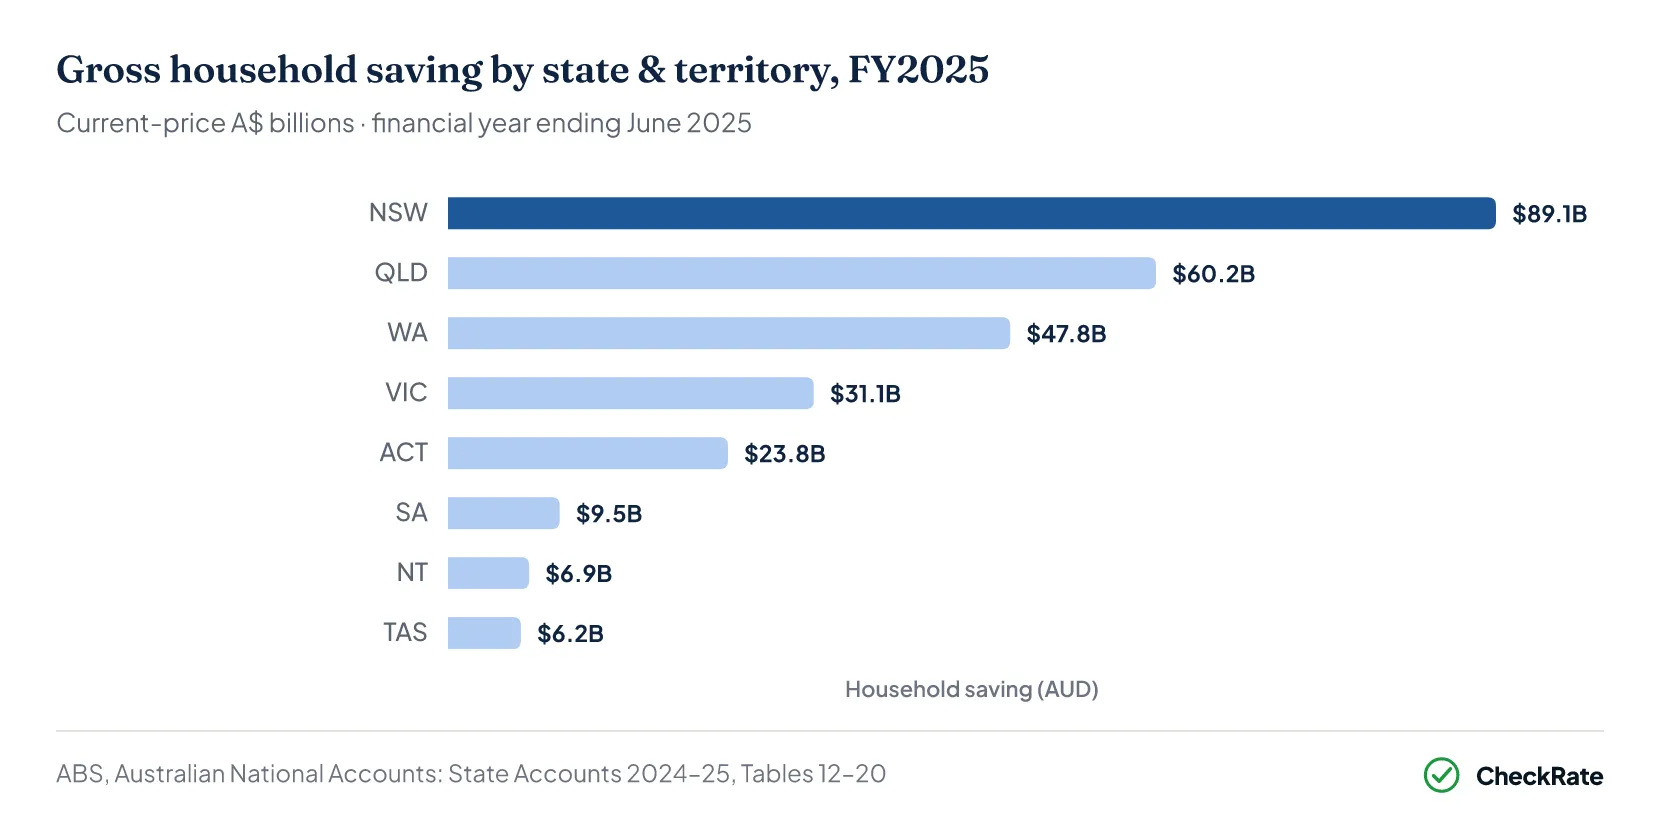
Victoria had the most variation of any state over the decade. Extended Melbourne lockdowns pushed household savings to $69.9 billion in FY2021, nearly three times its FY2015 level. Once restrictions lifted, spending came back, and savings fell. By FY2024, Victorian savings were down to $20.2 billion, below its FY2015 level of $23.5 billion. It rose to $31.1 billion in FY2025 but remains below its share of national income.
Saving trends by state: compare all states 2015–2025
The chart below shows NSW as the default. All states follow a similar pattern, remaining stable pre-COVID, rising sharply between FY2020 and FY2022, then falling as spending returned.
State and territory savings data: 2015–2025
| Gross household saving by state & territory · FY2015–FY2025 · A$ billions | |||||||||||
|---|---|---|---|---|---|---|---|---|---|---|---|
| State | FY15 | FY16 | FY17 | FY18 | FY19 | FY20 | FY21 | FY22 | FY23 | FY24 | FY25 |
| NSW | 47.8 | 49.1 | 51.7 | 50.9 | 58.4 | 87.7 | 101.8 | 107.3 | 72.9 | 78.9 | 89.1 |
| VIC | 23.5 | 19.2 | 20.2 | 17.3 | 22.1 | 45.1 | 69.9 | 61.5 | 26.4 | 20.2 | 31.1 |
| QLD | 32.5 | 31.1 | 31.5 | 34.5 | 34.4 | 47.6 | 53.0 | 59.7 | 43.6 | 42.3 | 60.2 |
| SA | 11.0 | 9.6 | 8.9 | 9.1 | 9.1 | 13.9 | 17.5 | 17.9 | 8.7 | 7.2 | 9.5 |
| WA | 39.7 | 36.6 | 30.8 | 30.8 | 30.2 | 37.5 | 44.0 | 47.6 | 40.6 | 37.2 | 47.8 |
| TAS | 3.4 | 3.1 | 3.0 | 2.7 | 2.9 | 4.4 | 5.9 | 6.4 | 4.4 | 4.3 | 6.2 |
| NT | 5.2 | 5.2 | 5.8 | 6.2 | 5.7 | 5.9 | 6.0 | 6.6 | 5.9 | 5.9 | 6.9 |
| ACT | 13.4 | 14.4 | 15.0 | 15.6 | 16.4 | 18.9 | 19.3 | 20.2 | 19.4 | 20.7 | 23.8 |
| Australia | 176.4 | 168.2 | 166.9 | 167.1 | 179.2 | 261.0 | 317.3 | 327.1 | 222.0 | 216.7 | 274.7 |
Source · ABS, Australian National Accounts: State Accounts 2024–25
Section 08 · Key trends
How have Australian savings changed over the past 10 years?
The decade from FY2015 to FY2025 breaks into four phases, each shaped by a different economic force.
FY15–19
Pre-pandemic: slight decline
Household savings stayed between $166 and $179 billion while the saving rate fell from 7.4% to 5.2%. Inflation was low at 1 to 2%, but debt levels were already high, running between 184% and 200% of income. Spending and income grew at a similar pace.
FY20–22
COVID-era saving rise
Household savings rose from $179.2 billion in FY2019 to $327.1 billion in FY2022. The saving rate reached 15.0% in FY2021. The RBA cited three drivers: fewer places to spend during lockdowns, low interest rates on debt, and government support payments, including JobKeeper and COVID supplements.
FY23–24
Post-pandemic pressure
Saving fell as inflation hit 6.2% and the RBA raised rates from 0.10% to 4.35%. Total saving was down to $216.7 billion by FY2024, and the saving rate fell to 3.0%, the lowest point of the decade. Real household income per person was around 1% below pre-pandemic levels by early 2025.
FY2025
Recovery
Inflation came back to 2.1%, and incomes grew. Saving rose to $274.7 billion, and the saving rate returned to 6.1%. The ABS noted that rising deposits were supported by income growing faster than spending. Super balances reached a record $4.33 trillion.
"Across all regions, households are experiencing financial pressure, although severe stress remains confined to a relatively small share of borrowers."
— RBA Financial Stability Review, April 2025
Why did household wealth keep growing even when people saved less?
Total household wealth grew from $13.3 trillion in FY2021 to $17.9 trillion in FY2025, even as the saving rate fell. This happens because wealth is not just what you save each year. It also includes the rise in value of things you already own.
When house prices and sharemarkets go up, household wealth increases even if households save nothing. The ABS separates wealth changes into three sources: annual saving, other transactions, and asset value gains. This is why Australia can record a saving rate of 3 to 6% and still see total wealth double over ten years.
References
- ABS Australian System of National Accounts (cat. 5204.0), 2015-2025 · Australian Bureau of Statistics
- ABS Australian National Accounts: State Accounts 2024-25 · Australian Bureau of Statistics
- ABS Australian National Accounts: Finance and Wealth, December 2025 · Australian Bureau of Statistics
- ABS, Consumer Price Index, Australia, June 2026 · Australian Bureau of Statistics
- ABS Selected Living Cost Indexes, Australia, December 2025 · Australian Bureau of Statistics
- RBA Financial Stability Review, April 2022 · Reserve Bank of Australia
- RBA Statement on Monetary Policy, February 2025 · Reserve Bank of Australia
- RBA Financial Stability Review, April 2025 · Reserve Bank of Australia
Methodology note: *all years are financial years ending in June. Dollar figures are current-price A$. State figures are total (gross) household savings only. FY2025 national accounts are subject to revision as detailed records for that year are still being finalised.*