

Published 12 May 2026 · Updated 2 July 2026
- 468k
- Mortgaged households spending more than 30% of income at the 2021 Census
- 14.5%
- Share of all mortgaged households, down from 26.3% in 2011
- 17.3%
- Share in NSW, the highest of any state or territory
- 37%
- Lower-income mortgage holders over the 30% threshold in 2019–20
 Retiring with a mortgage in Australia: older home owners and retirement incomeMortgage debt remained part of later life for 971,500 owner-occupier households aged 55 and over in 2019–20, including 225,700 where the reference person was 65 or older. These figures show that mortg…
 How much income is needed to buy a home in Australia?Property price has the biggest effect on the income needed to buy a home, because a higher purchase price increases both the loan size and the assessed repayment.
 How long does it take to save a house deposit in Australia?In the March 2026 quarter, Australia’s mean dwelling price reached $1,111,100, up from $677,475 in 2017. A 20% deposit on the national mean home is now $222,220.
Section 01 · What it means
What is mortgage stress?
Mortgage stress is a term used when housing costs take up a large share of a household's income.
There is no single legal definition, but the most common measure is the 30% rule. This means a household may be considered under housing stress if it spends more than 30% of its gross income on housing costs. The Australian Bureau of Statistics uses a stricter measure called the 30/40 rule. Under this rule, a household is counted as being in housing stress only if it spends more than 30% of its gross income on housing and is also in the lowest 40% of income earners.
This matters because higher-income households may be able to spend more on housing and still manage other costs. Lower-income households usually have less spare income, so the same share of housing costs can create more pressure.
The 30% rule
- >30%
Of gross income spent on mortgage repayments. The standard housing-stress benchmark.
The 30/40 rule
- 30/40
Above the 30% threshold AND in the lowest 40% of income earners. Used in ABS housing affordability research.
A few things to keep in mind:
- Stress describes budget pressure. Arrears means already being behind on repayments. A household can be in mortgage stress without missing a repayment.
- Definitions vary across data sources. The ABS Census uses equivalised household income (adjusted for household size), so the same dollar income can mean different things depending on how many people live there.
- The 30% threshold is a marker, not a cliff. Households just below 30% can feel stretched, and some above it cope without difficulty.
What is the 30/40 rule for mortgage stress?
The 30/40 rule counts a household as being in housing stress if it spends more than 30% of gross income on housing and is in the lowest 40% of income earners. It is designed to focus on lower-income households, where high housing costs are more likely to reduce money available for other essentials.
Are there other ways mortgage stress is measured?
Yes. Some private survey-based measures use after-tax income with a sliding threshold of 25%–45% based on income and spending levels. Bank-side measures, such as APRA's 'loans 30–89 days past due', track formal arrears rather than budget pressure. Each method captures a different aspect of stress and produces different headline numbers.
Section 02 · How many
How many Australians are in mortgage stress?
At the 2021 Census, around 468,800 mortgaged Australian households were spending more than 30% of their income on mortgage repayments. This was out of a national total of 3.24 million mortgaged households, putting the share in stress at 14.5%. Another 374,700 households were classed as 'unable to determine' because their income data was incomplete or only partly reported.
This figure is a snapshot from a specific point in time. It captures households when the RBA cash rate was 0.10%, an all-time low, and many borrowers had refinanced into very low fixed rates during 2020 and 2021. The share of mortgaged households in stress had also been falling for a decade, from 26.3% in 2011 to 19.3% in 2016, and 14.5% in 2021. Lower borrowing costs are likely to have contributed to that decline, although the data does not isolate one single cause.
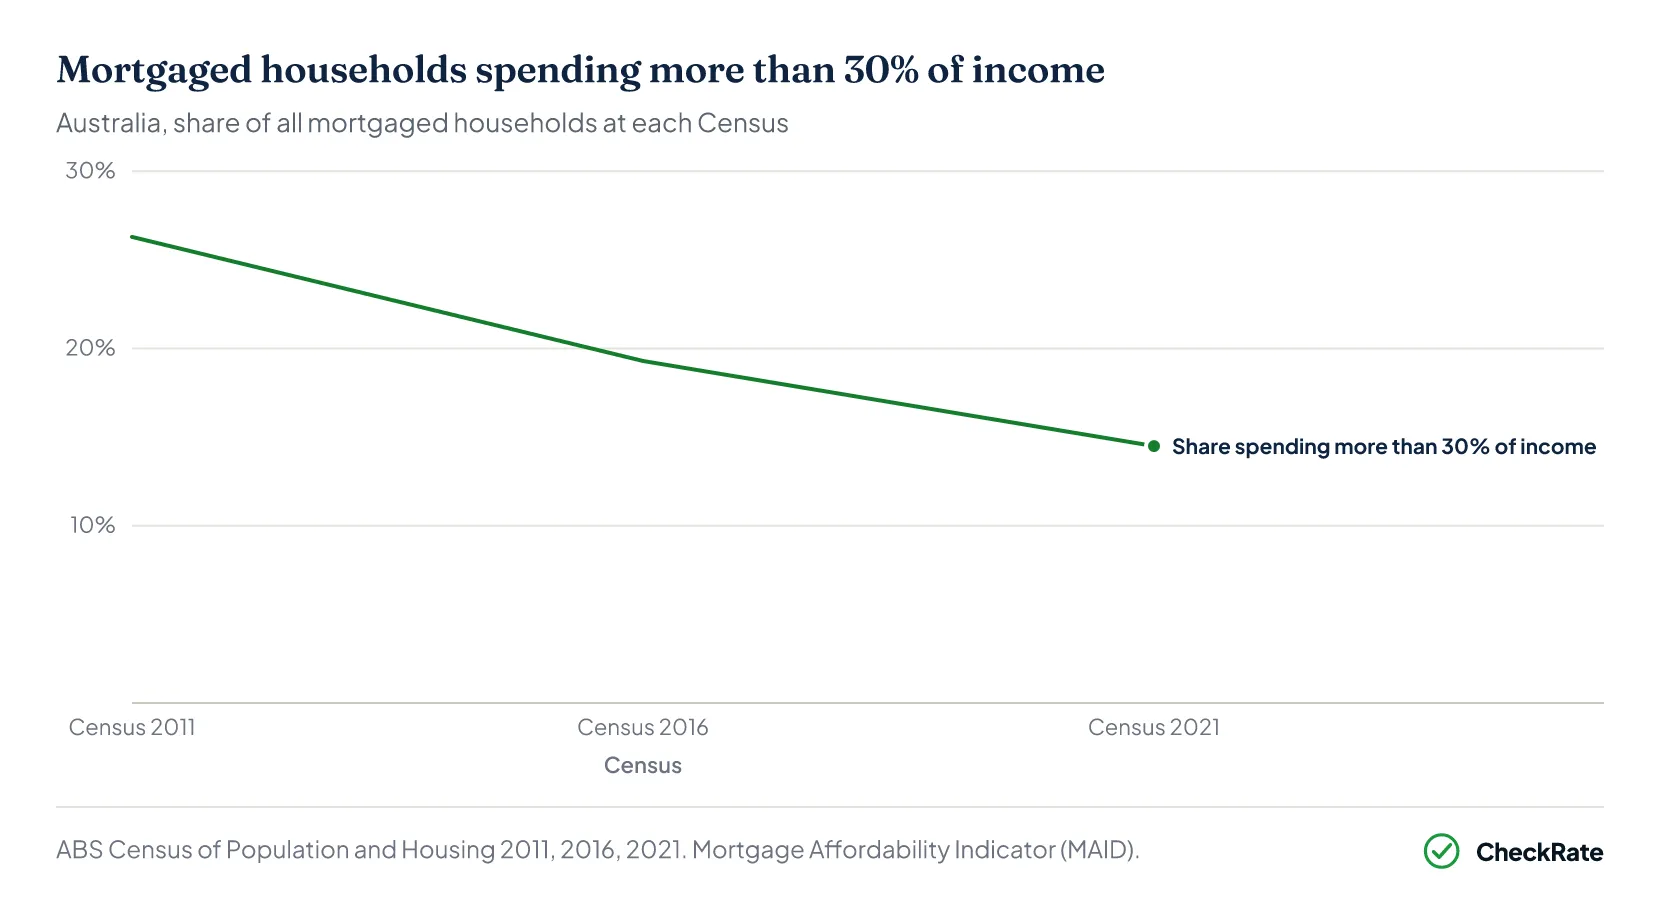
The share of mortgaged households spending more than 30% of income on repayments fell between 2011 and 2021. The 2021 Census captured conditions before the RBA rate-rise cycle began in May 2022.
Since then, mortgage conditions have changed. APRA data shows new lending has tilted further toward higher-leverage loans, with the share of new loans at a debt-to-income ratio of six times or more rising from 5.8% in December 2024 to 6.8% a year later. Non-performing housing loans remain below 1%, suggesting pressure is more visible in household budgets than in defaults.
How many Australian households are in mortgage stress?
At the 2021 Census, 468,800 mortgaged households, or 14.5% of those with a mortgage, were spending more than 30% of gross income on repayments. This is the latest official Census count. More recent private surveys use different methods, but one monthly estimate put 24.9% of mortgage holders “at risk” in February 2026.
Why did mortgage stress fall between 2011 and 2021?
Falling interest rates were likely a major factor. The RBA cut the cash rate from 4.75% in late 2011 to 0.10% by the end of 2020, lowering repayments for variable-rate borrowers and making fixed rates around 2% available for some loans. Many mortgaged households had lower monthly repayment pressure in 2021, even as loan sizes rose. The 2022–2023 rate-rise cycle has since reversed much of that effect.
Section 03 · What drives it
What drives mortgage stress in Australia
The 30% threshold is crossed when housing payments grow faster than household incomes. ABS data points to three main drivers that have built up over the past decade or more: bigger loans, the post-2022 rise in mortgage interest costs, and a longer-run lift in the real cost base of mortgaged ownership. None of these is a single event. Each one built up slowly, then compressed into the picture seen in 2023 and beyond.
Loan sizes have increased
The clearest driver is loan size. ABS Lending Indicators show the national average new owner-occupier dwelling loan rose from $432,000 in December 2015 to $736,000 in December 2025. That is a 70% increase over a decade. In NSW, the average rose from $534,000 to $873,000, a 63% increase. Wages have grown much more slowly over the same period. Bigger loans mean bigger repayments and greater sensitivity to rate movements.
Interest costs rose during the rate-rise cycle
The ABS Housing Serviceability indicator captures the impact of the post-2022 tightening on the cost side. Mortgage interest charges for employee households were up 91.6% in the year to the June quarter 2023, the peak of the cycle. As a share of gross income, housing costs for owners with a mortgage rose from 14% in 2022 to 16% in 2023, a two-percentage-point step in a single year.
Mortgage costs were rising before the 2022 rate cycle
The post-2022 rate cycle followed a much longer upward trend in mortgage costs. In real 2019–20 dollars, average weekly housing costs for owners with a mortgage rose from $351 in 1999–00 to $493 in 2019–20. That is a 40% increase over two decades. Over the same period, the share of Australian households owning with a mortgage rose from 32.1% to 36.8%. This means more households were carrying mortgage costs, and those costs were already higher in real terms before the recent rate rises began.
What is the main reason mortgage stress increased after 2022?
The combination of larger outstanding loan balances and a fast rate-rise cycle. The RBA cash rate moved from 0.10% to 4.35% between May 2022 and November 2023. The ABS Housing Serviceability indicator recorded mortgage interest charges for employee households up 91.6% in the year to the June quarter 2023. Households entering the cycle with average new loans well above $600,000 felt the largest dollar impact.
Why have mortgage payments grown faster than wages?
Loan sizes have been growing faster than incomes for years. The national average new owner-occupier loan rose by about 70% from December 2015 to December 2025, while real wages grew much more slowly over the same period. That means newer buyers often commit a larger share of income to housing before rate changes are even included.
Section 04 · By state and territory
Mortgage stress by state and territory
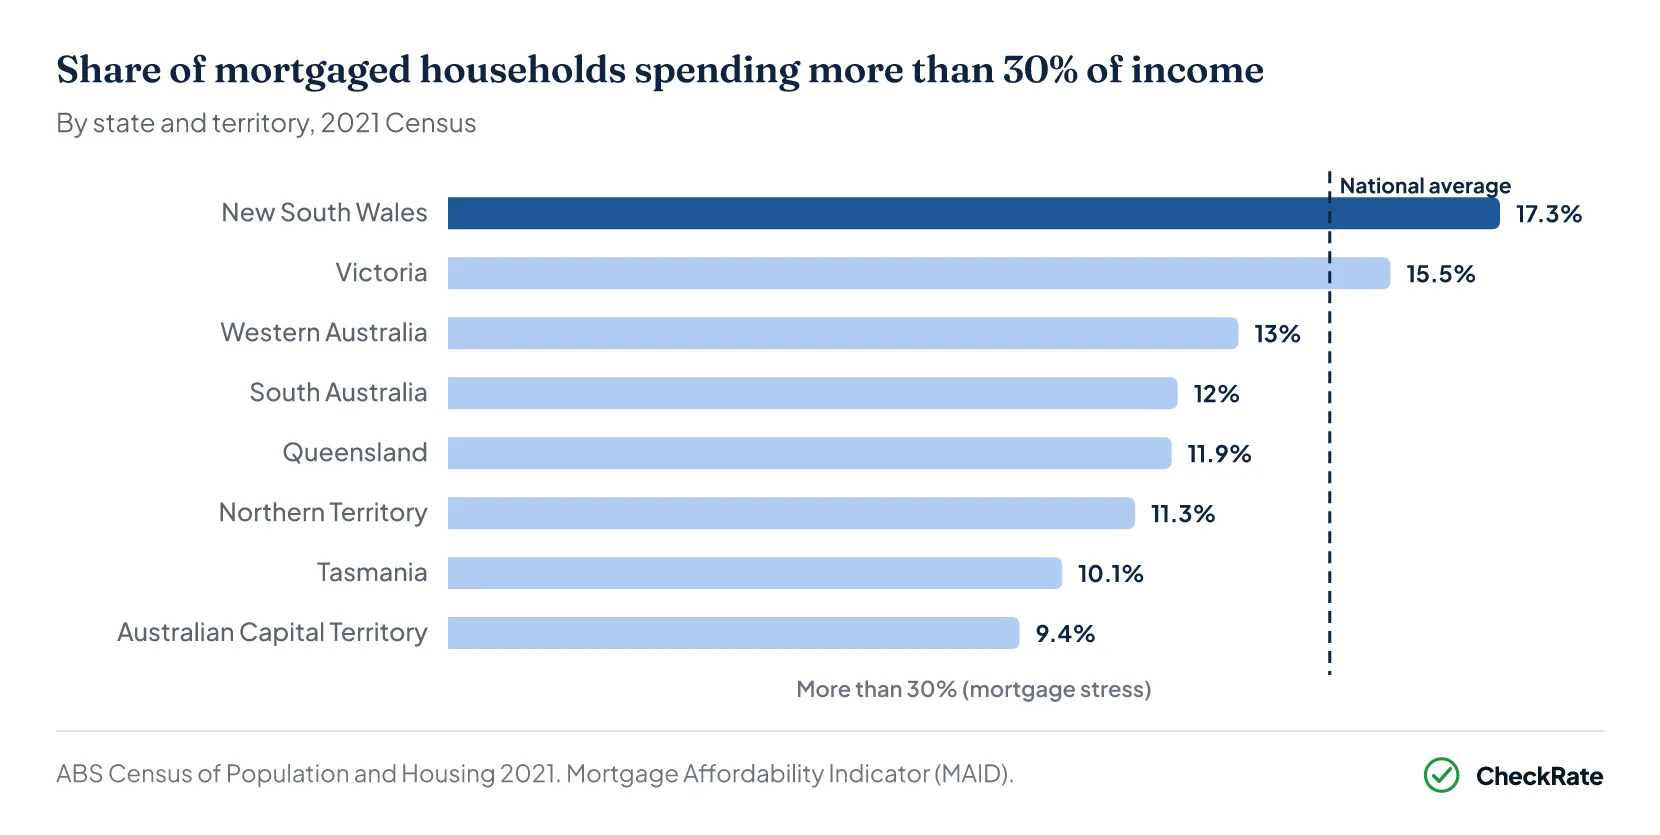
New South Wales had the highest share, with 17.3% of mortgaged households spending more than 30% of income on repayments. That equalled around 163,000 households. Victoria followed at 15.5%. At the other end, the ACT had the lowest share at 9.4%, helped by relatively higher household incomes. Tasmania (10.1%) and the Northern Territory (11.3%) also sat below the national average of 14.5%.
The state pattern reflects a fairly straightforward relationship: regions with higher property prices tend to have larger loans and tighter household budgets, even when incomes are also higher. NSW had the largest mortgages and the highest median repayments at the time.
Every state and territory saw the share of mortgaged households over the 30% threshold fall by between 9.5 and 13.9 percentage points over the decade. Queensland recorded the largest drop, from 25.8% in 2011 to 11.9% in 2021. The 2021 picture was a low point for the whole country, before the rate-rise cycle began the following year.
| Mortgage stress by state and territory, 2011 vs 2021 | ||||
|---|---|---|---|---|
| State / territory | Mortgaged households (2021) | Share > 30% (2011) | Share > 30% (2021) | Decade change |
| New South Wales | 942,801 | 29.1% | 17.3% | −11.8 pp |
| Victoria | 862,651 | 26.0% | 15.5% | −10.5 pp |
| Western Australia | 385,632 | 24.7% | 13.0% | −11.7 pp |
| South Australia | 246,340 | 23.2% | 12.0% | −11.2 pp |
| Queensland | 643,463 | 25.8% | 11.9% | −13.9 pp |
| Northern Territory | 21,361 | 23.0% | 11.3% | −11.7 pp |
| Tasmania | 72,160 | 20.5% | 10.1% | −10.4 pp |
| Australian Capital Territory | 67,753 | 18.9% | 9.4% | −9.5 pp |
| Australia | 3,242,453 | 26.3% | 14.5% | −11.8 pp |
Source · ABS Census of Population and Housing 2011 and 2021. Mortgage Affordability Indicator (MAID).
Which Australian state has the highest mortgage stress?
NSW had the highest share at the 2021 Census, with 17.3% of mortgaged households spending more than 30% of income on repayments. Victoria followed at 15.5%. The ACT had the lowest share at 9.4%, helped by higher median household incomes. NSW also had the largest number of households over the threshold, at around 163,000.
Why is mortgage stress higher in NSW and Victoria?
The pattern is mostly explained by property prices. Higher dwelling prices usually mean bigger loans and higher monthly repayments, which absorb a bigger share of income even when local incomes are also higher. NSW and Victoria include Australia's most expensive housing markets, so their state-level mortgage-stress shares sit above the national average.
Section 05 · By income
Mortgage stress by household income
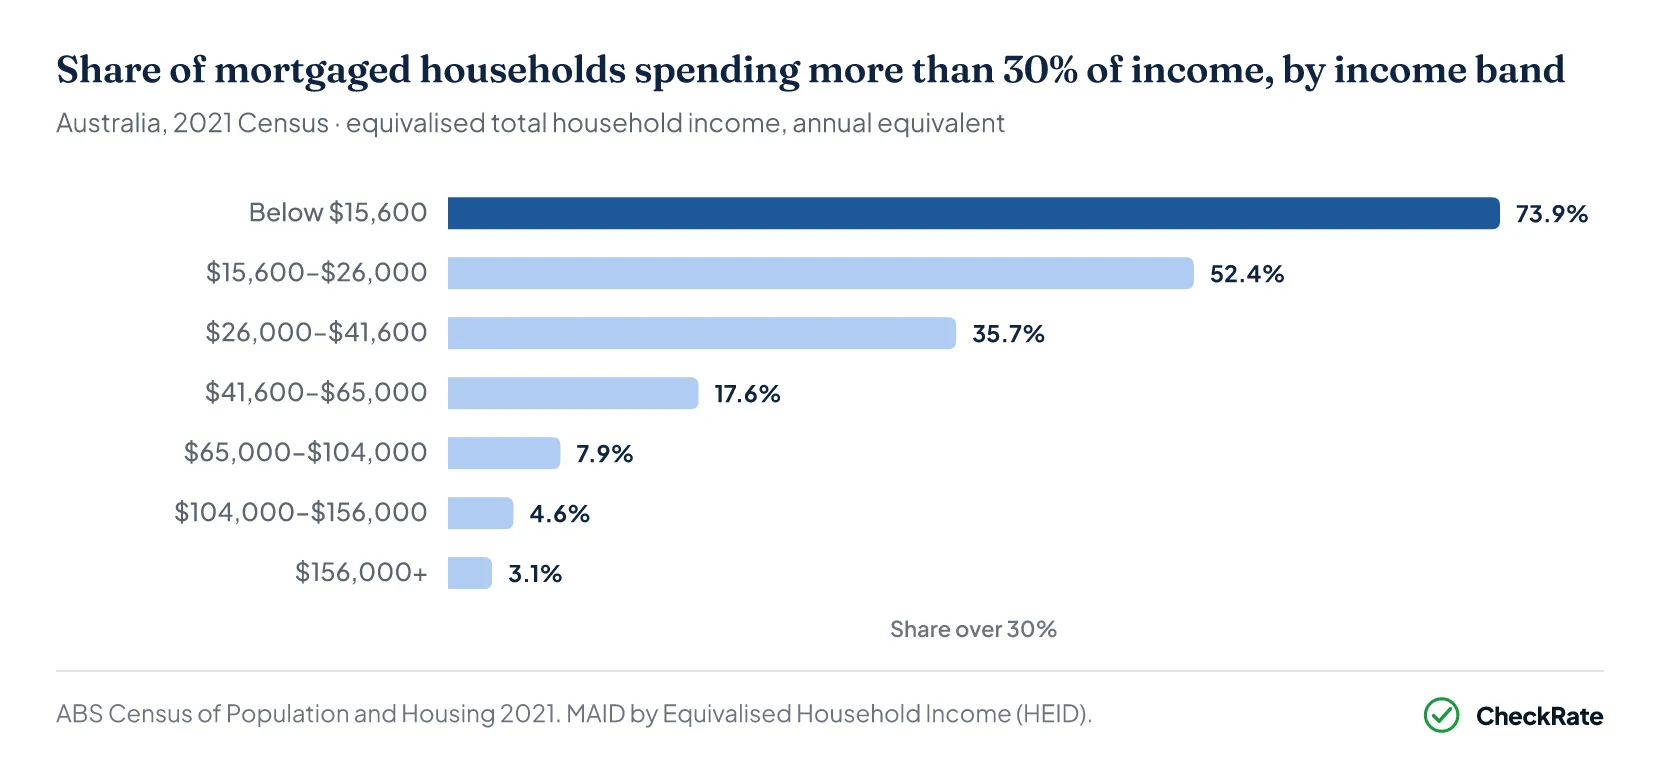
Household income is one of the strongest predictors of mortgage stress. Among mortgaged households at the bottom of the income distribution, with equivalised household incomes below about $26,000 a year, more than half were spending more than 30% of their income on repayments. Among households above $130,000, only around 3% crossed that threshold.
The 30% rule is concentrated almost entirely in the lower-to-middle income bands. The pattern is sharpest among lower-income households and much flatter among higher-income households. Lower-income mortgaged households are several times more likely to be over the 30% threshold than higher-income ones. Once household income rises above $80,000, the share of stress drops to single digits.
The ABS Housing Occupancy and Costs survey, last released for 2019–20, looked at lower-income mortgage holders. It found 37% of lower-income mortgage-holding households spent more than 30% of gross income on housing costs. That was down from 41% in 2017–18. Their average weekly housing cost was $376, equal to 27% of gross weekly income on average, already close to the standard stress threshold before the post-2022 rate cycle.
Are lower-income households more likely to be in mortgage stress?
Yes, by a wide margin. At the 2021 Census, more than half of mortgaged households with equivalised incomes under $26,000 were spending over 30% of their income on repayments, compared with around 3% of mortgaged households earning above $130,000. The 2019–20 ABS housing survey found 37% of lower-income mortgage-holding households were over the 30% threshold, with average housing costs already absorbing 27% of gross income.
Section 06 · First-home buyers
Mortgage stress among first-home buyers
First-home buyers often face mortgage pressure in a different way from established owners. Their loans are usually larger relative to income, their deposits are smaller, and their loan-to-valuation ratios are higher. This means a larger share of their income can go towards housing costs.
In the 2019–20 ABS housing survey, around 420,100 first-home buyers had purchased recently, making up 38% of the 1.115 million recent-buyer group. Around 92% of first-home buyers had a mortgage. Their median weekly housing cost was $505, compared with $529 for changeover buyers. However, first-home buyers carried a higher income burden. Around 32% spent more than 25% of gross household income on housing costs, compared with 23% of changeover buyers.
These figures come from before the 2022–2023 rate-rise cycle, so the pressure has likely increased since then. Australia's average new owner-occupier loan rose by about 70% in the decade to December 2025. For new buyers, larger loans and smaller deposits can mean more income going towards housing costs, even before any further rate changes.
How many first-home buyers are under mortgage pressure?
In 2019–20, around 32% of first-home buyers spent more than 25% of gross household income on housing costs, against 23% for changeover buyers. About 92% of first-home buyers had a mortgage. The 25% threshold sits below the standard 30% stress line, so this measure captures early budget pressure as well as formal mortgage stress.
Did first-home buyer lending fall during the rate-rise cycle?
First-home buyers made up a smaller share of new lending. ABS Lending Indicators show first-home buyer lending was $67.9 billion in 2025, up in dollar terms from the 2023 trough, but still a smaller slice of a larger market. Investor lending grew faster over the same period.
Section 07 · Recent quarters
How interest rate rises changed mortgage stress
The 2021 Census captured Australia at the bottom of the rate cycle. Since then, the RBA lifted the cash rate from 0.10% in May 2022 to 4.35% by November 2023, the fastest tightening cycle since the early 1990s. Outstanding mortgage rates have eased slightly since the peak. The average rate on outstanding owner-occupier loans was 5.62% in February 2026, but the effect on monthly repayments has been significant. ABS data shows mortgage interest charges for employee households rose 91.6% in the year to the June quarter 2023 alone.
APRA's Quarterly ADI Property Exposures for December 2025 shows the lender-side picture after the rate rises. Total housing credit outstanding rose to $2,475 billion, up 6.6% from a year earlier. Loans 30–89 days past due fell slightly to 0.47%, and non-performing housing loans were 0.99%. Both arrears measures remain low. New lending, however, has shifted towards more highly leveraged borrowers.
The lender stress numbers remain low, but new lending profiles have moved further up the risk scale. New buyers are taking on larger debt loads to enter the market.
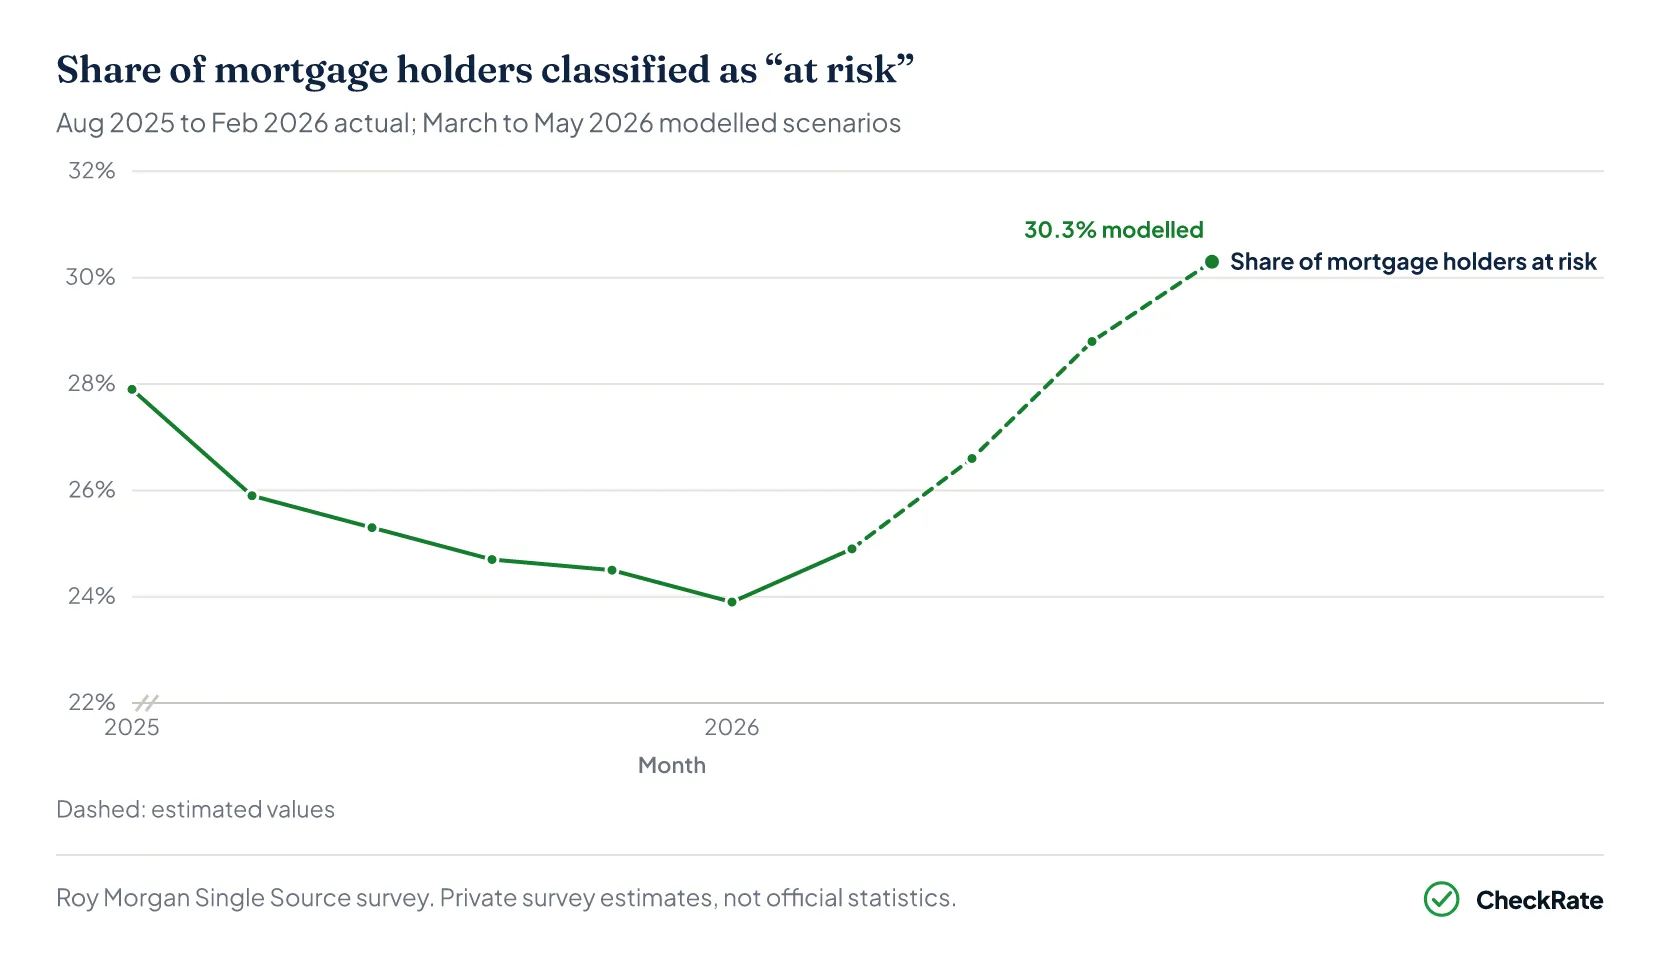
A separate private indicator from a monthly consumer survey tracks changes in mortgage pressure. It classifies a mortgage holder as “at risk” when repayments exceed a set share of after-tax household income, ranging from 25% to 45% depending on income and spending levels. Under this model, the share peaked at 30.3% in late 2023, eased to 24.5% by December 2025, then edged up to 24.9% in February 2026 after the cash rate moved to 3.85%. Modelled scenarios suggest a further rate rise to 4.35% would push the share back above 30%.
Has mortgage stress risen since the rate hikes began in 2022?
Available evidence suggests it has, although the latest official Census-based figure is still the 2021 baseline of 14.5%. Survey-based estimates use a different method and threshold, but recorded a peak of 30.3% of mortgage holders “at risk” in late 2023, before easing to around 24.9% in February 2026. APRA data shows lender-level stress, measured through arrears and non-performing loans, has stayed below 1%. This points to budget pressure rather than widespread default.
What does APRA data show about loan stress?
APRA's Quarterly ADI Property Exposures for December 2025 showed non-performing housing loans at 0.99% and loans 30–89 days past due at 0.47%, both lower than a year earlier. New lending shifted towards higher-risk borrower profiles: loans with a DTI of 6x or more rose from 5.8% to 6.8%, while loans with an LVR of 80% or more rose from 31.0% to 32.2%. This suggests existing borrowers are still largely meeting repayments, but new borrowers are taking on more debt relative to income and property value.
Section 08 · Dashboard
Explore the data
The dashboard below combines the Census figures into one interactive view. Use the tabs to step through three different cuts: by state and territory.
- Mortgaged households
- 942,801
- 2021 Census
- Spending > 30% of income
- 163,060
- Census MAID
- Share > 30%
- 17.3%
- Of mortgaged households
- Rank
- 1
- Among 8 states/territories
- Mortgaged households
- 862,651
- 2021 Census
- Spending > 30% of income
- 133,287
- Census MAID
- Share > 30%
- 15.5%
- Of mortgaged households
- Rank
- 2
- Among 8 states/territories
- Mortgaged households
- 643,463
- 2021 Census
- Spending > 30% of income
- 76,615
- Census MAID
- Share > 30%
- 11.9%
- Of mortgaged households
- Rank
- 5
- Among 8 states/territories
- Mortgaged households
- 246,340
- 2021 Census
- Spending > 30% of income
- 29,515
- Census MAID
- Share > 30%
- 12%
- Of mortgaged households
- Rank
- 4
- Among 8 states/territories
- Mortgaged households
- 385,632
- 2021 Census
- Spending > 30% of income
- 50,192
- Census MAID
- Share > 30%
- 13%
- Of mortgaged households
- Rank
- 3
- Among 8 states/territories
- Mortgaged households
- 72,160
- 2021 Census
- Spending > 30% of income
- 7,311
- Census MAID
- Share > 30%
- 10.1%
- Of mortgaged households
- Rank
- 7
- Among 8 states/territories
- Mortgaged households
- 21,361
- 2021 Census
- Spending > 30% of income
- 2,408
- Census MAID
- Share > 30%
- 11.3%
- Of mortgaged households
- Rank
- 6
- Among 8 states/territories
- Mortgaged households
- 67,753
- 2021 Census
- Spending > 30% of income
- 6,395
- Census MAID
- Share > 30%
- 9.4%
- Of mortgaged households
- Rank
- 8
- Among 8 states/territories
For broader data on Australian household borrowing, average loan sizes and lending volumes, see Australian mortgage statistics 2025. For longer-run trends in housing tenure and home ownership, see Australian home ownership statistics.
References
- ABS Census of Population and Housing 2021 · Australian Bureau of Statistics
- ABS Housing Occupancy and Costs, 2019-20 financial year · Australian Bureau of Statistics
- ABS Housing Serviceability indicator (Measuring What Matters) · Australian Bureau of Statistics
- APRA Quarterly ADI Property Exposures · apra.gov.au
- RBA Cash Rate Target and Lending Rates · Reserve Bank of Australia
- Lending Indicators, March Quarter 2026, Table 24, cat. 5601.0 · Australian Bureau of Statistics
- Roy Morgan Single Source survey · roymorgan.com
Methodology: ABS proportions are calculated from MAID counts. Equivalised income uses the ABS modified OECD scale.