


Updated
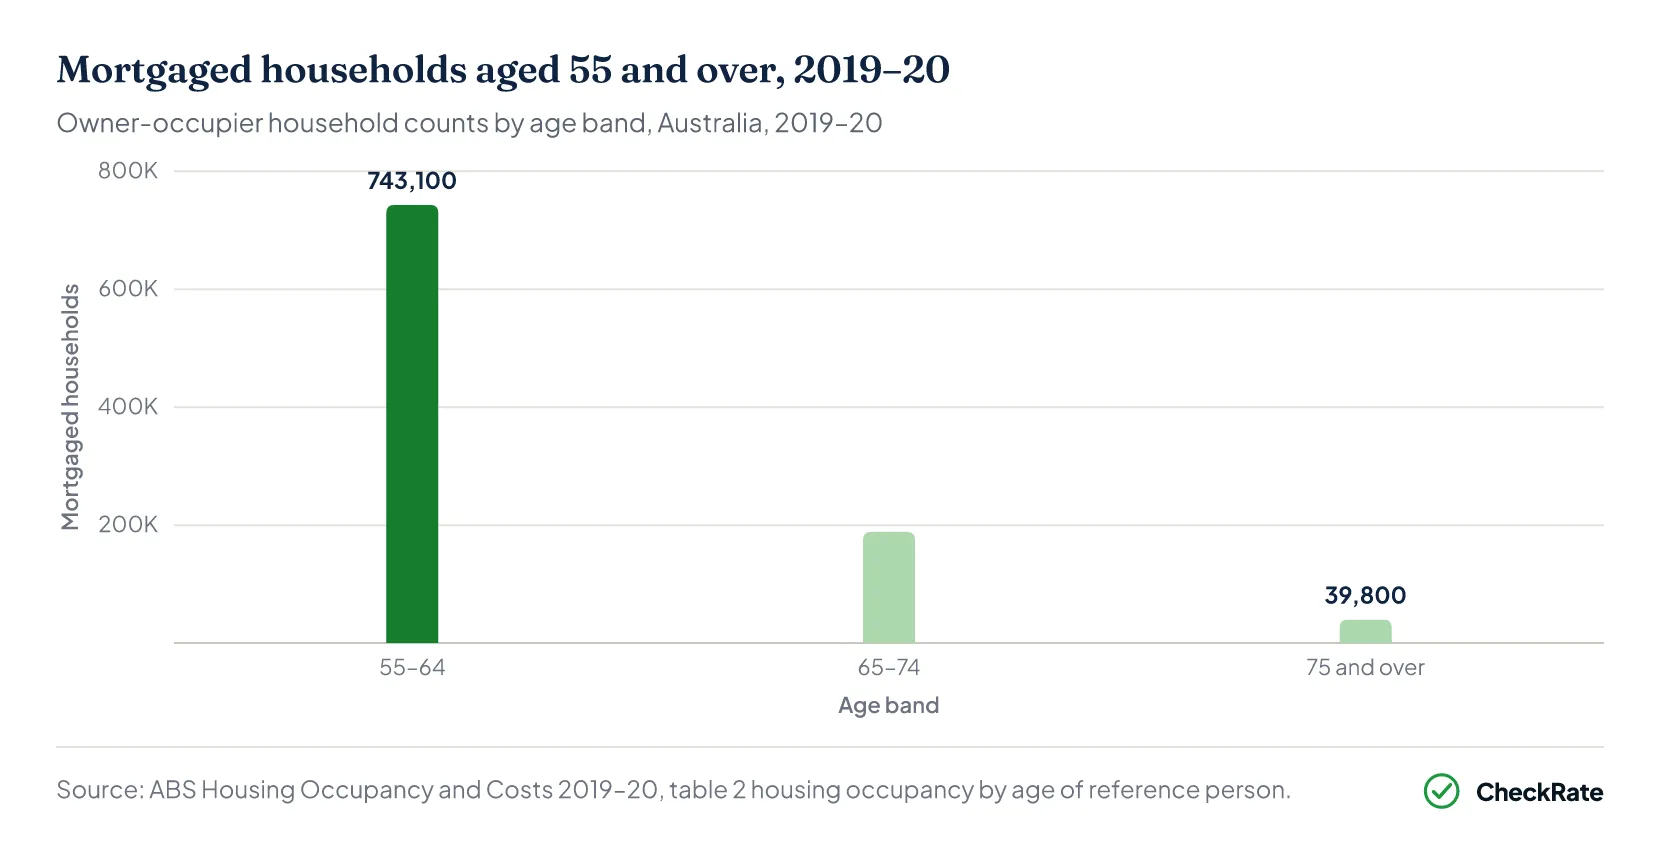
Mortgage debt remained part of later life for 971,500 owner-occupier households aged 55 and over in 2019–20, including 225,700 where the reference person was 65 or older. These figures show that mortgage debt is not limited to working-age households. For some older Australians, home loan repayments continue into the years when employment income may fall, and retirement income becomes more important.
- 971,500
- Households aged 55+ with a mortgage in 2019–20, incl. 225,700 aged 65+
- 43%
- Of households aged 55–64 had a mortgage; 13.4% at ages 65–74
- $405/wk
- Average housing costs, mortgaged 55–64 households vs $61/wk outright owners
- $1.835m
- Average net worth at 65–69; weekly household income fell to $1,564
 Average mortgage repayment in Australia: what homeowners pay each monthThe repayment for a new owner-occupier loan in Australia is around $4,006 a month, or $924 a week, based on a 30-year principal-and-interest term. The estimate uses the average 2025 loan size of $693,…
 Australian mortgage statistics 2026Australia had about 9.3 million occupied private dwellings at the 2021 Census. Of these, around 3.24 million (35.0%) were owned with a mortgage, 2.87 million (31.0%) were owned outright, and 2.84 mill…
 Mortgage stress in Australia: how many households are affected? (2026)Mortgage stress is a term used when housing costs take up a large share of a household's income.
Section 01 · Mortgage debt
How many Australians retire with mortgage debt?
In 2019–20, 971,500 owner-occupier households aged 55 and over carried a mortgage, including 225,700 where the reference person was 65 or older. This shows that mortgage debt is no longer limited to working-age households and remains part of later life for a significant number of older Australians.
Outright ownership remains the most common arrangement in later life, and most older Australians reach retirement without a mortgage. However, national home ownership rates have declined over time. Home ownership fell from 70% of all households in 2006 to 66.0% in 2021. Of that 66.0%, 35% owned with a mortgage and 31% owned outright.
This shift matters because mortgage debt is lasting longer for some older households. Buyers entering the market later can carry home loan debt further into older age, changing the mortgage profile of pre-retirement and retirement-age households.
Close to 9.8 million households were counted nationally in the 2021 Census. That dataset captures tenure patterns but not housing costs, which is why the age-by-cost comparisons in this article are drawn from the ABS Survey of Income and Housing 2019–20.
Section 02 · Mortgage debt by age
Mortgage debt by age group in Australia
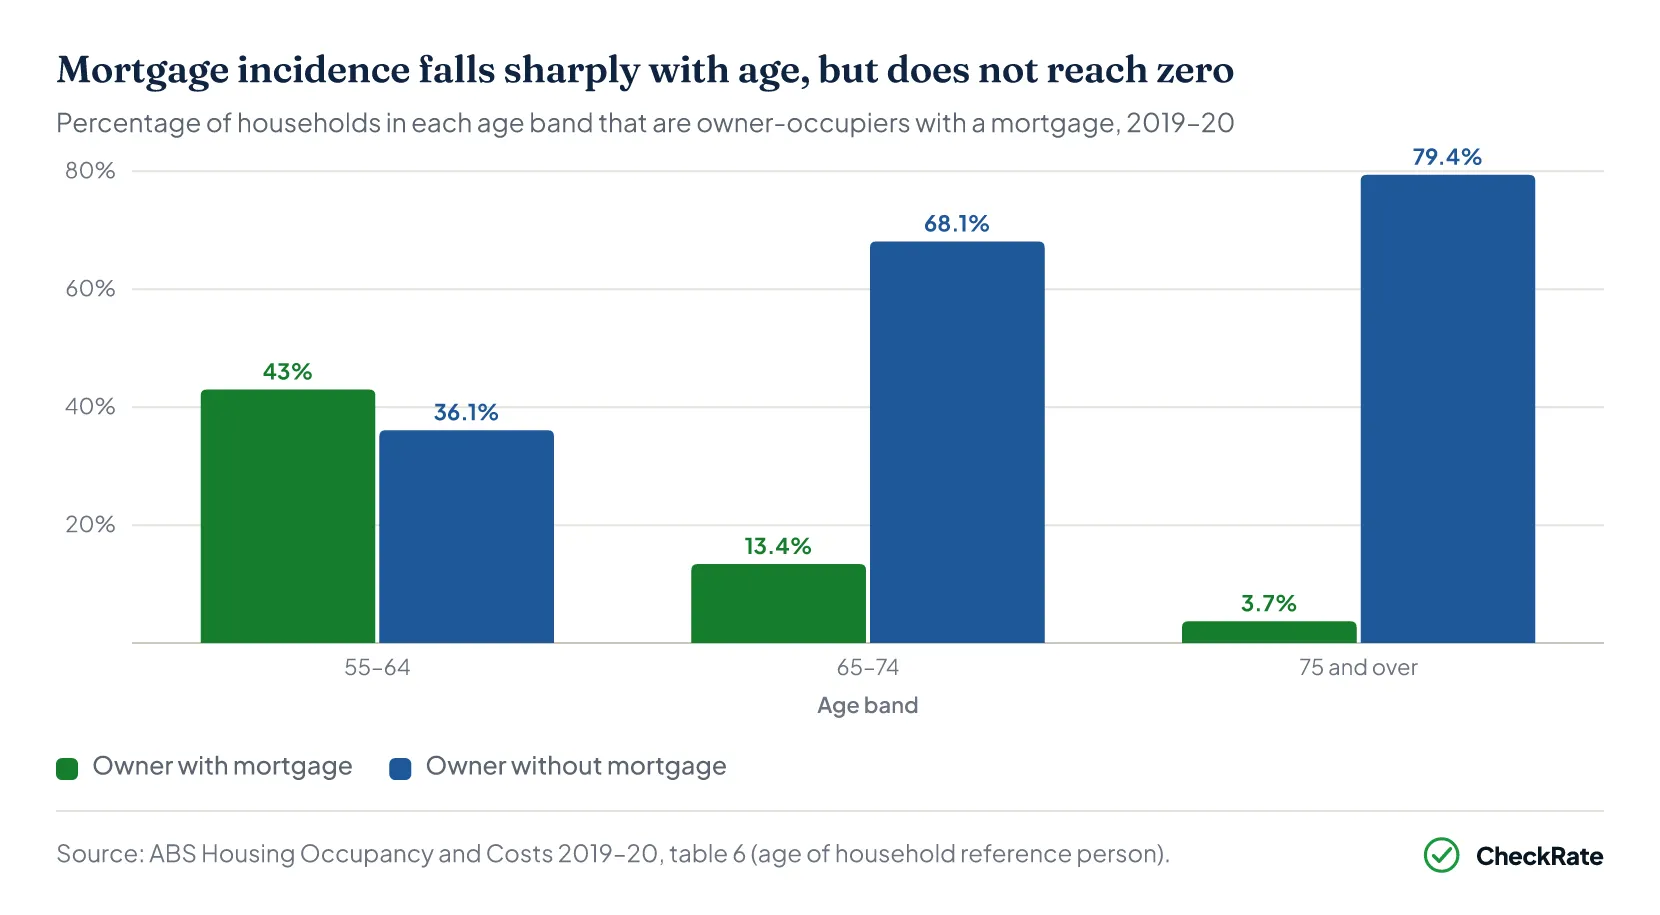
Mortgage debt was most common among households aged 55–64 in 2019–20, when 43% were owner-occupiers with a mortgage. That share fell to 13.4% at ages 65–74 and 3.7% at ages 75 and over. The proportion declines sharply with age, but it does not disappear entirely.
Outright ownership rises across the same age bands. At ages 55–64, 36.1% of households owned without a mortgage. By ages 65–74, that share had risen to 68.1%, and for households aged 75 and over it reached 79.4%. Total home ownership remained high across all three age groups, at 79.1%, 81.7% and 83% respectively.
Most older Australians own outright, but the 55–64 age group still has the highest mortgage exposure among older age groups. This makes the pre-retirement decade an important part of the mortgage debt story.
The longer-run trend also shows a decline in outright ownership among older households. The share of households aged 65 and over owning outright fell from 79% in 2003–04 to 74% in 2017–18, a five-percentage-point decline over 14 years. Among older couple households in 2017–18, 11% still carried a mortgage, compared with 6% of older lone-person households.
| Mortgage debt by age group, Australia, 2019–20 | ||||
|---|---|---|---|---|
| Age band | Owner with mortgage (%) | Owner without mortgage (%) | Total home ownership (%) | Mortgaged households (count) |
| 55–64 | 43.0% | 36.1% | 79.1% | 743,100 |
| 65–74 | 13.4% | 68.1% | 81.7% | 188,600 |
| 75 and over | 3.7% | 79.4% | 83.0% | 39,800 |
| 55 and over (total) | — | — | — | 971,500 |
Source · ABS Housing Occupancy and Costs 2019–20, table 6 (age of household reference person).
Section 03 · Retiring with a mortgage
Why are more Australians retiring with mortgage debt?
Home ownership among 50–54-year-olds fell from 80% in 1996 to 72% in 2021, a drop of eight percentage points over 25 years. This means households approaching retirement are entering their later working years with lower ownership rates than earlier generations. Those who buy later may also carry mortgage debt further into later life.
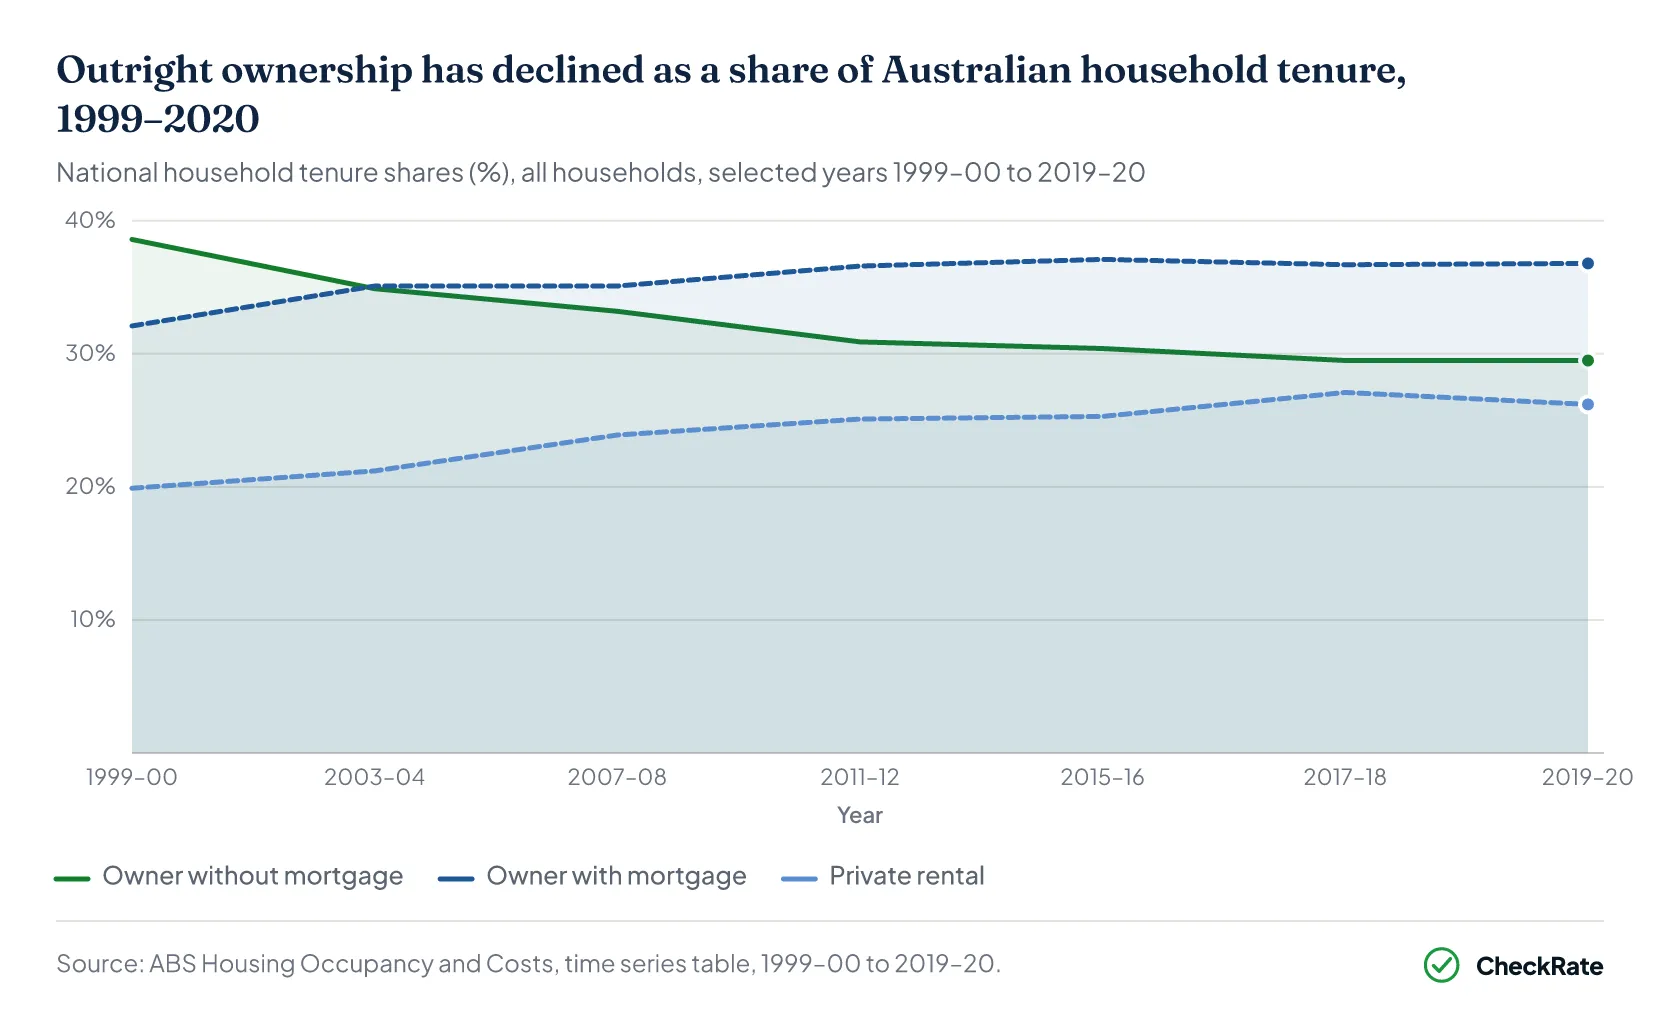
The national picture shows a similar shift. The share of all Australian households owning with a mortgage rose from 32.1% in 1999–00 to 36.8% in 2019–20, while the share owning outright fell from 38.6% to 29.5% over the same period. This shows that outright ownership has declined across the wider population, while mortgaged ownership has become more common.
Later home purchase can extend mortgage debt into older age. A borrower entering the market at 38 rather than 28 with a 25- or 30-year loan term may not clear that loan until their mid-to-late 60s. This example does not claim an average mortgage payoff age, but shows why later entry into home ownership can shift mortgage debt closer to retirement.
Together, lower ownership rates among people approaching retirement and the higher share of mortgaged ownership across all households help explain why more Australians are carrying home loan debt into older age.
Section 04 · Repayments in retirement
Retirees with mortgages face higher weekly housing costs
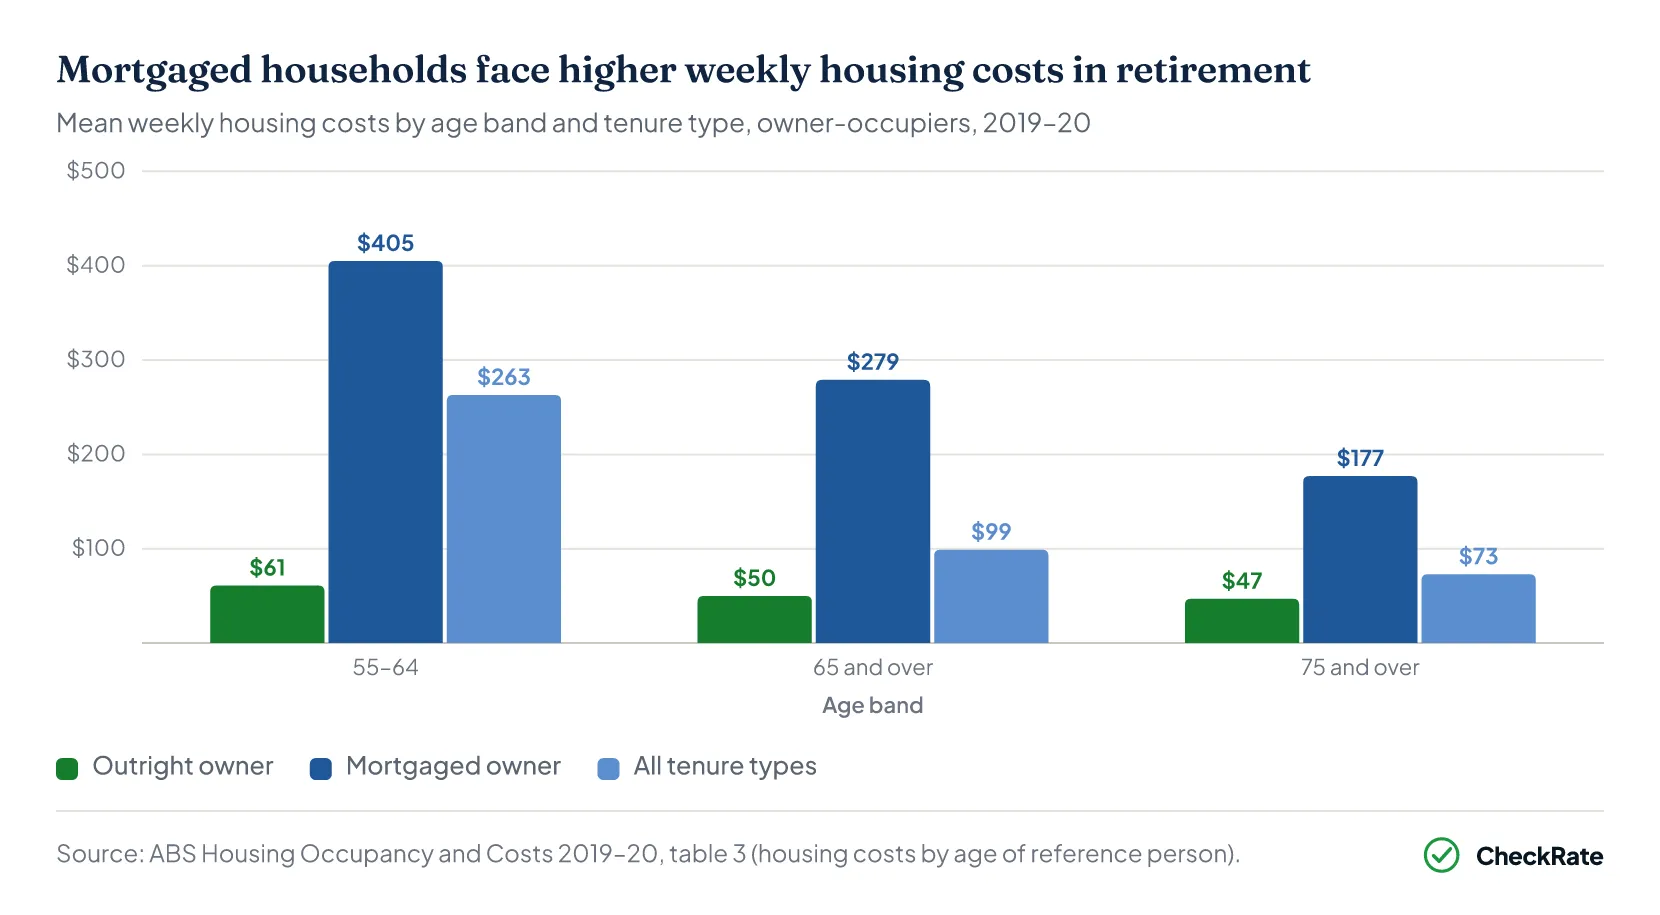
Mortgaged owner-occupiers aged 55–64 had mean weekly housing costs of $405 in 2019–20, compared with $61 for outright owners in the same age group. That created a gap of $344 per week. At ages 65 and over, the gap was $229 per week, with mortgaged owners paying $279 per week compared with $50 for outright owners. At ages 75 and over, the gap narrowed to $130 per week, based on $177 for mortgaged owners and $47 for outright owners.
These figures cover total housing costs, not mortgage repayments alone. They include loan repayments, rates, insurance, maintenance and body corporate fees. The all-tenure averages, at $263, $99 and $73 per week across the three age bands, are lower than the mortgaged-owner figures because they include households that own outright and have much lower weekly housing costs.
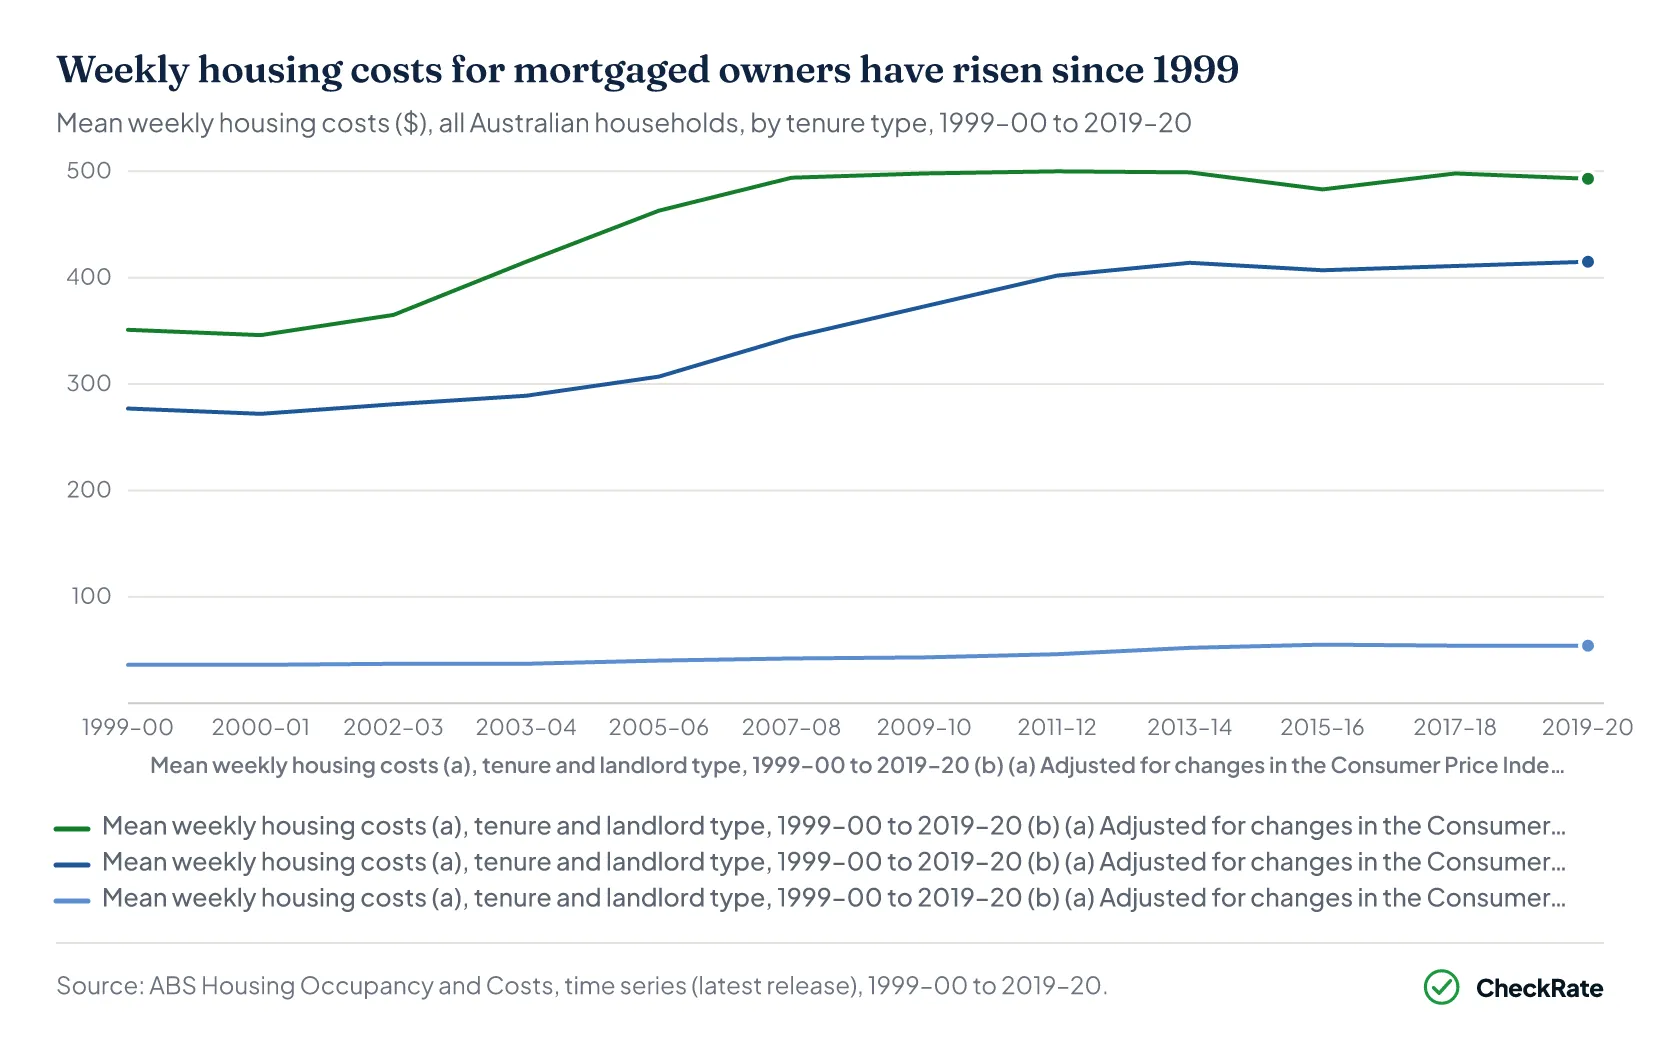
The cost gap has also widened over time. Mean weekly housing costs for mortgaged owners across all Australian households rose from $351 in 1999–00 to $493 in 2019–20. For outright owners, costs rose from $36 to $54 over the same period. The difference between the two groups widened from $315 per week to $439 per week.
The wider long-term gap is also clear in the time series. Mean weekly costs for mortgaged owners peaked at $500 in 2011–12 before easing to $493 in 2019–20. Outright owner costs remained much lower throughout, ending at $54 per week.
Section 05 · Housing costs after 55
How housing costs change after age 55 in Australia
Housing-cost pressure was highest among lower-income households aged 55–64, with 25% spending more than 30% of their gross income on housing costs in 2019–20. That proportion fell to 13% at ages 65–74 and rose slightly to 9% at ages 75 and over. These figures cover lower-income households across tenure types and show how housing-cost pressure changes across older age groups.
The all-tenure averages of $263, $99 and $73 per week for the three age bands do not show the full cost difference for households still carrying a mortgage. Those averages are weighted toward households that own outright and have lower weekly housing costs.
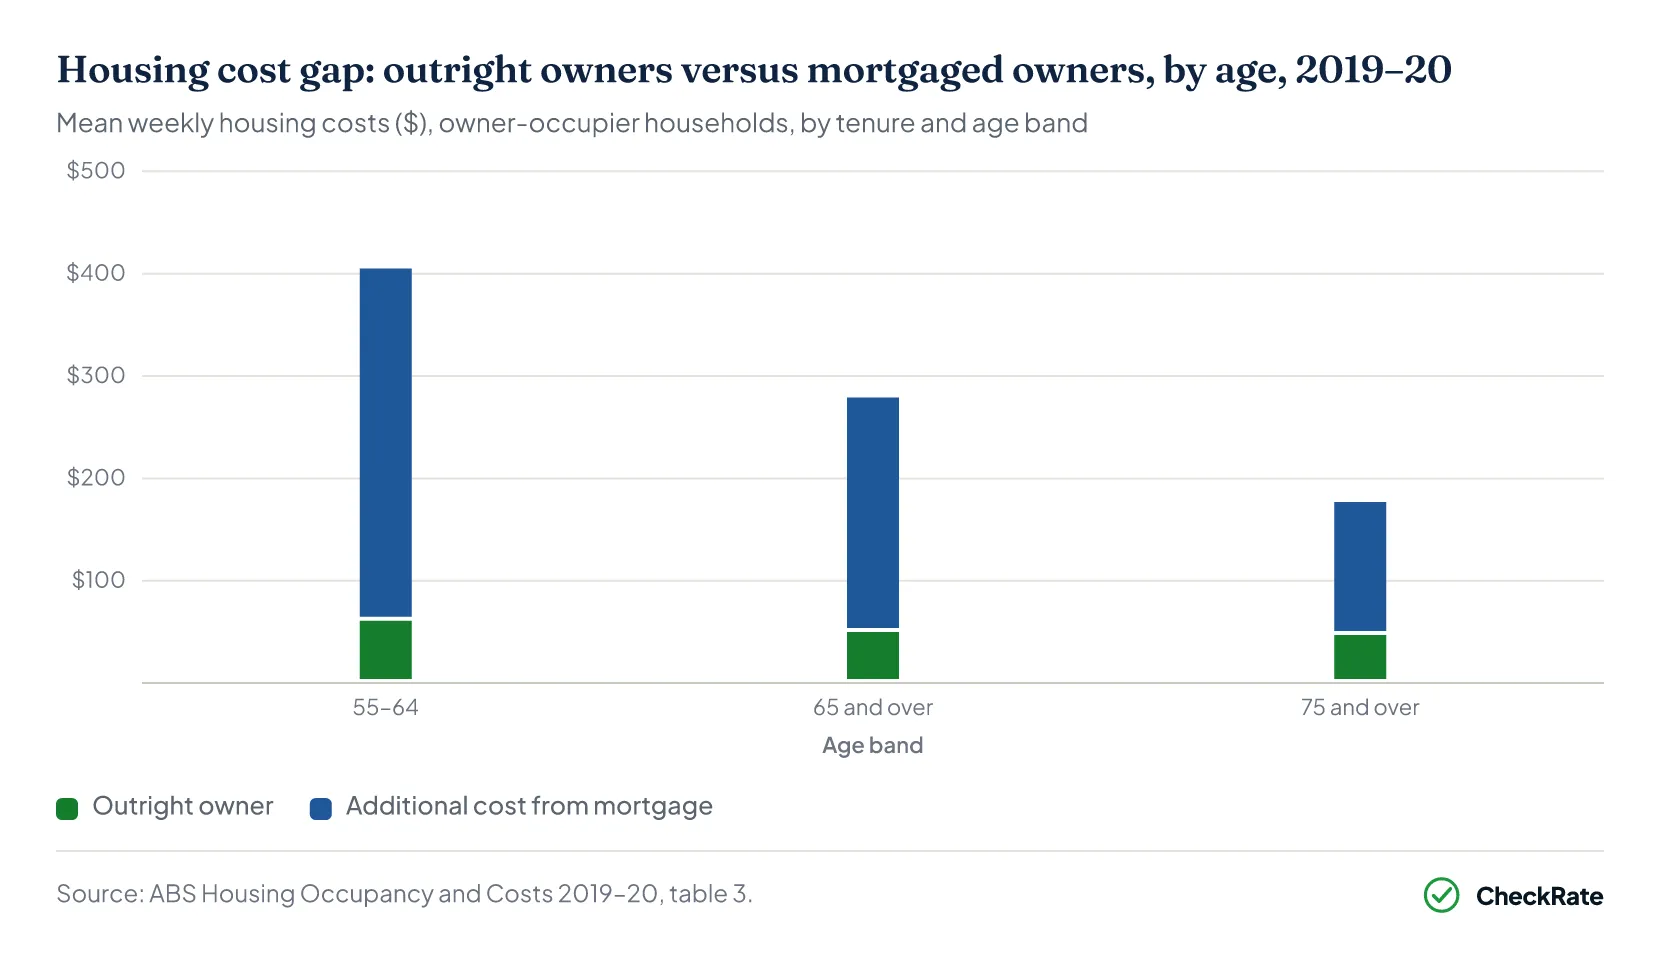
For mortgaged households, the cost gap was $344 per week at ages 55–64, based on $405 for mortgaged owners compared with $61 for outright owners. At ages 65 and over, the gap was $229 per week, based on $279 compared with $50. At ages 75 and over, it narrowed to $130 per week, based on $177 compared with $47.
The gap narrows with age, but it remains visible for older households that still have a mortgage.
Section 06 · Superannuation and mortgage debt
Mortgage debt affects super and pension income in retirement
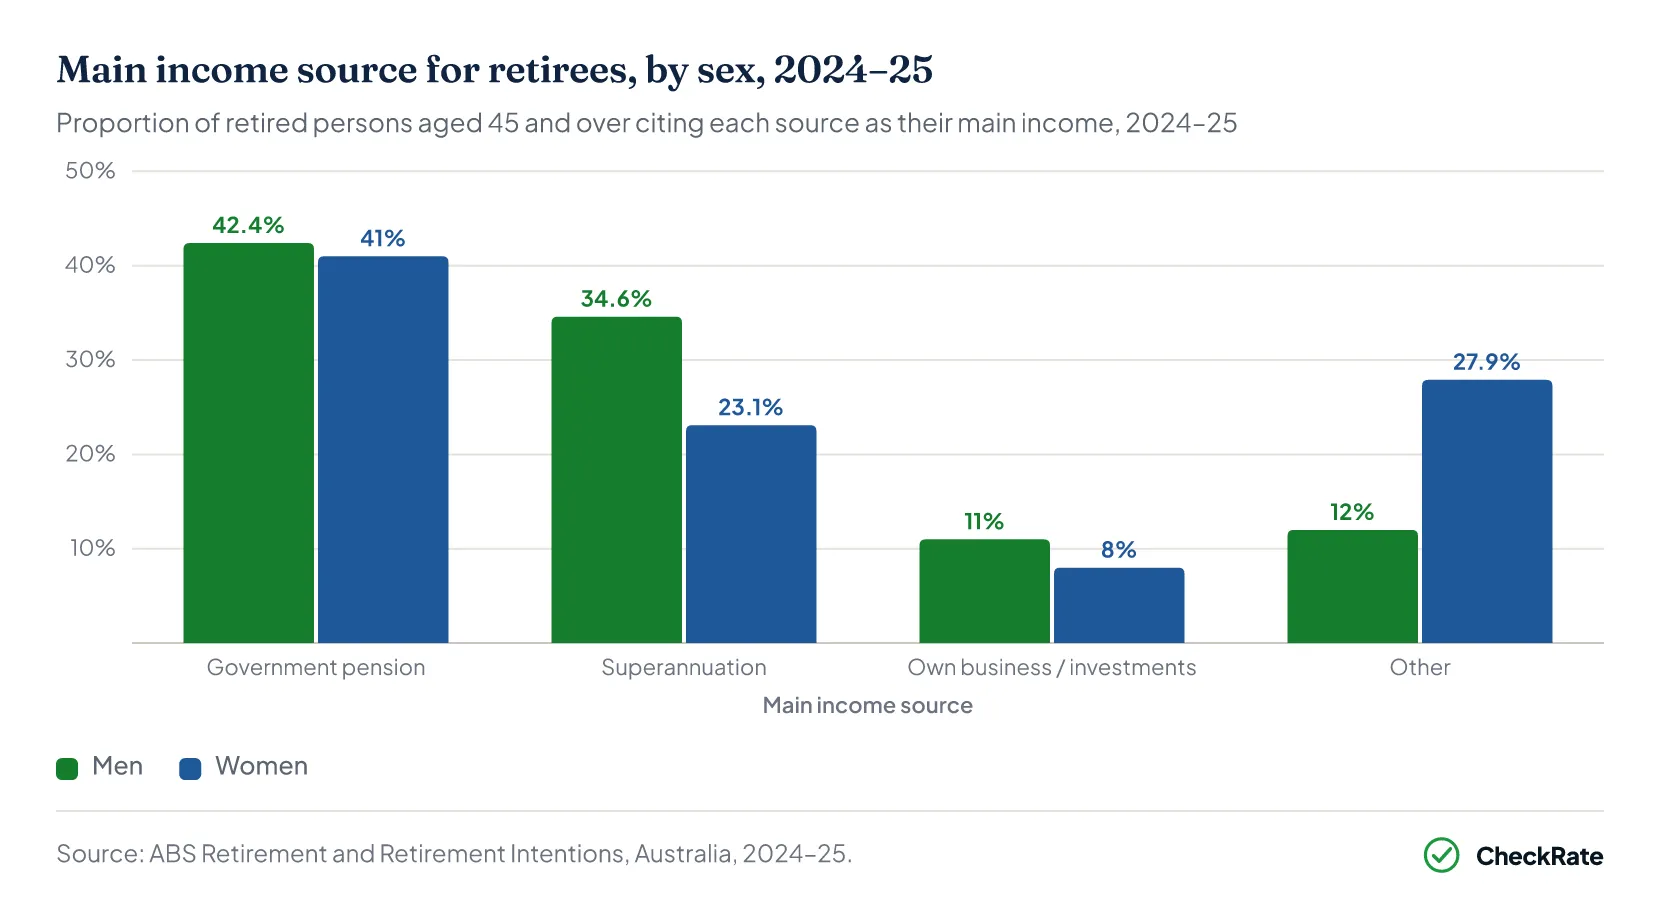
Government pension or allowance was the most common main income source for retirees in 2024–25. It was the primary income source for 42.4% of retired men and 41% of retired women. Superannuation was the main source for 34.6% of retired men and 23.1% of retired women.
The share of retirees relying mainly on superannuation has increased over time, rising from 20% in 2014–15 to 28% in 2024–25. This was an increase of 8 percentage points over a decade.
There were 4.5 million retirees aged 45 and over in 2024–25. People who retired during that year left the workforce at an average age of 63.8 years, while those still working expected to retire at 65.6 years on average.
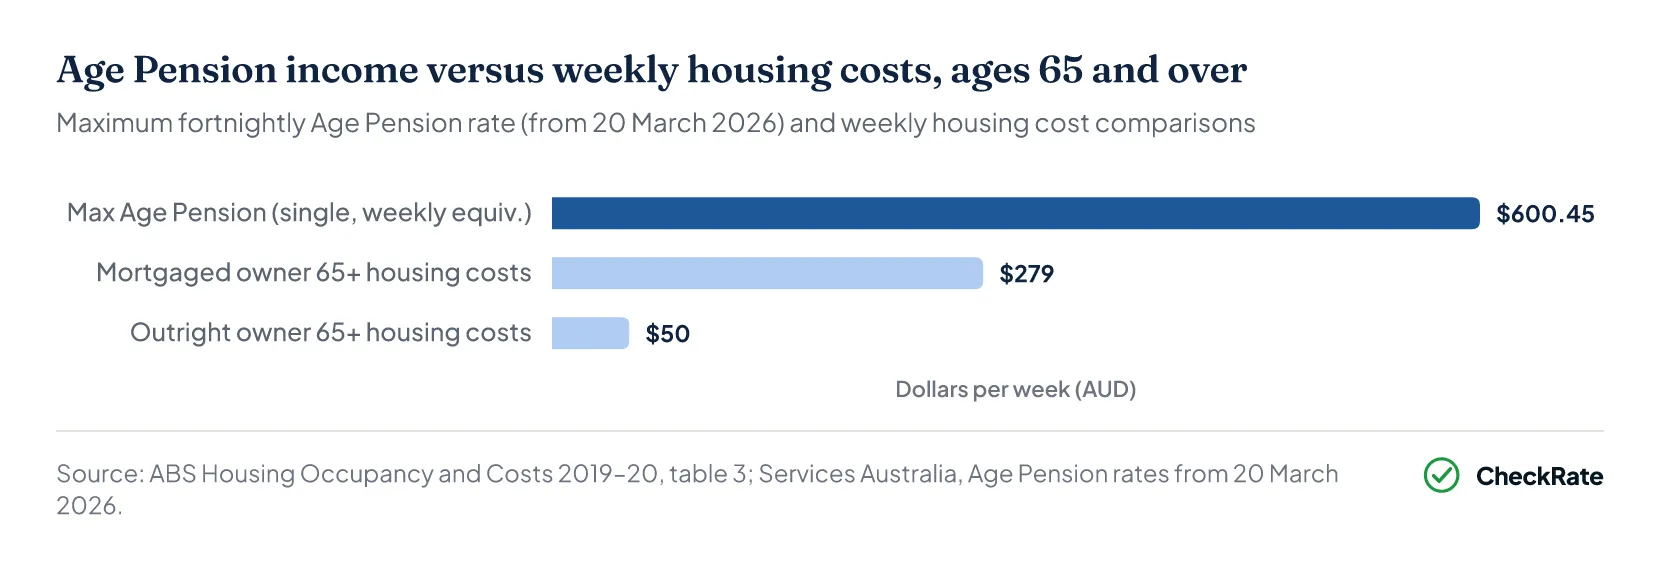
The maximum Age Pension from 20 March 2026 was $1,200.90 per fortnight for a single person and $1,810.40 per fortnight for a couple combined. Mean weekly housing costs for a mortgaged owner aged 65 and over were $279 in 2019–20. That was equivalent to roughly 46% of the weekly equivalent of the maximum single Age Pension.
This is a comparison of scale, not a current household budget model, because the housing-cost and pension-rate figures come from different years. It shows how ongoing mortgage-related housing costs can take up a large share of retirement income where a household still has a home loan.
Total superannuation assets stood at $4.4 trillion as at March 2026, with benefit payments of $143.5 billion over the preceding year. These payments comprised $79.7 billion in lump sums and $63.8 billion in pension payments.
Section 07 · Retirement income
Mortgage costs take up more pension income for older home owners
Mean weekly housing costs for a mortgaged owner aged 65 and over were $279 in 2019–20, compared with $50 for an outright owner in the same age group. Using the maximum single Age Pension from 20 March 2026 as a current income benchmark, those housing costs were equivalent to roughly 46% of the weekly pension amount before other expenses. For an outright owner, the equivalent housing-cost share was around 8%.
The all-tenure average of $99 per week for households aged 65 and over does not show the position of households still carrying a mortgage. That figure blends the majority of households that own outright at lower cost with the smaller group still carrying mortgage debt. Mortgaged owners aged 65 and over had weekly housing costs around 2.8 times the all-tenure average.
Superannuation was the main income source for 23.1% of retired women in 2024–25, compared with 34.6% of retired men. This means retired women were less likely than retired men to report superannuation as their main income source. Where retirement income is lower or more reliant on government pension payments, ongoing mortgage-related housing costs can take up a larger share of income.
Australians born after 30 June 1964 can generally access superannuation from age 60, either as a lump sum or through a transition-to-retirement income stream while still working. Those born earlier have a preservation age between 55 and 59, depending on birth year.
Section 08 · Home equity and retirement income
Home equity rises as retirement income falls
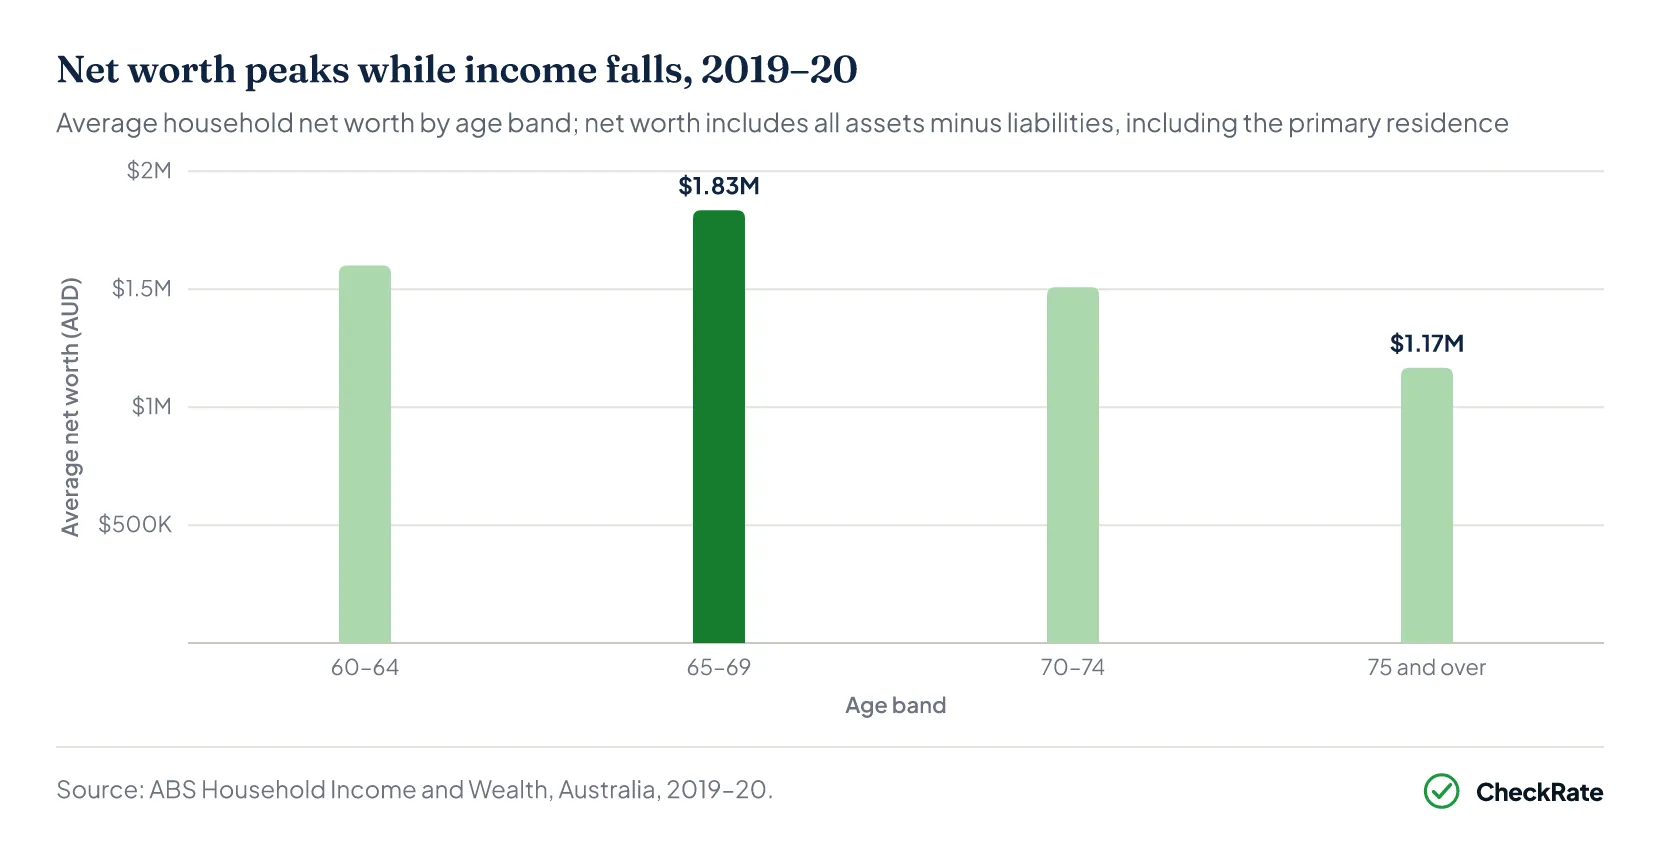
Average household net worth peaked at $1.835 million for households aged 65–69 in 2019–20, the highest of any age group. For households aged 60–64, it was $1.601 million, before falling to $1.509 million at ages 70–74 and $1.167 million at ages 75 and over.
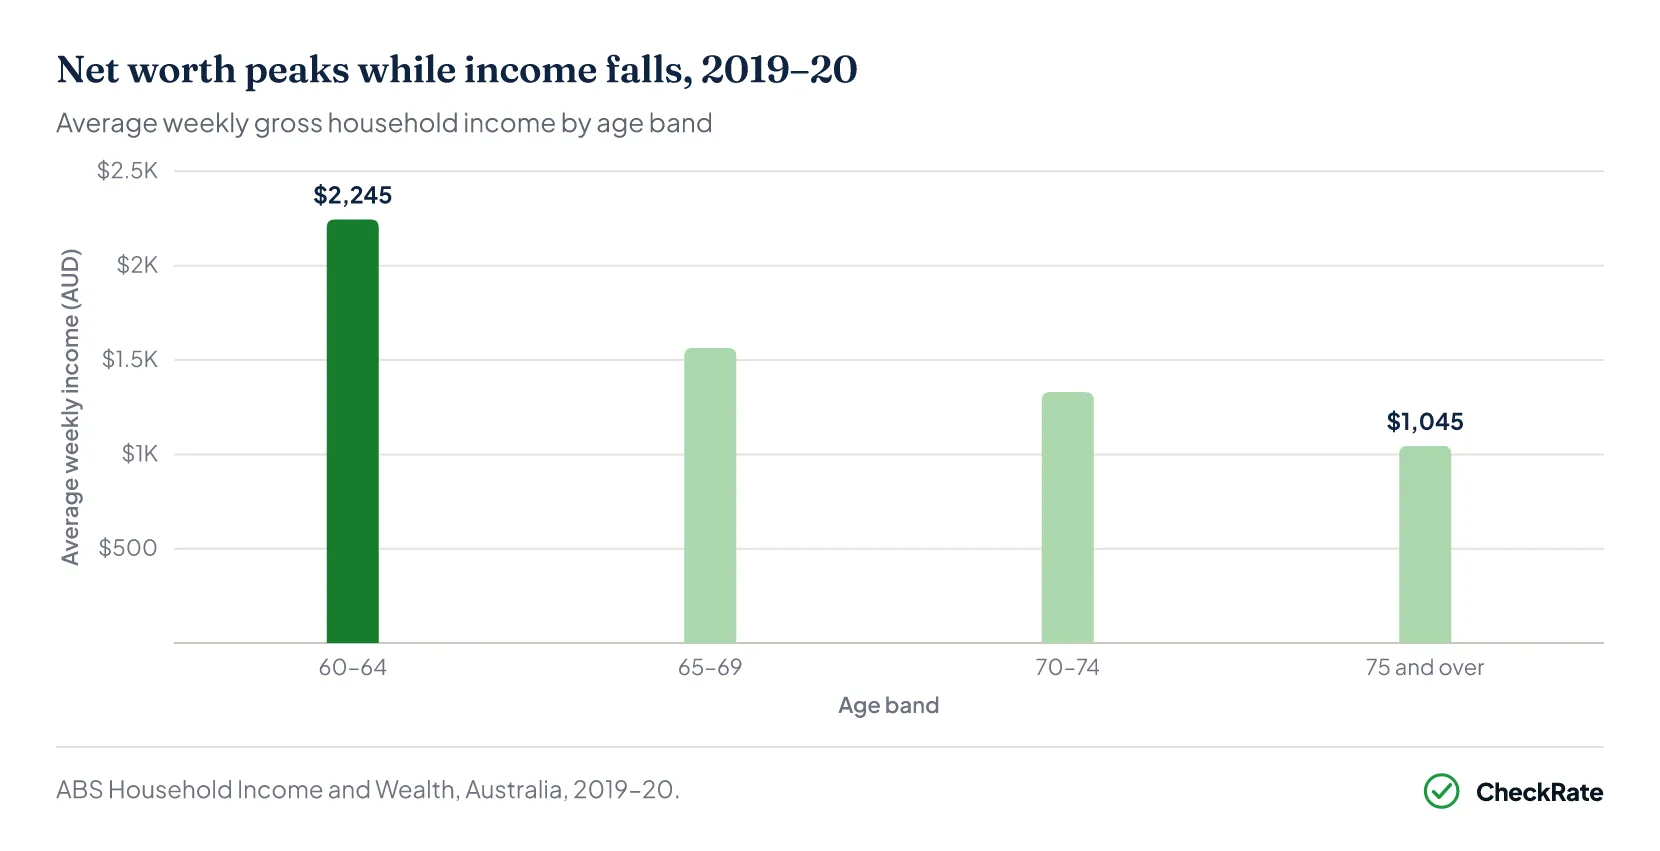
Average weekly gross household income moved in the opposite direction. It was $2,245 per week at ages 60–64, then fell to $1,564 at ages 65–69, $1,330 at ages 70–74 and $1,045 at ages 75 and over.
Housing equity forms the largest component of net worth for many households in these age groups. This creates a gap between household wealth and weekly income, particularly for older home owners with high property wealth but lower retirement income.
The family home is generally exempt from the Age Pension assets test. A household with substantial home equity may still receive a full or partial pension, depending on other assets and income. For a household still carrying a mortgage, the outstanding loan reduces net equity, but the principal home is treated differently from other real estate under the assets test.
Selling a home or drawing against home equity can affect pension eligibility differently from continuing to hold the home. Assets test thresholds and taper rates are published by Services Australia and reviewed periodically.
ABS Household Income and Wealth, Australia, 2019–20.
Section 09 · Reverse mortgages and equity release
Reverse mortgages and home equity release in Australia
Under the Home Equity Access Scheme (HEAS), combined pension and loan payments can reach up to 150% of the maximum pension rate. For a single person on the full Age Pension of $1,200.90 per fortnight, the maximum additional HEAS loan payment is $600.45 per fortnight. The interest rate on HEAS loans is 3.95% per year, compounded fortnightly.
The scheme is available to people of Age Pension age or older who own Australian real estate. It provides a voluntary, non-taxable loan secured against the property. Up to two lump-sum advances are allowed in any 26-fortnight period, with each advance capped at up to 50% of the maximum annual pension rate.
Private reverse mortgages are separate products offered by private lenders. ASIC's Moneysmart guidance states that a person aged 60 can typically borrow around 15 to 20% of their home's value, with the limit increasing by approximately one percentage point for each year over age 60.
Reverse mortgages taken out from 18 September 2012 include negative equity protection. This means the amount owed under the loan cannot exceed the value of the home.
No official source publishes a comprehensive national volume series for private reverse mortgages in Australia. The available official and regulator information focuses on scheme rules, borrowing limits and consumer protections, rather than the scale of private-market activity.
Home Equity Access Scheme (HEAS)
$600.45
Maximum fortnightly loan for single person (from March 2026)
- Available from Age Pension age
- Secured against Australian real estate
- Non-taxable voluntary loan
- Interest rate: 3.95% p.a., compounded fortnightly
- Combined pension + loan capped at 150% of maximum pension
- Up to 2 lump-sum advances per 26-fortnight period
Private reverse mortgage
15–20%
Typical borrowing limit as a share of home value at age 60
- Available through private lenders
- Loan secured against the home
- Borrowing limit generally increases by around 1 percentage point for each year over age 60
- Negative equity protection applies from 18 September 2012
- Borrower cannot owe more than the home is worth
- No comprehensive official national volume series published
What is the Home Equity Access Scheme and who is eligible?
The Home Equity Access Scheme is a voluntary loan scheme for people of Age Pension age or older who own Australian real estate. It is secured against property and can be used by people who receive a qualifying pension, or by some people who do not receive a pension because of income or assets test settings. Combined pension and HEAS loan payments can reach up to 150% of the maximum pension rate. The interest rate is 3.95% per year, compounded fortnightly.
What is negative equity protection on a reverse mortgage?
Negative equity protection applies to reverse mortgages taken out from 18 September 2012. It means the amount owed under the reverse mortgage cannot be more than the value of the home. ASIC's Moneysmart states that the borrower, or their estate, will not have to repay more than the proceeds from the eventual sale of the property.
How much can someone borrow through a reverse mortgage?
ASIC's Moneysmart guidance states that a person aged 60 can typically borrow around 15 to 20% of the value of their home through a private reverse mortgage. As a rough guide, the limit increases by approximately one percentage point for each year over age 60. For example, ASIC's guide indicates that the borrowing range for a 70-year-old may be around 25 to 30% of the home's value, depending on lender settings. Individual lender limits and conditions vary, and the total interest cost over time can reduce the equity available for other purposes.
Section 10 · Downsizing trends
Downsizing trends and super contributions in Australia
Since the downsizer contribution scheme began in 2018–19, 98,500 individuals have contributed $25.255 billion to superannuation from home sale proceeds. That equals an average contribution of approximately $256,400 per person.
In 2024–25, 15,800 individuals made downsizer contributions, with total contributions of $4.165 billion. The average contribution was approximately $263,600 per person. The 2024–25 figures are based on the latest ATO downsizer super contributions data and may be revised as reporting is finalised.
The scheme applies to people aged 55 and over and allows contributions of up to $300,000 per person, or $600,000 per couple, from the sale of an eligible home into superannuation outside the usual contribution caps.
Downsizer contribution data does not capture all downsizing activity. Not everyone who sells a larger home and moves to a smaller property makes a formal downsizer contribution to superannuation.
ATO, Downsizer super contributions data, released September 2025.
References
- ABS Housing Occupancy and Costs, 2019-20 financial year · Australian Bureau of Statistics
- ABS 2021 Census of Population and Housing, All persons QuickStats · Australian Bureau of Statistics
- ABS, Household Income and Wealth, Australia 2024 · Australian Bureau of Statistics
- ABS Retirement and Retirement Intentions, Australia, 2024-25 · Australian Bureau of Statistics
- APRA Quarterly Superannuation Performance Statistics, March 2026 · apra.gov.au
- Services Australia, How much Age Pension you can get (rates from 20 September 2026) · servicesaustralia.gov.au
- Services Australia, Home Equity Access Scheme · servicesaustralia.gov.au
- ASIC Moneysmart, Reverse mortgage and home equity release · moneysmart.gov.au
- ATO, Downsizer super contributions data (released September 2025) · ato.gov.au