


Updated
- +0.25% rise adds
- $117/mo
- On $736,000 national avg · Dec Q 2025
- +0.50% rise adds
- $236/mo
- On $736,000 national avg · Dec Q 2025
- +1.00% rise adds
- $477/mo
- $5,652 per year · Dec Q 2025 avg loan
- National average loan
- $736k
- New owner-occupier · December quarter 2025
 Average mortgage repayment in Australia: what homeowners pay each monthThe repayment for a new owner-occupier loan in Australia is around $4,006 a month, or $924 a week, based on a 30-year principal-and-interest term. The estimate uses the average 2025 loan size of $693,…
 Australian mortgage statistics 2026Australia had about 9.3 million occupied private dwellings at the 2021 Census. Of these, around 3.24 million (35.0%) were owned with a mortgage, 2.87 million (31.0%) were owned outright, and 2.84 mill…
 Mortgage stress in Australia: how many households are affected? (2026)Mortgage stress is a term used when housing costs take up a large share of a household's income.
Section 01 · Average repayment
What does the average Australian mortgage cost?
The average new owner-occupier mortgage in Australia costs about $4,253 a month in scheduled repayments, based on the December quarter 2025 national average loan size of $736,000, an interest rate of 5.66%, and a 30-year principal-and-interest term. In weekly terms, that works out to $981. Over a full year, it equals $51,039.
Even after adjusting for inflation, repayments are materially higher. In real terms, the annual cost of the 2025 average loan is $49,524 in Q1 2026 dollars, up from $30,612 in 2019, a 62% real increase. The nominal figure rose by more than 100%, but that measure also captures the effect of rising prices across the economy. Both measures show that repayments on the average new loan are much higher than they were six years earlier.
| Average yearly mortgage repayment in Australia, 2019 to 2025 | ||||||
|---|---|---|---|---|---|---|
| Year | Avg loan | Rate | Monthly | Yearly | Monthly (real) | Yearly (real) |
| 2019 | $456,000 | 3.33% | $2,005 | $24,060 | $2,551 | $30,612 |
| 2020 | $495,000 | 2.74% | $2,019 | $24,228 | $2,546 | $30,552 |
| 2021 | $552,000 | 2.36% | $2,140 | $25,680 | $2,625 | $31,500 |
| 2022 | $603,000 | 3.46% | $2,693 | $32,316 | $3,098 | $37,176 |
| 2023 | $594,000 | 5.70% | $3,449 | $41,388 | $3,757 | $45,084 |
| 2024 | $638,000 | 6.20% | $3,906 | $46,872 | $4,124 | $49,488 |
| 2025 | $693,000 | 5.69% | $4,019 | $48,228 | $4,127 | $49,524 |
Source · ABS Lending Indicators; RBA Lenders' Interest Rates (F6); ABS Consumer Price Index
The largest increase occurred between 2021 and 2023, when the annual repayment rose from $25,680 to $41,388. That reflects the combined effect of larger average loan sizes and higher interest rates over the period. By 2024, the annual repayment had climbed to $46,872, before easing slightly in rate terms in 2025 while average loan sizes continued to rise.
Section 02 · How it works
How interest rate rises affect mortgage repayments
The RBA cash rate influences borrowing costs
The Reserve Bank of Australia (RBA) sets the cash rate, which is the official interest rate that influences borrowing costs across the economy. When the cash rate rises, borrowing can become more expensive across the financial system, including for banks, lenders and mortgage holders.
Variable home loan rates can rise after RBA decisions
After an RBA cash rate increase, banks and lenders may raise variable home loan rates. In Australia, many mortgage holders have variable-rate loans, so cash rate changes can flow through to scheduled repayments more quickly than for fixed-rate loans.
Higher rates increase scheduled monthly repayments
Most home loans are structured so the debt is repaid over a set loan term, often 30 years. When the interest rate rises, and the loan term stays the same, a higher repayment is needed to keep the loan on schedule.
Larger loans have larger dollar increases
The same rate rise has a larger dollar impact on a larger loan balance. A 0.25 percentage point rise on a $900,000 loan adds more per month than the same rise on a $500,000 loan, even though the percentage-point change is identical. The rate move is the same, but the loan balance determines the dollar impact.
Fixed-rate loans do not usually change immediately
Fixed-rate home loan repayments do not usually change when the RBA moves the cash rate. However, when a fixed-rate term ends and the loan moves to a variable rate, the repayment may change based on the rate available at that time. Many borrowers who fixed at low rates in 2020 and 2021 moved onto higher rates when those fixed terms ended in 2023 and 2024.
All repayment figures in this article show the immediate change in scheduled monthly repayments if the new rate is applied for the remaining loan term. The calculations use a standard 30-year principal-and-interest schedule and exclude offset balances, redraw facilities and lender-specific policies.
Section 03 · Rate-rise size
Mortgage repayment increases by rate-rise size
A larger rate rise creates a larger monthly repayment increase, but the dollar impact also depends on the size of the loan. On the December quarter 2025 national average new owner-occupier loan of $736,000, a 0.25 percentage point rise adds $117 a month, a 0.50 point rise adds $236, and a 1 percentage point rise adds $477.
That $109 is 73% more than the $63 a quarter-point rise would have added in 2019, when the average loan was $456,000. The rate move itself is identical. The difference comes almost entirely from higher loan sizes over that period.
The gap between states is significant. In NSW, the same 0.25 percentage point rise adds $137 a month on an average new loan of $873,000. In Tasmania, where the average new loan is $504,000, it adds $79 a month. That $58 difference comes down to loan size alone.
Section 04 · 0.50% rise
What a 0.50% rate rise adds to repayments
In NSW, the same 0.50 percentage point rise adds $3,312 a year on the average new loan of $873,000. That is $684 more per year than the national figure of $2,628, because of the difference in average loan size.
A half-point rise is equivalent to two standard RBA moves in succession, or a single 50 basis point increase, as the RBA did in June 2022. The impact is not exactly double the 0.25-point figure, since interest compounds slightly as the rate rises. In practice, doubling the 0.25-point figure gives a close approximation.
Section 05 · 1% rise
What a 1% rate rise adds to repayments
On a $1 million loan, a full percentage point rise adds $641 a month, or $7,692 over the year. The rate move is identical, but the larger loan balance pushes the dollar cost 44% higher than on the national average. Between May 2022 and November 2023, the RBA raised the cash rate from 0.10% to 4.35%, a total increase of 4.25 percentage points. As a sensitivity estimate, applying that full increase to the 2022 average loan of $603,000 would add around $1,480 a month if all rises took effect at once.
Section 06 · By loan size
How loan size changes the cost of a mortgage rate rise
The dollar impact of a rate rise increases with the loan balance. Each additional $100,000 of principal adds roughly $16 to the monthly cost of a 0.25 percentage point rise, $32 for a 0.50 point rise, and $64 for a full percentage point. A $1.5 million loan has more than five times the monthly increase of a $300,000 loan from the same rate move.
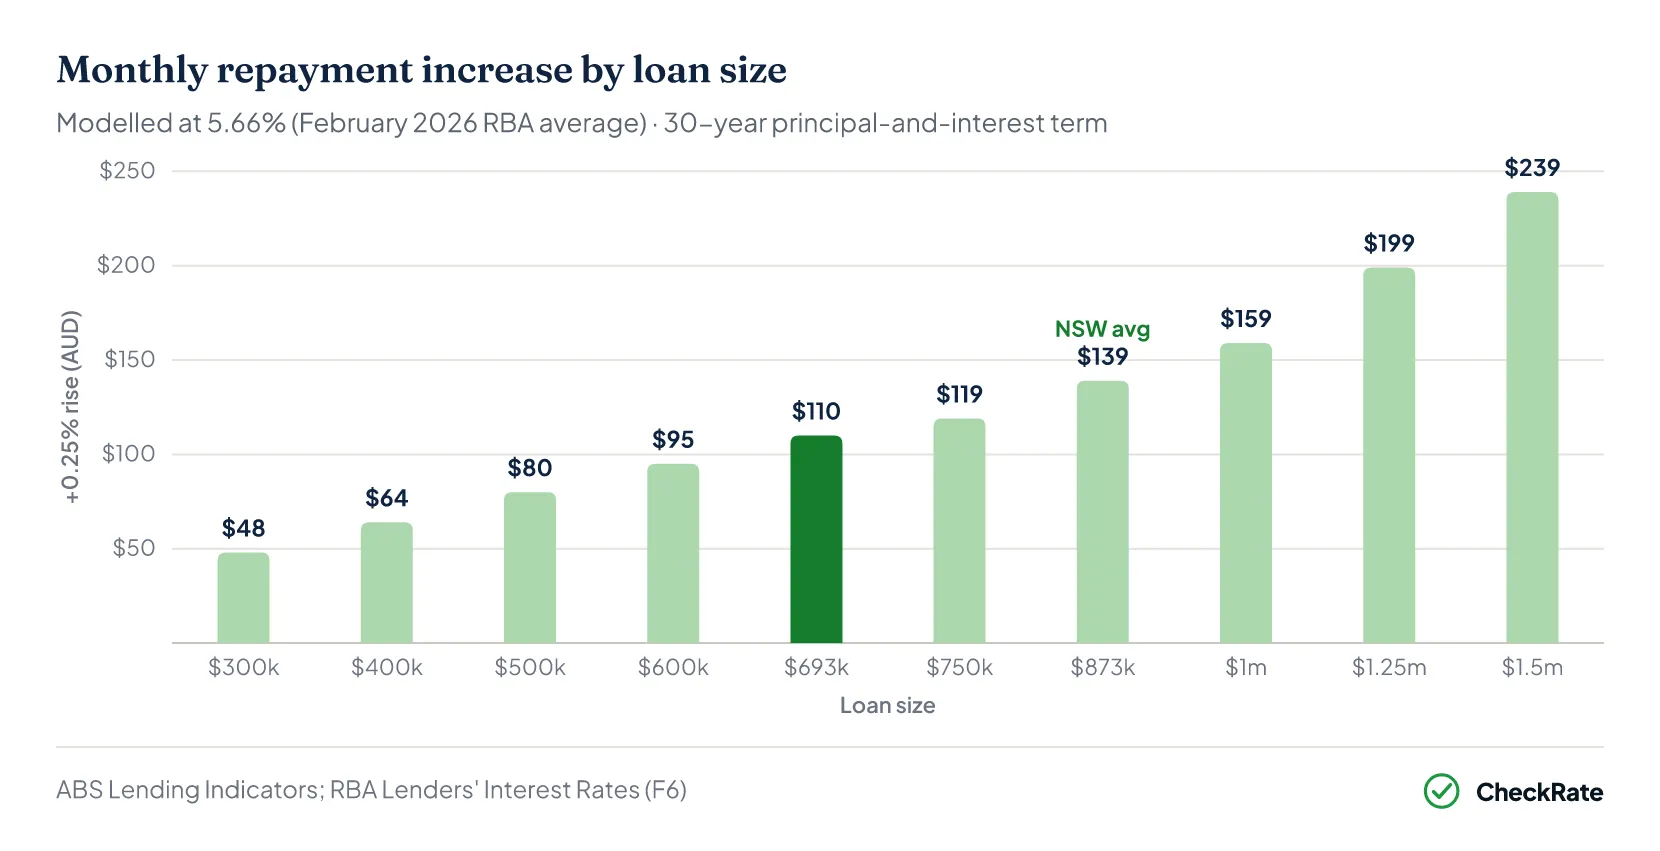
| Monthly repayment increase by loan size after a rate rise | ||||
|---|---|---|---|---|
| Loan size | Monthly repayment | +0.25% | +0.50% | +1.00% |
| $300,000 | $1,734 | +A$48 | +$96 | +$194 |
| $400,000 | $2,311 | +$64 | +$128 | +$259 |
| $500,000 | $2,889 | +$80 | +$160 | +$324 |
| $600,000 | $3,467 | +$95 | +$192 | +$389 |
| $693,000 (2025 avg) | $4,006 | +$110 | +$222 | +$449 |
| $750,000 | $4,334 | +$119 | +$240 | +$486 |
| $873,000 (NSW avg) | $5,045 | +$139 | +$279 | +$565 |
| $1,000,000 | $5,779 | +$159 | +$320 | +$648 |
| $1,250,000 | $7,223 | +$199 | +$400 | +$809 |
| $1,500,000 | $8,668 | +$239 | +$480 | +$971 |
Source · ABS Lending Indicators; RBA Lenders' Interest Rates (F6)
The relationship is close to linear. A $300,000 loan adds $47 a month from a 0.25 percentage point rise. A $600,000 loan adds $94, and a $1.5 million loan adds $236. The loan balance is the main driver of the dollar increase.
Section 07 · By state
How mortgage rate-rise costs differ by state
Rate rises have different dollar impacts across Australia because average new loan sizes vary widely by state.
- NSW has the highest average new owner-occupier loan in the country at $873,000. A 0.25 percentage point rise adds $137 a month, the largest dollar impact of any state.
- Queensland recorded the strongest annual loan growth at 15.9%, followed by Western Australia at 14.9% and South Australia at 13.6%. Higher average loan sizes increase the dollar impact of future rate changes.
- Tasmania has the smallest average new loan at $504,000, and the lowest dollar impact from each rate-rise scenario nationally.
The table below shows each state's average loan, year-on-year change, current monthly repayment, and the increase from three rate rise scenarios.
| Monthly repayment increase by state after a rate rise | ||||||
|---|---|---|---|---|---|---|
| State | Average new loan | YoY change | Monthly repayment | +0.25% | +0.50% | +1.00% |
| NSW | $873,000 | +7.8% | $5,045 | +$139 | +$279 | +$565 |
| QLD | $736,000 | +15.9% | $4,253 | +$117 | +$236 | +$477 |
| WA | $688,000 | +14.9% | $3,976 | +$109 | +$220 | +$446 |
| VIC | $677,000 | +7.1% | $3,912 | +$108 | +$217 | +$438 |
| ACT | $659,000 | +1.4% | $3,808 | +$105 | +$211 | +$427 |
| SA | $658,000 | +13.6% | $3,802 | +$105 | +$211 | +$426 |
| NT | $515,000 | +10.8% | $2,976 | +$82 | +$165 | +$334 |
| TAS | $504,000 | +6.3% | $2,913 | +$80 | +$161 | +$326 |
| Australia | $736,000 | +10.5% | $4,253 | +$117 | +$236 | +$471 |
Source · ABS Lending Indicators; RBA Lenders' Interest Rates (F6)
The ACT and SA have nearly identical average loans, at $659,000 and $658,000 respectively, so the repayment impact is almost the same across all three scenarios. The gap between NSW ($873,000) and Tasmania ($504,000) is $369,000, which translates to a $58 monthly difference from a 0.25 percentage point rise and a $236 difference from a 1 percentage point rise.
Section 08 · First-home buyers
How rate rises affect first-home buyers
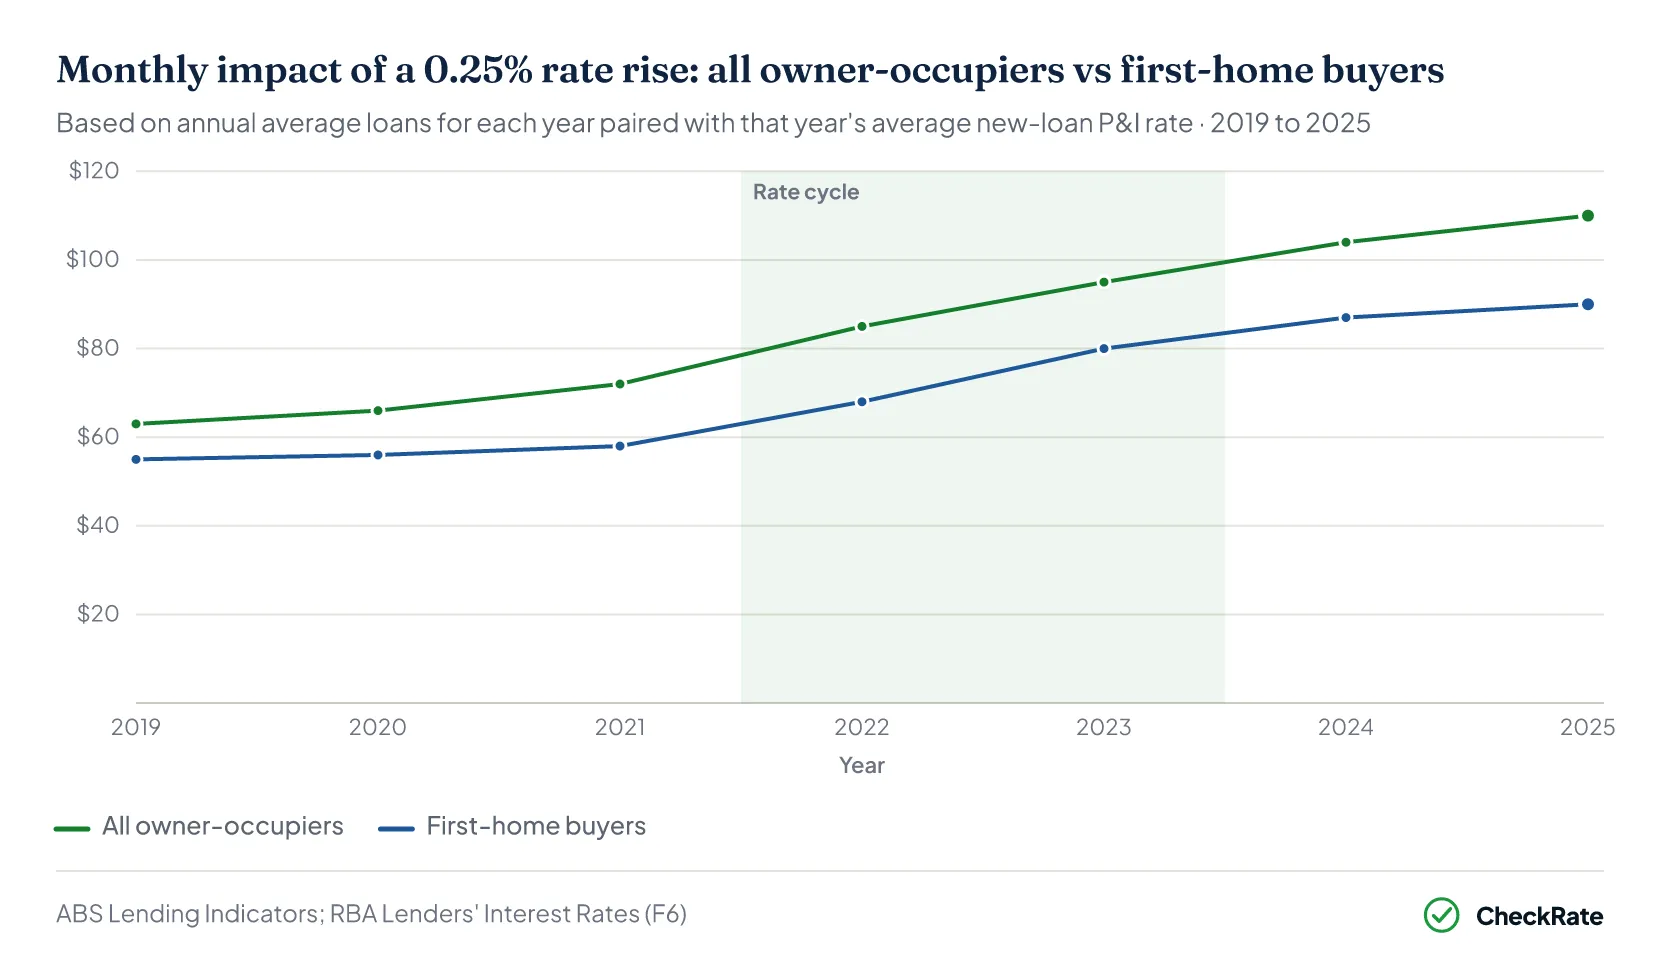
First-home buyer sensitivity to rate rises has grown substantially. In 2019, a 0.25 percentage point rise added $55 a month to the typical first-home buyer repayment. By 2025, the same rise added $90, a 64% increase over six years. The increase reflects larger average first-home buyer loans, with interest rate movements adding a separate layer to repayment sensitivity.
The chart below compares the monthly impact of a 0.25 percentage point rise for first-home buyers and all owner-occupiers from 2019 to 2025. In 2019, the difference between the two groups was about $8 a month. By 2025, it had grown to around $20, as average owner-occupier loan sizes increased faster than average first-home buyer loans over the period.
Section 09 · Since 2019
Mortgage repayment sensitivity has increased since 2019
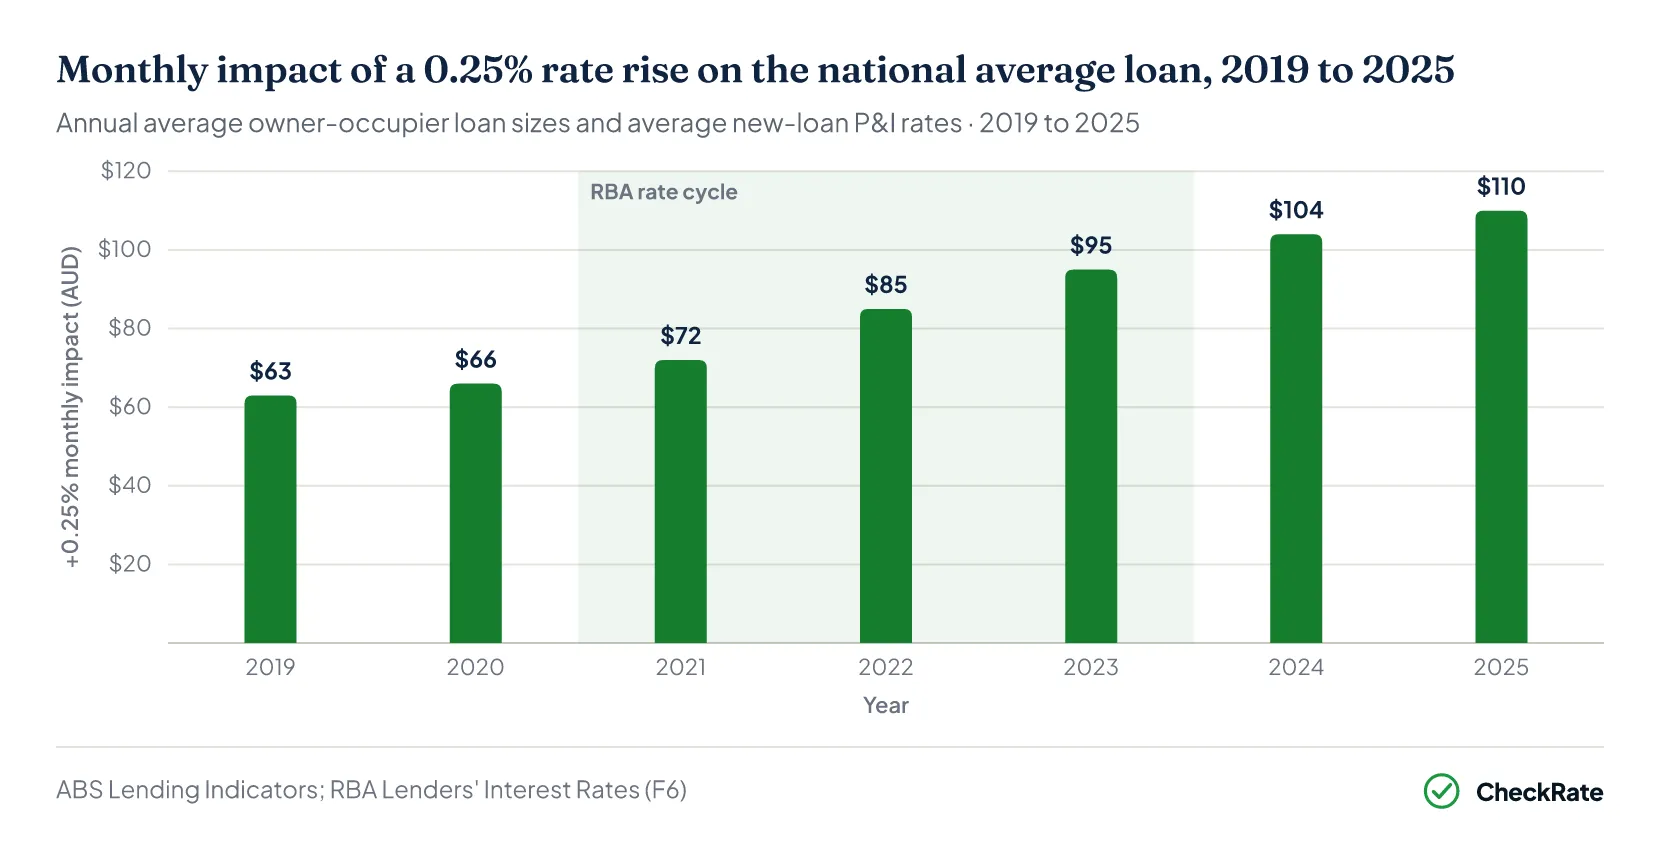
A 0.25 percentage point rate rise now adds $117 a month on the December quarter 2025 average loan of $736,000, up 84% from the $63 it would have added in 2019 on the then-average loan of $456,000. The rate move is the same, but the dollar impact is higher because average loan balances have increased. Using the 2025 calendar-year average loan of $693,000, the same rise adds $110, slightly less than the December quarter figure because the calendar-year average is lower than the December quarter snapshot.
Between May 2022 and November 2023, the RBA raised the cash rate by 4.25 percentage points in total. On the 2022 average loan of $603,000, that cumulative increase would have added around $1,480 a month to repayments if all rises had taken immediate effect. This is a sensitivity estimate, not the actual month-by-month repayment path for borrowers.
The chart below shows how the monthly impact of a hypothetical 0.25 percentage point rise changed each year from 2019 to 2025. The bars increase over time even in years when average rates were lower, because average loan sizes were still rising.
Section 10 · Calculator
Mortgage rate-rise calculator and quick reference
The calculator estimates repayment changes using a loan balance, current interest rate and selected rate-rise scenario. It is based on a standard 30-year principal-and-interest loan and shows the monthly, weekly and yearly repayment increase.
Rate-rise repayment calculator
See what a rate rise adds to your home-loan repayments each month, week and year.
| Quick reference: monthly repayment increase by scenario | |||
|---|---|---|---|
| Rate rise | +0.25% | +0.50% | +1.00% |
| On $500,000 | +$80/mo | +$160/mo | +$324/mo |
| On $693,000 (avg) | +$110/mo | +$222/mo | +$449/mo |
| On $736,000 (Dec Q) | +$117/mo | +$236/mo | +$477/mo |
| On $873,000 (NSW) | +$139/mo | +$279/mo | +$565/mo |
| On $1,000,000 | +$159/mo | +$320/mo | +$648/mo |
References
- ABS Lending Indicators, December quarter 2025 · Australian Bureau of Statistics
- RBA, Lenders' Interest Rates (Statistical Table F6) — housing rates, February 2026 · Reserve Bank of Australia
- ABS, Consumer Price Index, Australia, March 2026 · Australian Bureau of Statistics
- Reserve Bank of Australia — Explainer: What is Monetary Policy? · Reserve Bank of Australia
- RBA Cash Rate Target · Reserve Bank of Australia