


Published
- Repayments on a new mortgage
- 45.9%
- Share of median household income needed in 2025, down from 50% in 2024 (NHSAC)
- Time to save a 20% deposit
- 11.2 yrs
- At median household income in 2025; up from 10.6 years in 2024 (NHSAC)
- National mean dwelling price
- $1.11m
- March quarter 2026, up 11.9% year-on-year (ABS)
- New owner-occupier rate
- 5.92%
- April 2026. With APRA’s 3 percentage point buffer, lenders assess at 8.92% (RBA, APRA)
 How much does it cost to own a home each year in Australia?Owning a home in Australia costs more than the mortgage. On top of the modelled repayment on the average new owner-occupier loan, at $4,369 per month in the March quarter of 2026, homeowners pay counc…
 How much does it cost to buy a house in Australia?Applying a 5% allowance for non-deposit upfront costs to the national median house price of $925,500 adds around $46,275 to the cash required at settlement. On the national mean dwelling price of $1,1…
 Average house deposit Australia 2026: how much do buyers need?The estimated average deposit gap in Australia was about $352,500 at the end of 2025, equal to roughly 32.4% of the average property price. That figure has risen by about 96.7% since 2015.
Section 01 · Property price
How much income is needed to buy a home in Australia by property price?
Property price has the biggest effect on the income needed to buy a home, because a higher purchase price increases both the loan size and the assessed repayment.
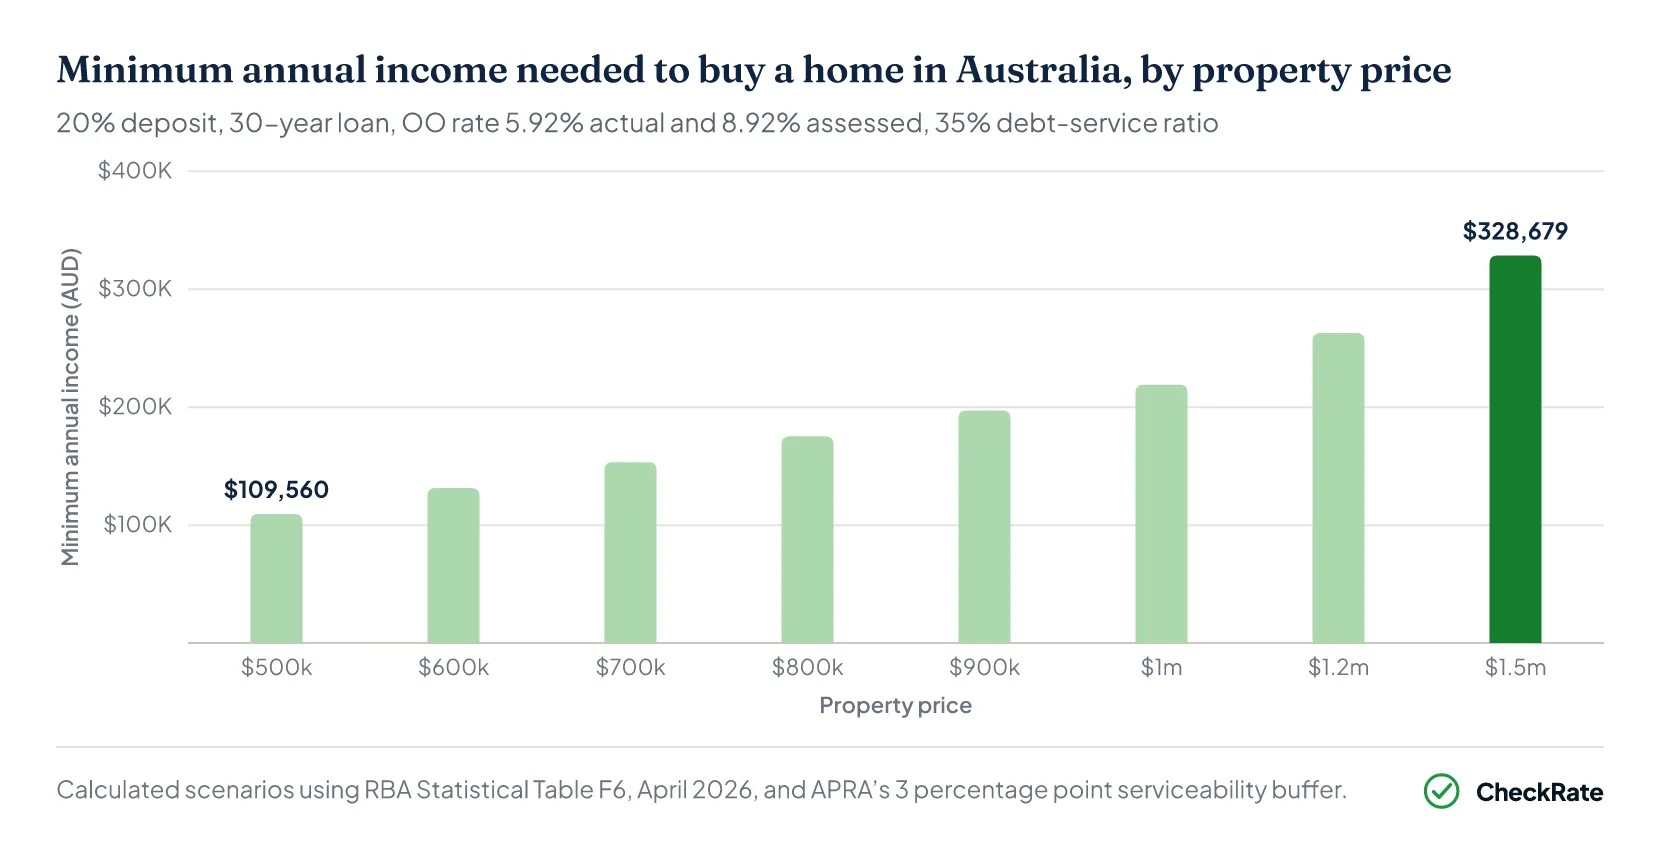
At the national mean dwelling price of $1,111,100 in March 2026, a single borrower would need an estimated minimum gross income of about $243,500 a year under this model, based on a 20% deposit. That is 2.5 times the national median full-time earnings of $98,124 and 2.3 times the mean full-time earnings of $106,657.
Even at a property price of $500,000, the estimated qualifying income is $109,600, which is above the national median full-time salary.
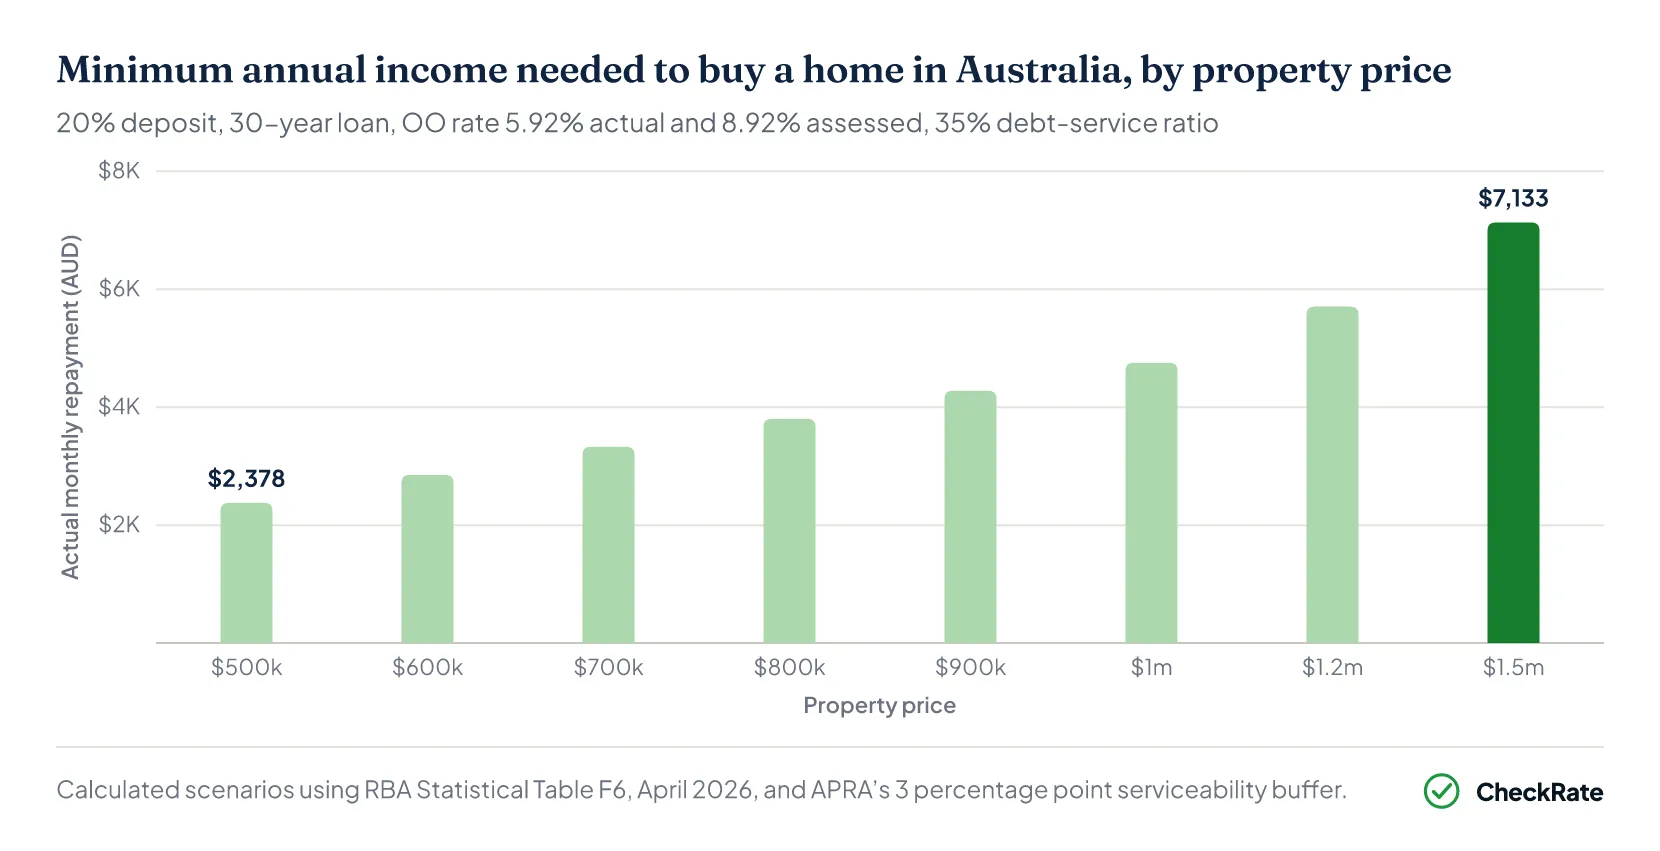
The figures are calculated scenarios using official inputs, including the RBA new owner-occupier principal-and-interest rate of 5.92% in April 2026, APRA’s 3 percentage point serviceability buffer, a 30-year loan term and a 20% deposit. The serviceability buffer gives an assessment rate of 8.92% for owner-occupier loans.
Minimum income is calculated as the gross annual salary at which assessed repayments equal 35% of gross income. These figures are modelled estimates, not official income thresholds or lender approval amounts.
| Minimum income and repayments by property price | ||||
|---|---|---|---|---|
| Property price | Loan (20% dep) | Actual monthly repayment | Assessed monthly repayment | Min annual income |
| $500,000 | $400,000 | $2,378 | $3,195 | $109,600 |
| $600,000 | $480,000 | $2,853 | $3,835 | $131,500 |
| $700,000 | $560,000 | $3,329 | $4,474 | $153,400 |
| $800,000 | $640,000 | $3,804 | $5,113 | $175,300 |
| $900,000 | $720,000 | $4,280 | $5,752 | $197,200 |
| $1,000,000 | $800,000 | $4,755 | $6,391 | $219,100 |
| $1,200,000 | $960,000 | $5,706 | $7,669 | $263,000 |
| $1,500,000 | $1,200,000 | $7,133 | $9,586 | $328,700 |
Source · RBA Statistical Table F6, April 2026; APRA macroprudential settings update, May 2026.
These figures are modelled income estimates, not a guarantee of loan approval. Lenders also assess living expenses, existing debt, credit history, income stability and other borrower circumstances. A borrower with large credit card limits or personal loan debt may have lower borrowing capacity than the modelled figure suggests.
Section 02 · By city and state
How much income is needed to buy a home in Australian capital cities?
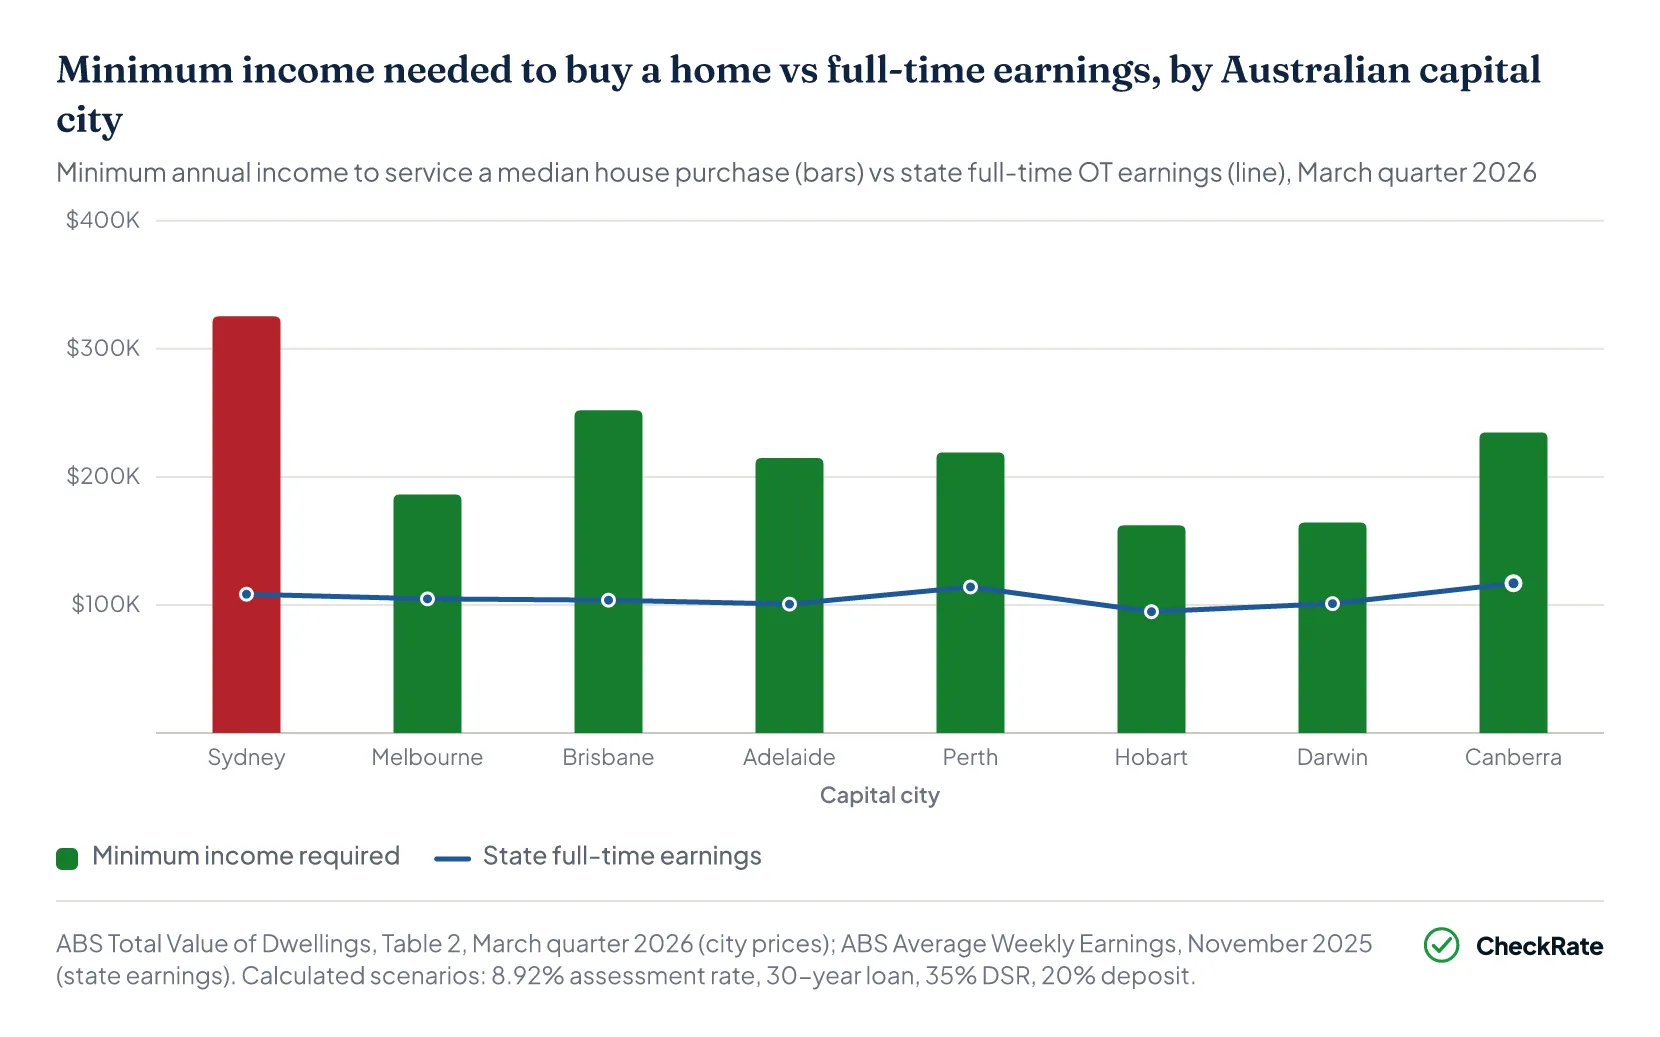
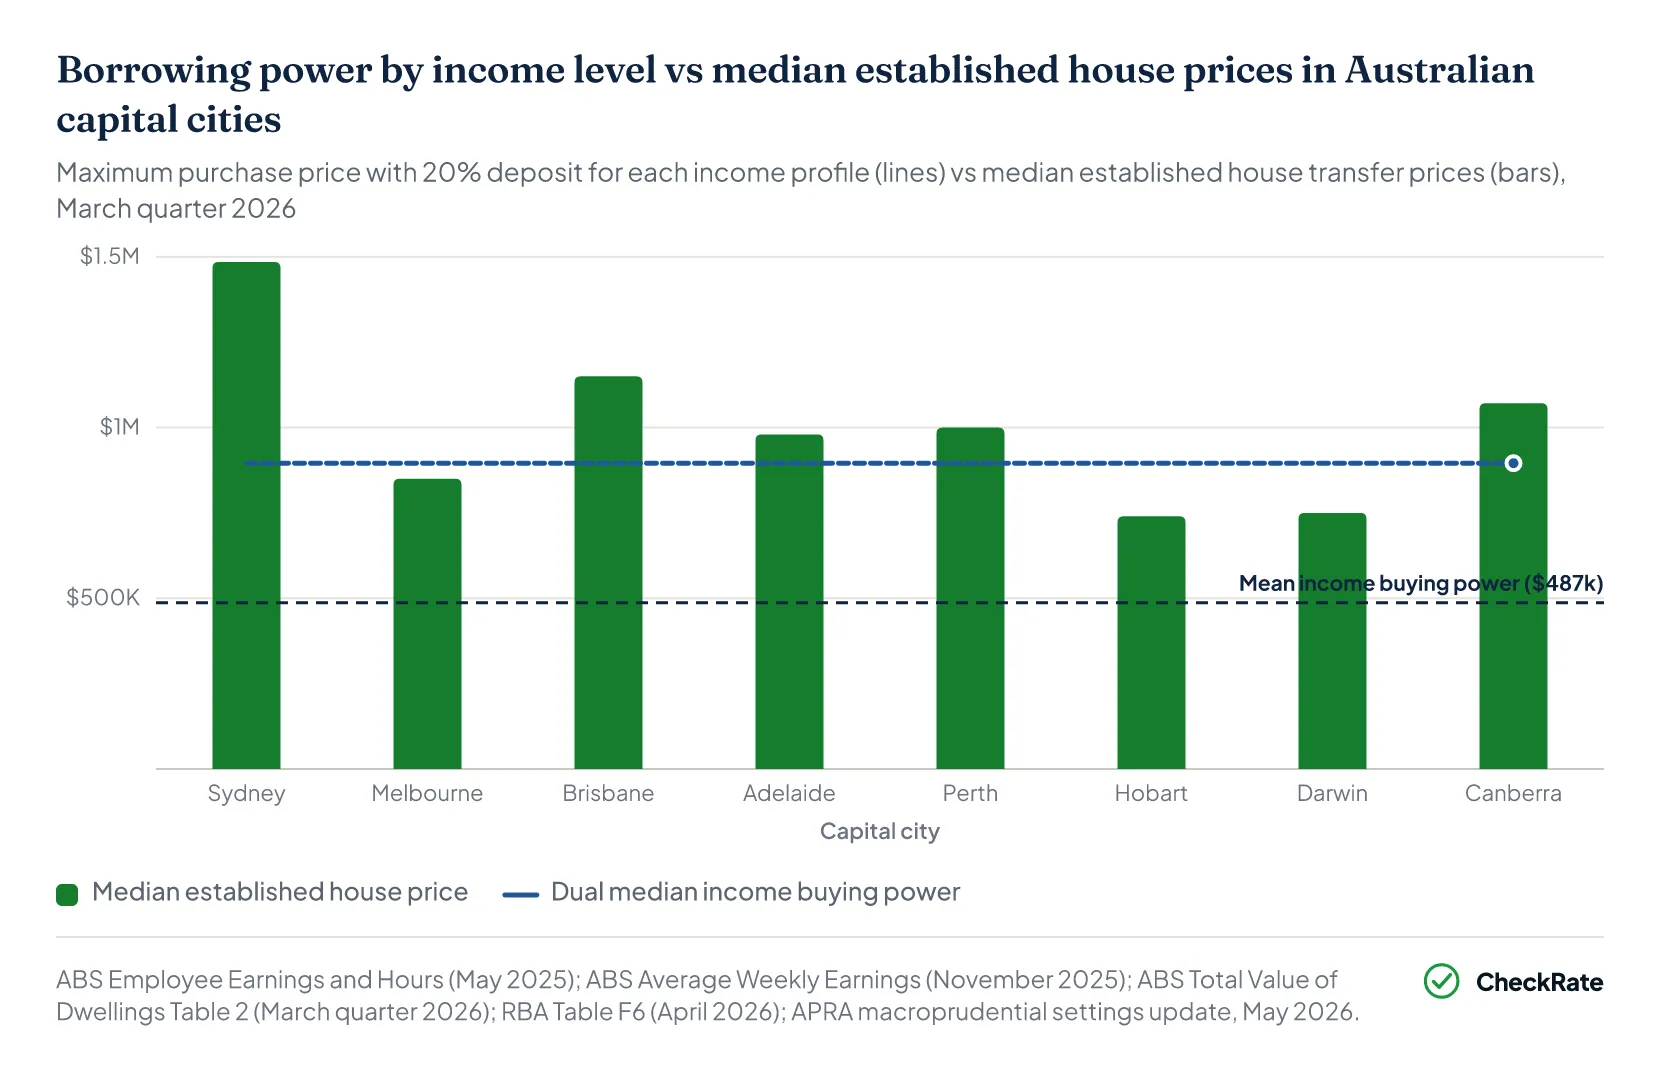
Sydney’s median established house transfer price was $1,485,000 in the March quarter of 2026. This was 75% higher than Melbourne’s median of $850,000 and more than double Hobart’s median of $740,000.
Under this model, that price difference creates a wide gap in estimated income requirements. A single borrower would need an estimated minimum annual income of about $325,400 to service a median established house purchase in Sydney, compared with $162,100 in Hobart and $164,300 in Darwin.
- Sydney
- $325,400
- median $1,485,000
- Melbourne
- $186,300
- median $850,000
- Brisbane
- $252,000
- median $1,150,000
- Adelaide
- $214,700
- median $980,000
- Perth
- $219,100
- median $1,000,000
- Hobart
- $162,100
- median $740,000
- Darwin
- $164,300
- median $750,000
- Canberra
- $234,700
- median $1,071,300
At the state level, the gap between mean dwelling prices and full-time earnings is widest in New South Wales. Under this model, the minimum income needed to service the state’s mean dwelling price is $290,300, equal to 2.7 times the New South Wales full-time ordinary-time earnings figure of $108,368.
The Northern Territory has the narrowest gap, with a modelled minimum income of $130,900 compared with full-time ordinary-time earnings of $100,999.
The state-level figures use mean dwelling prices and cover all dwelling types, including houses, units and townhouses. This differs from the capital-city comparison above, which uses median established house transfer prices.
| Minimum income by state and territory | |||
|---|---|---|---|
| State or territory | Mean dwelling price (Mar 2026) | FT adult OT earnings (Nov 2025, annual) | Min income for mean price (20% dep) |
| NSW | $1,324,800 | $108,368 | $290,300 |
| Vic | $947,100 | $104,712 | $207,600 |
| Qld | $1,123,700 | $103,714 | $246,200 |
| SA | $973,100 | $100,625 | $213,200 |
| WA | $1,103,500 | $114,046 | $241,800 |
| Tas | $750,300 | $94,702 | $164,400 |
| NT | $597,300 | $100,999 | $130,900 |
| ACT | $1,018,000 | $116,917 | $223,100 |
| Australia | $1,111,100 | $106,657 | $243,500 |
Source · ABS Total Value of Dwellings, Table 1, March quarter 2026; ABS Average Weekly Earnings, November 2025.
Section 03 · Single income vs dual income buyers
Can a single-income buyer afford a home in Australia?
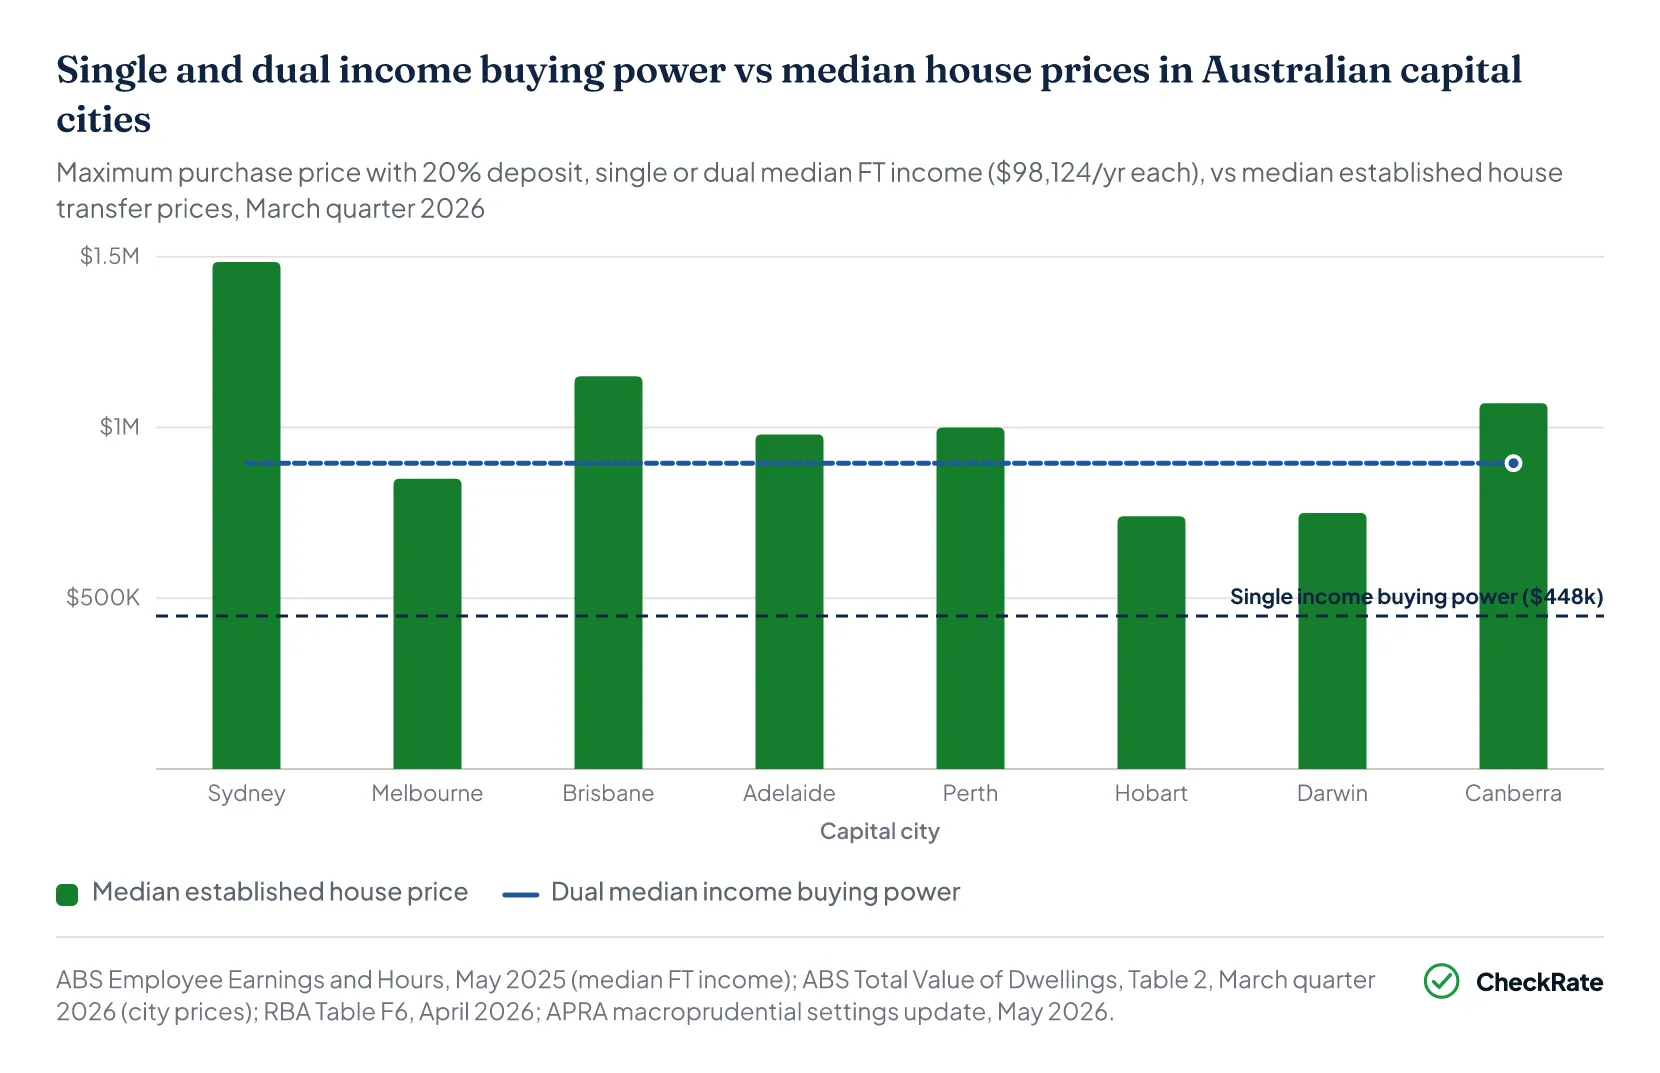
A single borrower on the national median full-time income of $98,124 a year has modelled borrowing capacity of about $358,000, giving estimated purchasing power of about $448,000 with a 20% deposit. That is below the median established house transfer price in every capital city.
Two borrowers each earning the national median full-time income have combined modelled borrowing capacity of about $716,000, giving estimated purchasing power of about $896,000 with a 20% deposit. That is enough to reach Melbourne’s median established house transfer price, but remains below the median in Brisbane, Adelaide, Perth, Canberra and Sydney.
The increase in assessed mortgage rates has reduced modelled borrowing capacity for single-income buyers. When the RBA’s new owner-occupier rate was 2.42% in December 2021, the same single median income would have supported modelled borrowing capacity of about $509,000, giving estimated purchasing power of approximately $636,000 with a 20% deposit. That was enough to reach the median established house transfer prices in Darwin and Hobart, but still below Melbourne’s median. At the April 2026 assessment rate of 8.92%, the same income supports modelled borrowing capacity of about $358,000.
Section 04 · Deposit size
How does deposit size change the income needed to buy a home?
At median household income, it now takes 11.2 years to save a 20% deposit, up from 10.6 years a year earlier. A smaller deposit increases the loan size, which also increases the income needed to meet the modelled repayment test.
On a $1,000,000 property, moving from a 5% deposit to a 20% deposit reduces the modelled minimum income requirement by about $41,000 a year. However, the larger deposit also requires an additional $150,000 upfront.
For deposits below 20%, Lenders Mortgage Insurance may also apply, depending on the lender, loan type and borrower circumstances.
| Impact of deposit size on required income | |||||
|---|---|---|---|---|---|
| Deposit | Deposit amount | Loan | Actual monthly repayment | Min annual income | LMI |
| 5% | $50,000 | $950,000 | $5,647 | $260,200 | Typically required |
| 10% | $100,000 | $900,000 | $5,350 | $246,500 | Typically required |
| 15% | $150,000 | $850,000 | $5,053 | $232,800 | Typically required |
| 20% | $200,000 | $800,000 | $4,755 | $219,100 | Not required |
Source · RBA Statistical Table F6, April 2026; APRA macroprudential settings update, May 2026.
Section 05 · How income requirements have changed
How interest rates and dwelling prices changed income requirements
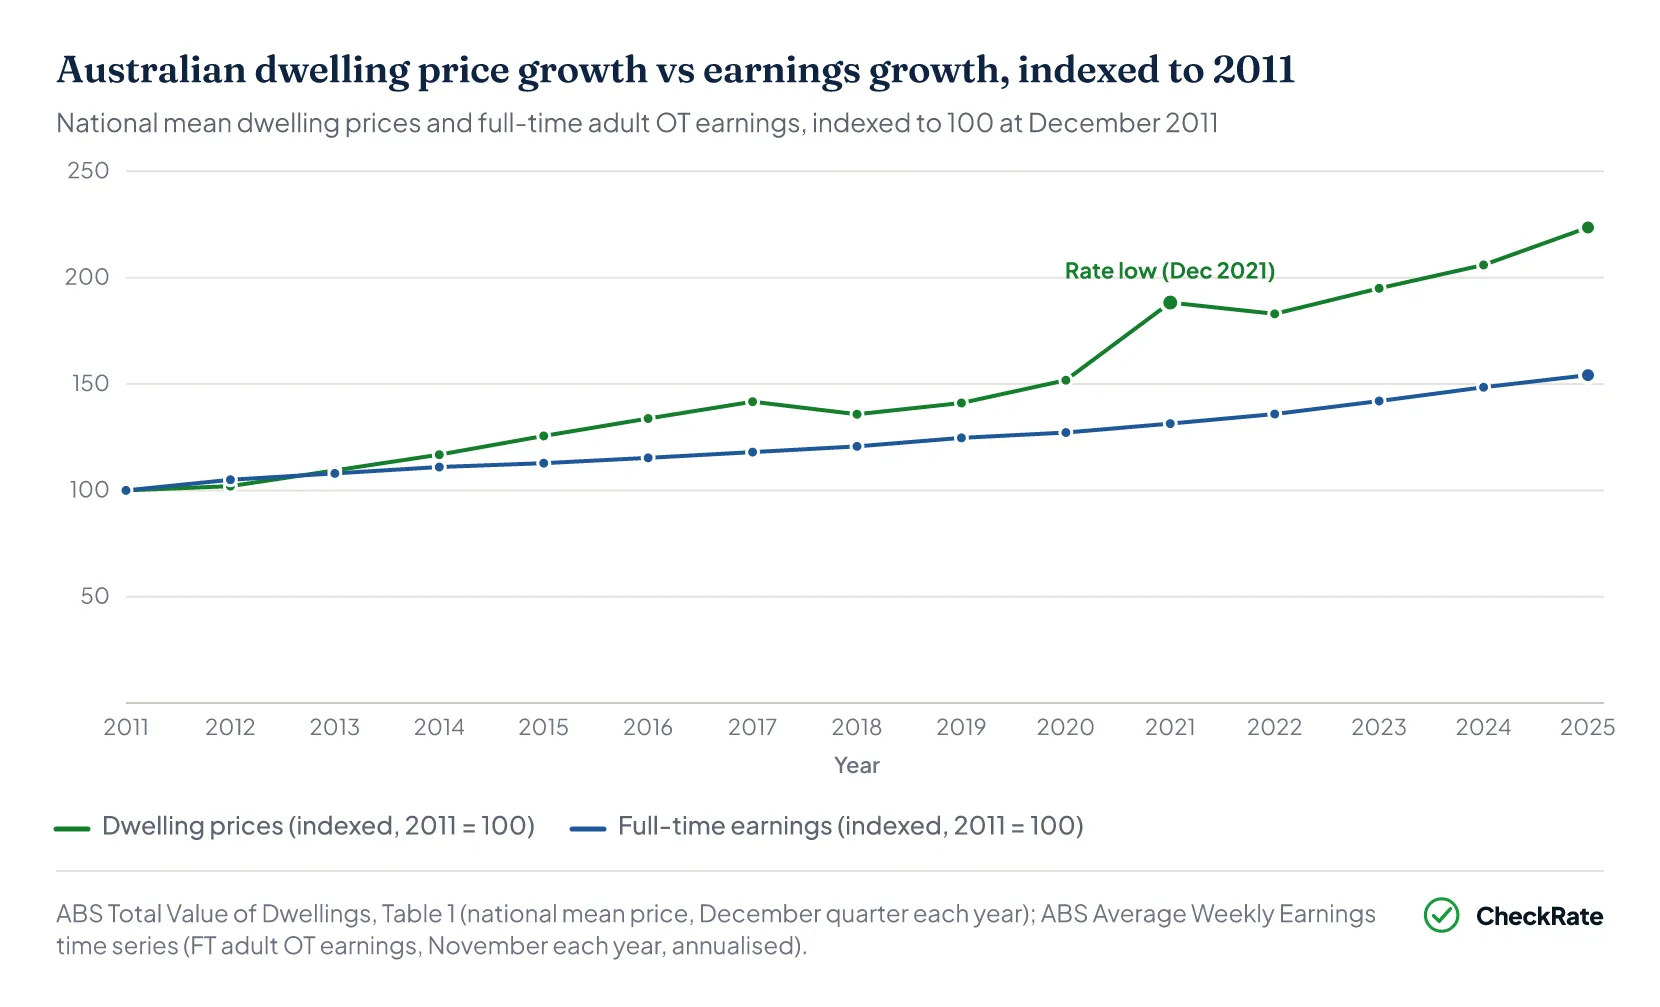
Between December 2011 and December 2025, the national mean dwelling price rose from $486,900 to $1,088,800, an increase of 123.6%. Full-time adult ordinary-time earnings rose from $69,165 to $106,657 a year over the same period, an increase of 54.2%. This means national mean dwelling prices grew at about 2.3 times the pace of full-time earnings over those 14 years.
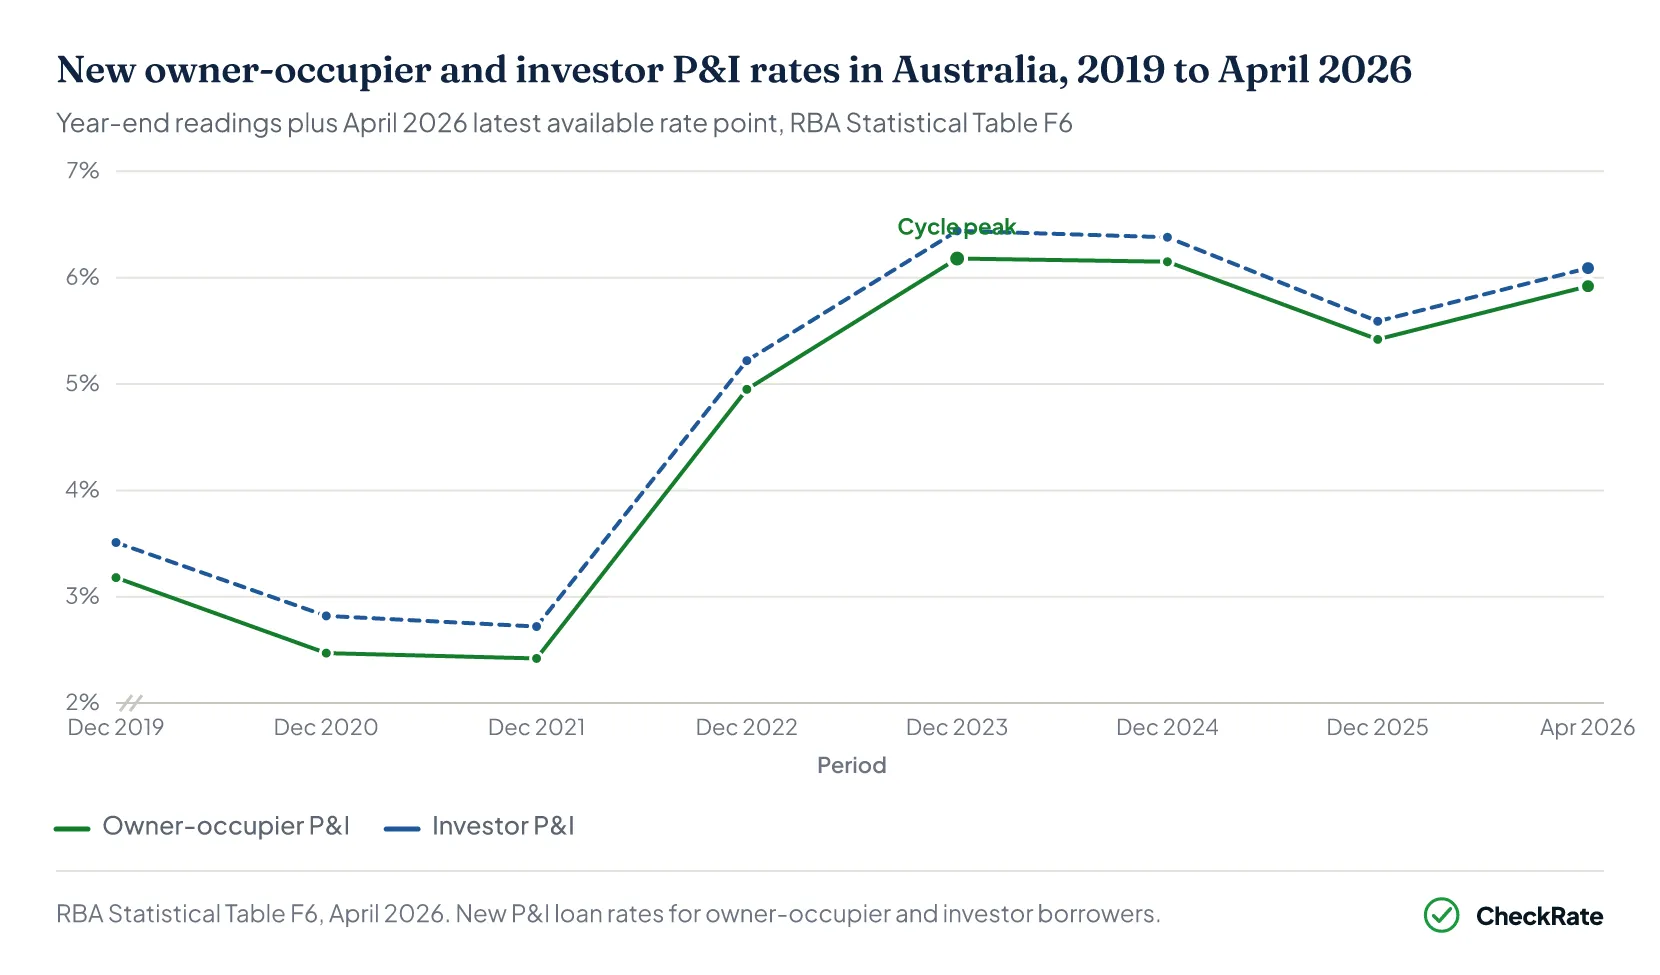
The increase in mortgage rates added a second layer to the affordability gap. New owner-occupier principal-and-interest rates rose from 2.42% in December 2021 to 6.18% in December 2023, before easing to 5.42% by December 2025. After cash rate increases before April 2026, the RBA’s new owner-occupier principal-and-interest rate rose to 5.92% in April 2026.
Dec 2019
3.18%
Pre-pandemic
Dec 2020
2.47%
Dec 2021
Cycle low2.42%
Dec 2022
4.95%
Rising
Dec 2023
Cycle peak6.18%
Dec 2024
6.15%
Dec 2025
5.42%
Easing
Apr 2026
Latest available rate point5.92%
Source · RBA Statistical Table F6, Lenders’ Interest Rates. New owner-occupier P&I loan rates. Selected months only.
Section 06 · Beyond income
What do lenders assess beyond income?
For the national average owner-occupier loan of $735,000, APRA’s 3-percentage-point serviceability buffer increases the modelled assessed monthly repayment from $4,369 to $5,872, a difference of $1,503 per month. Income is only one part of mortgage serviceability. Lenders also assess living expenses, existing debt, credit history, income stability and other borrower circumstances. These factors can reduce borrowing capacity below what the income figure alone suggests.
Serviceability buffer
+3pp
Lenders must assess repayments at the loan’s interest rate plus at least 3 percentage points, unless APRA determines otherwise. At 5.92%, that means testing repayments at 8.92%. APRA confirmed in May 2026 that the mortgage serviceability buffer would remain at 3 percentage points.
Income verification
Verified
Lenders typically verify income using documents such as recent payslips, employer or accountant confirmation, tax assessment notices, tax returns and bank statements. Self-employed borrowers generally require more detailed income and cash-flow documentation.
Non-salary income discount
−20%
APRA’s guidance says prudent lenders apply discounts to temporarily high, uncertain or variable income. This can include overtime, bonuses, commissions, rental income and other non-salary income. APRA describes a discount of at least 20% as prudent practice for most types of non-salary income.
Living expenses benchmark
HEM
Living expenses are generally assessed using the greater of the borrower’s declared expenses or an appropriately scaled benchmark, such as the Household Expenditure Measure or Household Expenditure Index. This means declared expenses may not be the only figure used in serviceability testing.
Credit card assessment
3%/mo
APRA’s guidance says lenders may assess credit card or other revolving personal debt using a repayment rate of 3% a month on the total committed limit. Under that example, a $20,000 credit card limit would count as $600 a month in assessed obligations, even if the balance is lower.
Serviceability ratios
Multiple
Lenders consider several serviceability measures, including income, existing debt commitments, stressed repayments and net income surplus after expenses. No single income figure determines loan approval.
The result is that two borrowers on identical salaries may have different borrowing capacity outcomes. A borrower with $50,000 in credit card limits and a car loan may have lower borrowing capacity than one with no existing debts and a stable base salary, even if their gross income is the same.
What is the serviceability buffer and why does it matter?
Lenders must test repayments at the loan rate plus at least 3 percentage points, unless APRA determines otherwise. At 5.92%, that means testing repayments at 8.92%. On the national average owner-occupier loan of $735,000, the buffer adds $1,503 per month to the assessed repayment, reducing the borrowing capacity supported by the same income.
How is rental income assessed when applying for a mortgage?
Rental income may be counted toward serviceability, but APRA’s guidance says prudent lenders apply a discount to rental income before counting it. APRA describes a discount of at least 20% as prudent practice for most types of non-salary income. A property expected to generate $40,000 a year in rent would have $32,000 counted under that example. Lenders also account for property-related costs, including management fees, rates, insurance and maintenance. APRA’s guidance also says lenders should not rely on future tax benefits from negative gearing when assessing serviceability.
How are unused credit card limits assessed for mortgage serviceability?
APRA guidance says lenders may assess credit cards and revolving debt at 3% of the total committed limit per month, regardless of the current balance. Under that example, a $20,000 credit card limit would count as $600 per month in assessed obligations, or about $7,200 a year, even if the card has not been used. This can reduce the modelled borrowing capacity supported by the borrower’s income.
Section 07 · Salary and borrowing examples
How much borrowing power do different salaries provide in Australia?
Even the highest state or territory full-time earnings figure, the ACT at $116,917 a year, gives a single borrower modelled purchasing power of about $534,000. That is below the median established house transfer price in every capital city.
A borrower on the national median full-time income of $98,124 has modelled purchasing power of about $448,000, while two borrowers each earning the national median full-time income have combined modelled purchasing power of about $896,000.
The four profiles below show how salary translates into modelled borrowing capacity under the article’s assumptions, including an 8.92% assessment rate, a 30-year loan term, a 20% deposit and a 35% debt-service ratio.
Median full-time worker
$448,000
Maximum buying power with 20% deposit
- Annual income: $98,124
- Max loan (35% DSR): $358,000
- Actual monthly repayment: $2,129
- Within reach: Below median in all capitals
Mean full-time adult (AWE)
$487,000
Maximum buying power with 20% deposit
- Annual income: $106,657
- Max loan (35% DSR): $389,000
- Actual monthly repayment: $2,315
- Within reach: Below median in all capitals
ACT full-time worker (highest jurisdiction)
$534,000
Maximum buying power with 20% deposit
- Annual income: $116,917
- Max loan (35% DSR): $427,000
- Actual monthly repayment: $2,537
- Within reach: Below median in all capitals
Dual median full-time income couple, combined $196,248/yr
$896,000
Maximum buying power with 20% deposit. Two borrowers each on ABS median FT income ($98,124/yr)
- Max loan: $716,000
- Monthly repayment: $4,259
- Reaches: Melbourne
- Short of: Brisbane, Adelaide, Perth, Canberra, Sydney
Section 08 · Borrowing power reduced
How much has modelled borrowing power changed since 2021?
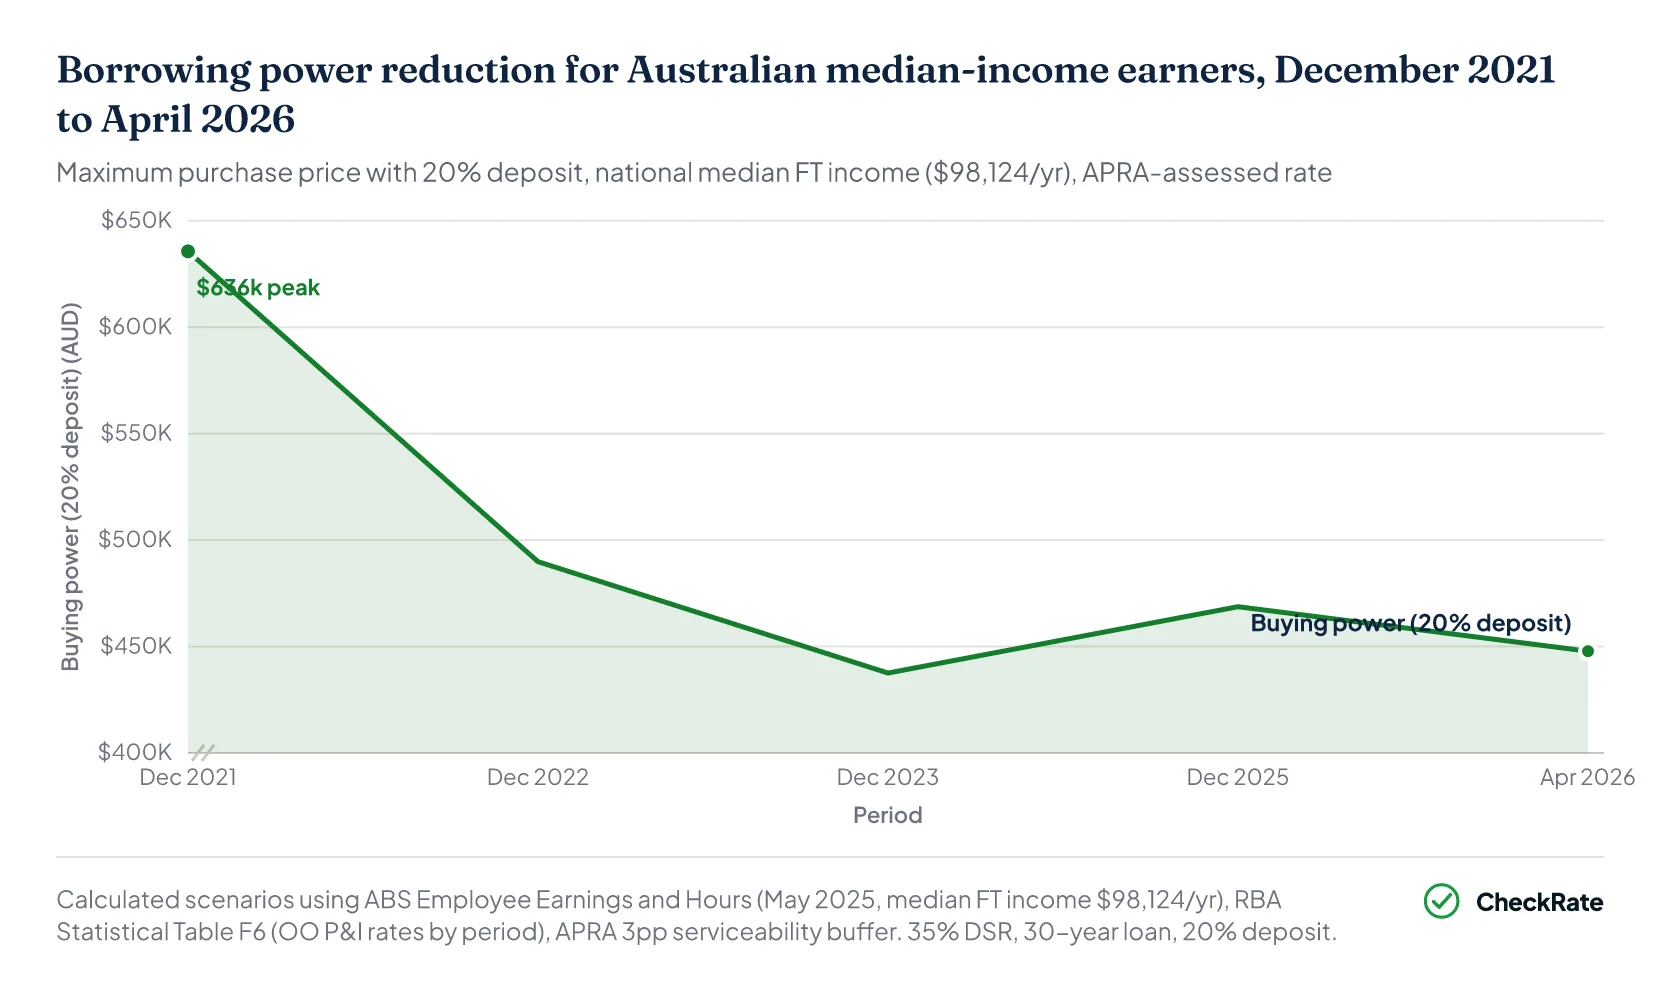
At the December 2021 rate low of 2.42%, APRA’s 3 percentage point buffer gave an assessment rate of 5.42%. Under this model, a borrower on the national median full-time income had estimated borrowing capacity of about $509,000, giving modelled purchasing power of about $636,000 with a 20% deposit.
At the April 2026 assessment rate of 8.92%, the same income supports estimated borrowing capacity of about $358,000, with modelled purchasing power of about $448,000. That is a reduction of around $188,000 in modelled purchasing power from the same salary over four and a half years.
The table shows how modelled borrowing capacity changed as assessment rates moved over time. The maximum loan amount falls when the assessment rate rises, because serviceability is tested against the assessed repayment rather than the actual repayment. Even when actual rates eased in 2025, the assessment rate remained higher than in 2021, keeping modelled borrowing capacity below the earlier level.
| Modelled borrowing power by rate period | |||||
|---|---|---|---|---|---|
| Period | Actual OO rate | Assessment rate | Max loan (median income) | Buying power (20% dep) | Actual monthly repayment |
| Dec 2021 | 2.42% | 5.42% | $509,000 | $636,000 | $1,988 |
| Dec 2022 | 4.95% | 7.95% | $392,000 | $490,000 | $2,092 |
| Dec 2023 | 6.18% | 9.18% | $350,000 | $438,000 | $2,139 |
| Dec 2025 | 5.42% | 8.42% | $375,000 | $469,000 | $2,110 |
| Apr 2026 | 5.92% | 8.92% | $358,000 | $448,000 | $2,129 |
Source · RBA Statistical Table F6; APRA macroprudential settings update, May 2026; ABS Employee Earnings and Hours, May 2025.
The repayment comparison shows how higher rates changed borrowing capacity. In December 2021, a borrower at the maximum modelled loan capacity had an actual monthly repayment of $1,988. By April 2026, the same income supported a smaller maximum loan, but the actual monthly repayment was higher at $2,129.
Under this model, the April 2026 borrower has lower buying power but a higher monthly repayment. This reflects the effect of higher mortgage rates, which reduce modelled borrowing capacity while increasing repayments on the amount borrowed.
For a borrower on the mean full-time income of $106,657, the modelled buying power decline since 2021 is around $204,000, from approximately $691,000 to $487,000.
References
- NHSAC State of the Housing System 2026 · nhsac.gov.au
- NHSAC, State of the Housing System 2025 · nhsac.gov.au
- ABS Total Value of Dwellings, March quarter 2026 · Australian Bureau of Statistics
- ABS, Average Weekly Earnings, Australia, Nov 2025 · Australian Bureau of Statistics
- ABS Employee Earnings and Hours, Australia · Australian Bureau of Statistics
- Lending Indicators, June Quarter 2026, Table 24, cat. 5601.0 · Australian Bureau of Statistics
- ABS, Lending Indicators methodology, March quarter 2026 · Australian Bureau of Statistics
- RBA, Lenders' Interest Rates (Statistical Table F6) — housing rates, February 2026 · Reserve Bank of Australia
- APRA Prudential Practice Guide APG 223 — Residential Mortgage Lending · apra.gov.au
- APRA macroprudential settings update, July 2025 · apra.gov.au