


Updated
- Monthly repayment
- $4,006/mo
- Modelled monthly repayment on the average 2025 owner-occupier loan
- Income share
- 9.6%
- Share of household disposable income, Q3 2025
- NSW average loan
- $873k
- Average new owner-occupier loan in NSW, December quarter 2025
- New-loan rate
- 5.66%
- Average new owner-occupier P&I loan rate, February 2026
 Australian mortgage statistics 2026Australia had about 9.3 million occupied private dwellings at the 2021 Census. Of these, around 3.24 million (35.0%) were owned with a mortgage, 2.87 million (31.0%) were owned outright, and 2.84 mill…
 Mortgage stress in Australia: how many households are affected? (2026)Mortgage stress is a term used when housing costs take up a large share of a household's income.
 How much debt do Australian households have?As of December 2025, Australian households owe a combined $3.40 trillion, up from $2.06 trillion ten years earlier. That means household debt has grown by 65% in a decade, adding around $1.34 trillion…
Section 01 · What borrowers pay
What is the average mortgage repayment in Australia?
The repayment for a new owner-occupier loan in Australia is around $4,006 a month, or $924 a week, based on a 30-year principal-and-interest term. The estimate uses the average 2025 loan size of $693,000 and the February 2026 average new-loan rate of 5.66%. Modelled repayments have almost doubled in dollar terms since 2019.
Lenders wrote 337,626 new owner-occupier loans across 2025, worth a combined $234.0 billion. That puts the average new loan at $693,000, which is 8.7% above 2024 and around 67% larger than the average new loan in 2016. Applying the February 2026 average new-loan P&I rate of 5.66% over a standard 30-year term gives:
How the average mortgage repayment has changed since 2019
The modelled monthly repayment rose from $2,005 in 2019 to $4,019 in 2025, almost double in six years. Adjusting for inflation, that is a 62% real increase, with most of the rise concentrated between 2022 and 2024 as rates climbed.
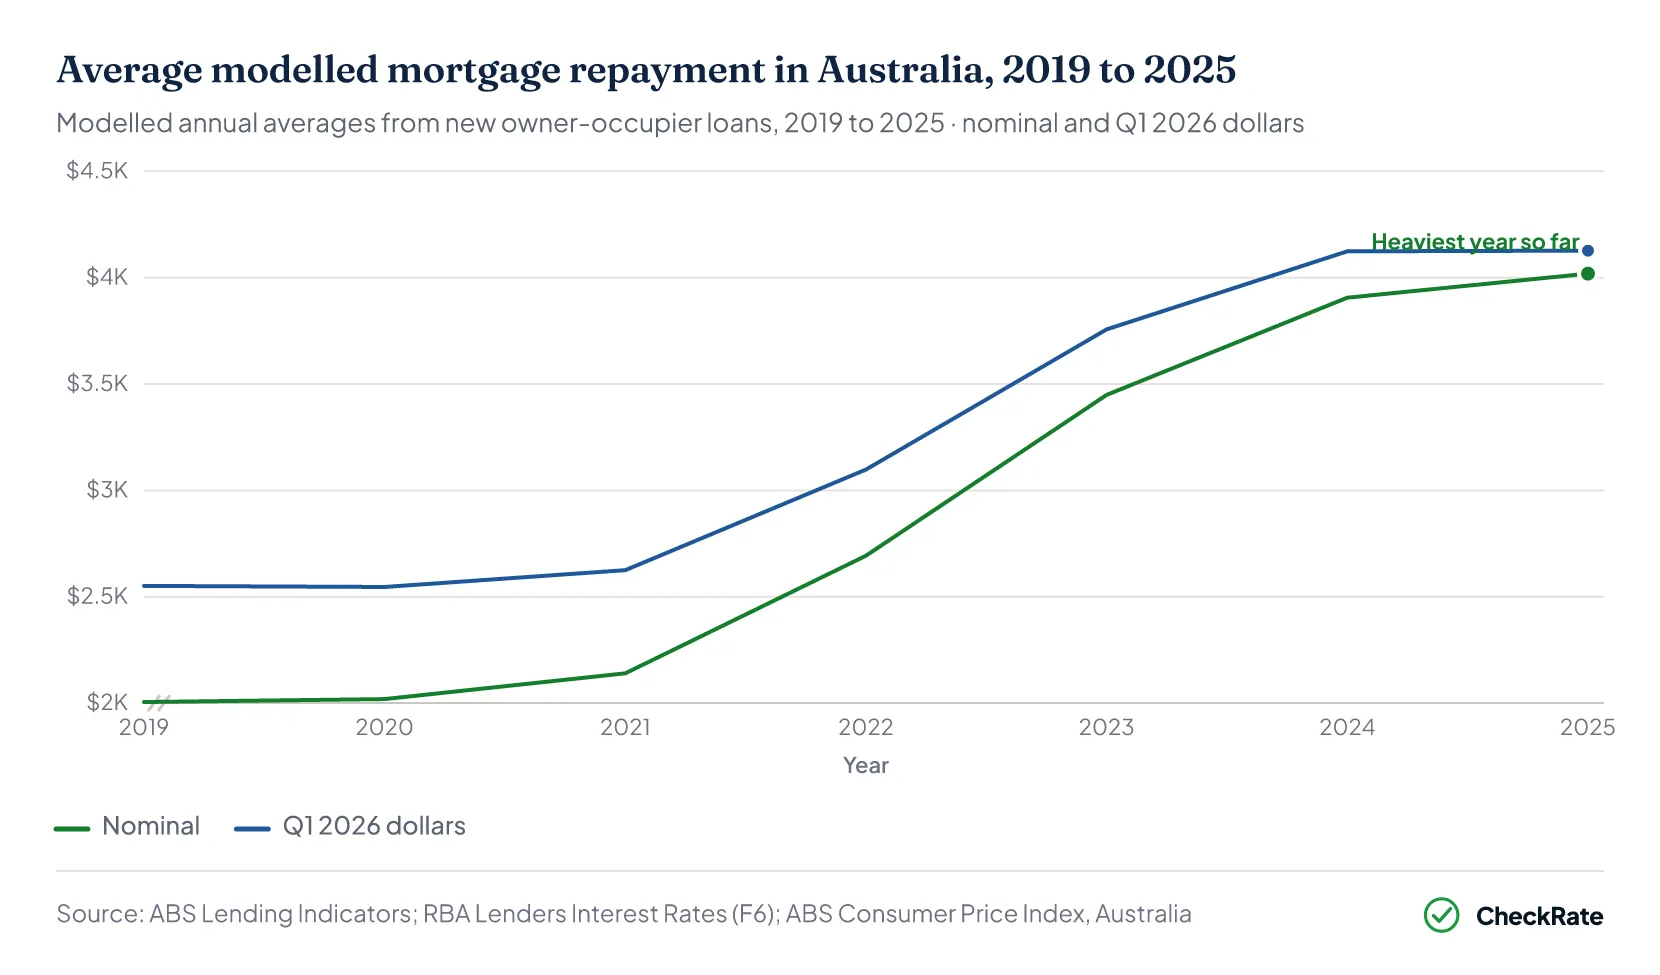
The biggest rise came in 2023, when the modelled monthly repayment grew by about $760 on the year before. By 2024, repayments had reached $3,906 per month on average for a new loan, the highest level in the series. They edged up again in 2025, mainly because average loan sizes increased while rates eased only slightly.
What about households with an existing mortgage?
Across Australia's existing stock of housing loans, scheduled repayments were running at around $45 billion a quarter in late 2025. This covers both owner-occupier and investor housing loans, so it should be read as a system-wide repayment measure rather than the average repayment paid by an individual mortgaged household.
Outstanding owner-occupier loans averaged 5.73% in February 2026, while newly funded owner-occupier loans averaged 5.72%. Both rates were above pandemic-era lows but below the 6.11% peak in mid-2024.
Section 02 · By state
Average mortgage repayment by state in Australia
Average new owner-occupier loans in Australia ranged from $873,000 in NSW to $504,000 in Tasmania in the December quarter 2025, a 73% gap. At the February 2026 rate, that produces a modelled difference of $2,133 a month, or about $493 a week, between the highest and lowest state repayments. Loan sizes vary widely because average property prices and borrowing patterns differ across states.
- Modelled monthly repayment
- $5,045
- Weekly Equivalent Repayment
- $1,164
- Modelled monthly repayment
- $4,253
- Weekly Equivalent Repayment
- $981
- Modelled monthly repayment
- $3,976
- Weekly Equivalent Repayment
- $918
- Modelled monthly repayment
- $3,912
- Weekly Equivalent Repayment
- $903
- Modelled monthly repayment
- $3,808
- Weekly Equivalent Repayment
- $879
- Modelled monthly repayment
- $3,802
- Weekly Equivalent Repayment
- $877
- Modelled monthly repayment
- $2,976
- Weekly Equivalent Repayment
- $687
- Modelled monthly repayment
- $2,912
- Weekly Equivalent Repayment
- $672
- Modelled monthly repayment
- $4,253
- Weekly Equivalent Repayment
- $981
| Average Loan and Repayment by Australian State | |||||
|---|---|---|---|---|---|
| State | Average new loan · Dec qtr 2025 | Dec qtr 2024 | Annual change | Modelled monthly repayment | Weekly equivalent |
| New South Wales | $873,000 | $810,000 | +7.8% | $5,045 | $1,164 |
| Queensland | $736,000 | $635,000 | +15.9% | $4,253 | $981 |
| Western Australia | $688,000 | $599,000 | +14.9% | $3,976 | $918 |
| Victoria | $677,000 | $632,000 | +7.1% | $3,912 | $903 |
| Australian Capital Territory | $659,000 | $650,000 | +1.4% | $3,808 | $879 |
| South Australia | $658,000 | $579,000 | +13.6% | $3,802 | $877 |
| Northern Territory | $515,000 | $465,000 | +10.8% | $2,976 | $687 |
| Tasmania | $504,000 | $474,000 | +6.3% | $2,912 | $672 |
| Australia | $736,000 | $666,000 | — | $4,253 | $981 |
Source · ABS Lending Indicators, December quarter 2025; RBA Lenders' Interest Rates (F6), February 2026
Which states had the fastest loan-size growth in 2025?
Three states posted double-digit annual growth in average loan size last year:
- Queensland led the country, up 15.9% on the previous December quarter
- Western Australia followed at 14.9%
- South Australia rounded out the top three at 13.6%
NSW grew a more modest 7.8%, but its loans were already the largest in the country in absolute terms. The ACT was the slowest mover, up just 1.4%. The mix is shifting too: Queensland is closing in on the national mark, while Tasmania, the Northern Territory and the ACT all sit below $660,000.
Monthly repayment by Australian state
Modelled repayments on new owner-occupier loans at the Feb 2026 rate · December quarter 2025 loan sizes
State
Per month
- 1New South Wales$5,045
- 2Queensland$4,253
- 3Australia$4,253
- 4Western Australia$3,976
- 5Victoria$3,912
- 6Australian Capital Territory$3,808
- 7South Australia$3,802
- 8Northern Territory$2,976
Source · ABS, Lending Indicators methodology, March quarter 2026 · from www.abs.gov.au
Section 03 · Income share
How much household income goes to mortgage repayments?
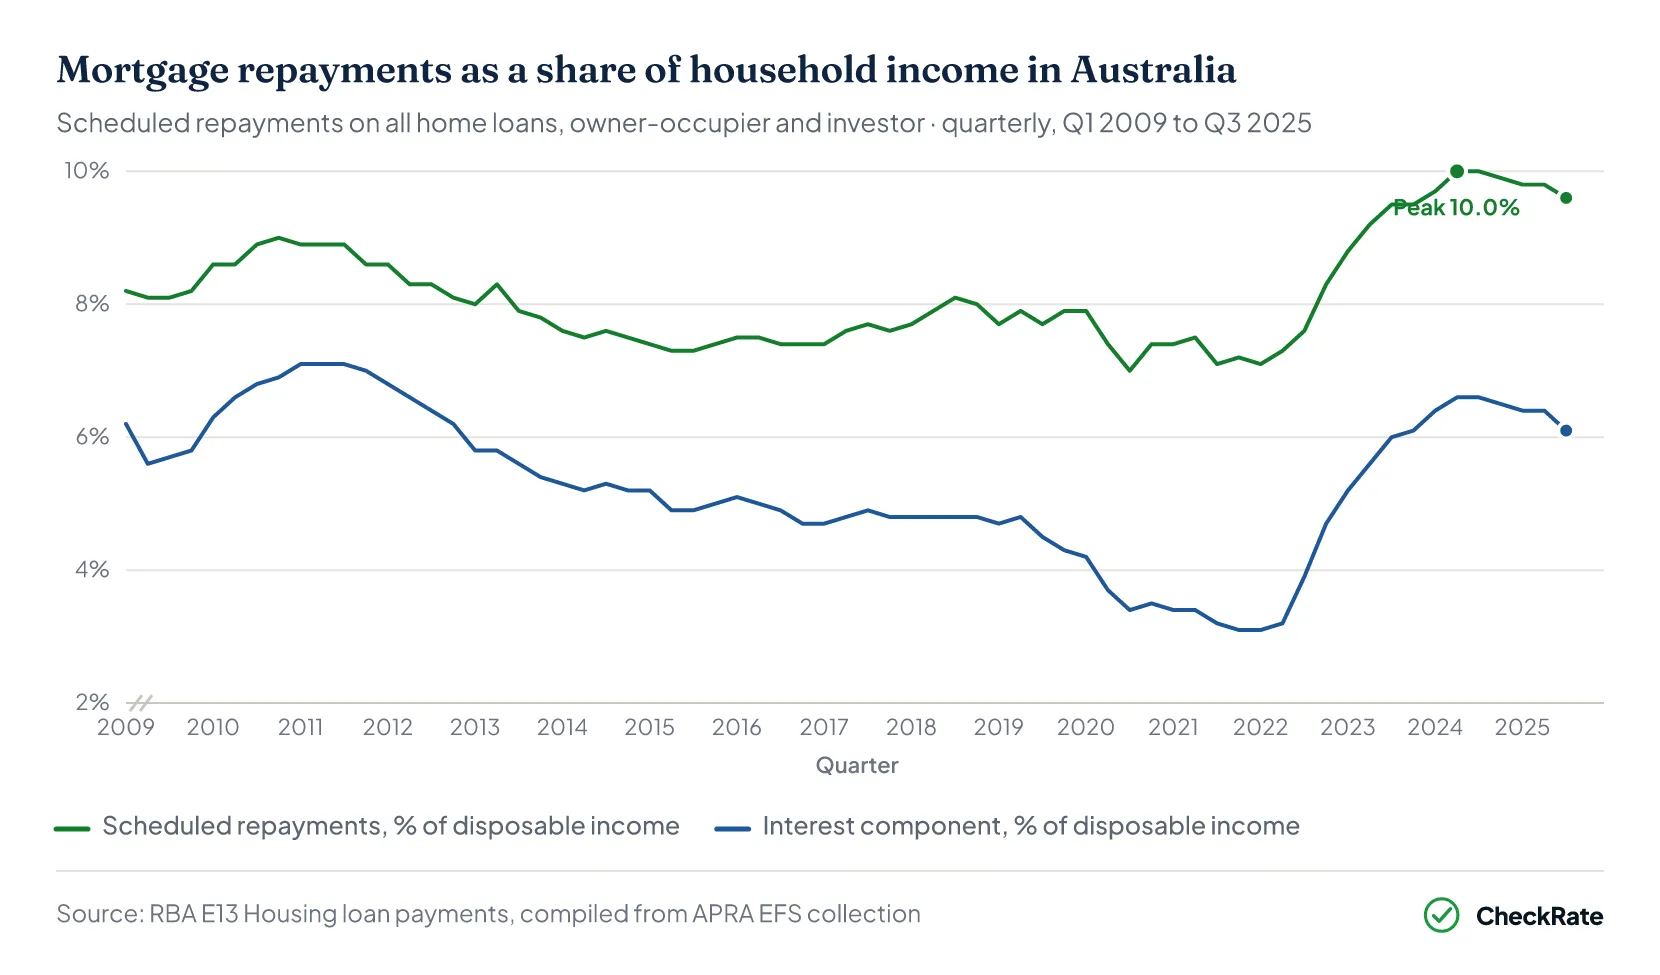
Around 9.6% of Australian household disposable income goes to scheduled mortgage repayments, close to one dollar in every ten. That sits just below the all-time peak of 10.0% set in mid-2024, and well above the 7.0% pandemic low of late 2020.
That ratio sat at 9.6% in Q3 2025. It has eased fractionally from the all-time peak of 10.0% in Q2 and Q3 2024, but it is still 2.6 percentage points above the pandemic low of 7.0% in Q3 2020 and above the pre-2020 average of around 7.7%. About one in every ten dollars of household disposable income now goes to scheduled mortgage payments.
In dollar terms, total scheduled repayments rose from about $26.7 billion in Q1 2020 to $45.3 billion in Q4 2025, a 70% increase in five years.
Why has the mortgage repayment income share risen?
The interest component accounted for most of the increase. It rose from a low of 3.1% of disposable income in Q4 2021 to a peak of 6.6% in mid-2024, and was still at 6.1% in Q3 2025. The principal component has stayed relatively flat, because scheduled principal payments do not move as sharply when rates change.
About a third of the dollar increase from 2020 to 2025 reflects a larger pool of mortgaged households and bigger loan balances. The rest reflects the rate cycle working through both new borrowing and existing variable-rate loans.
Section 04 · Mortgage stress
How many Australian households are in mortgage stress?
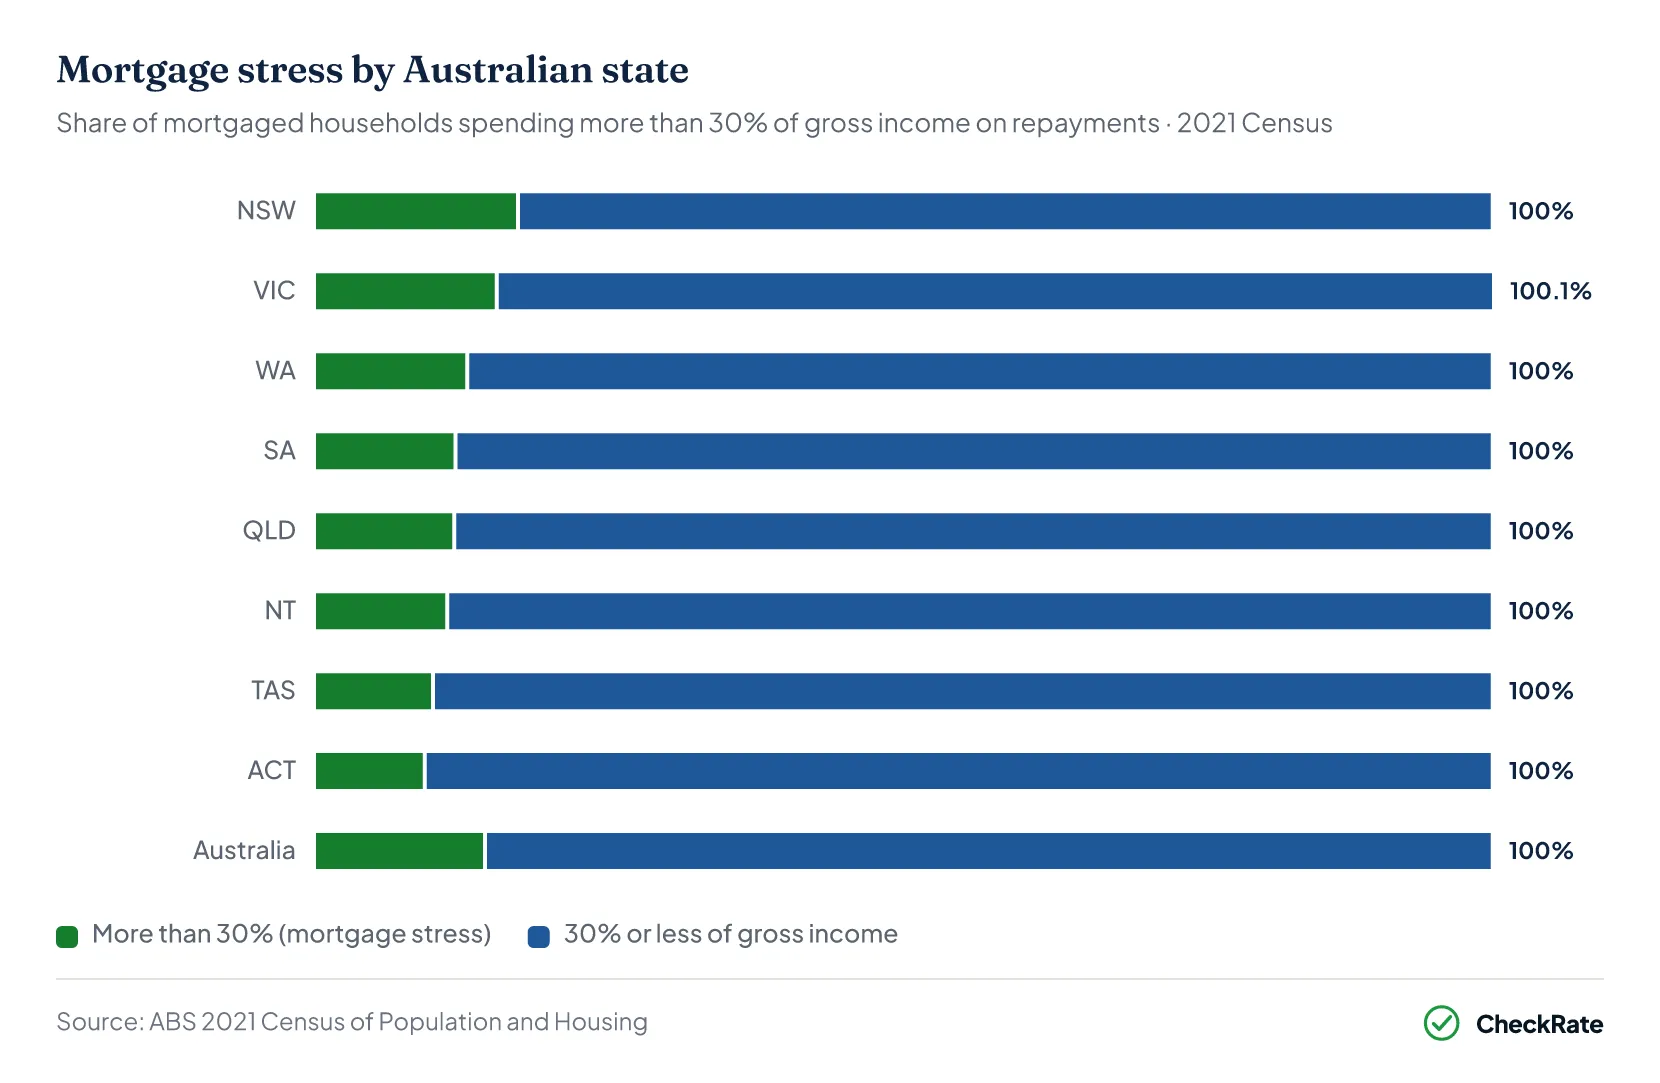
About 1 in 7 mortgaged Australian households, or 14.5%, were in mortgage stress at the 2021 Census, meaning they spent more than 30% of gross household income on home loan repayments. A further 74.0% were at or below that threshold, while 11.6% could not be determined.
Mortgage stress by state in Australia
NSW had the highest stress rate at the 2021 Census, with 17.3% of mortgaged households spending more than 30% of gross income on repayments. That reflects the larger loan sizes around metro Sydney. Victoria came next at 15.4%. The ACT was lowest at 9.4%, helped by higher household incomes.
For context against current modelled figures, at the 2021 Census median weekly household income of $1,746, the 30% line worked out to about $524 a week, or $2,270 a month, in mortgage repayments. The current modelled monthly repayment on the average new loan is around $4,006, or $924 a week, above the 30% benchmark for a household at the 2021 median income. This comparison shows the scale of the change in modelled repayments, but it does not measure current household-level mortgage stress.
The 2021 Census was taken when interest rates were at historic lows, with an average new-loan rate of 2.36% that year. Because the Census predates the recent rate cycle, it should not be read as a current mortgage-stress estimate. The next Census is in 2026, with results expected in 2027.
Section 05 · First-home buyers
What first-home buyers pay on their mortgage
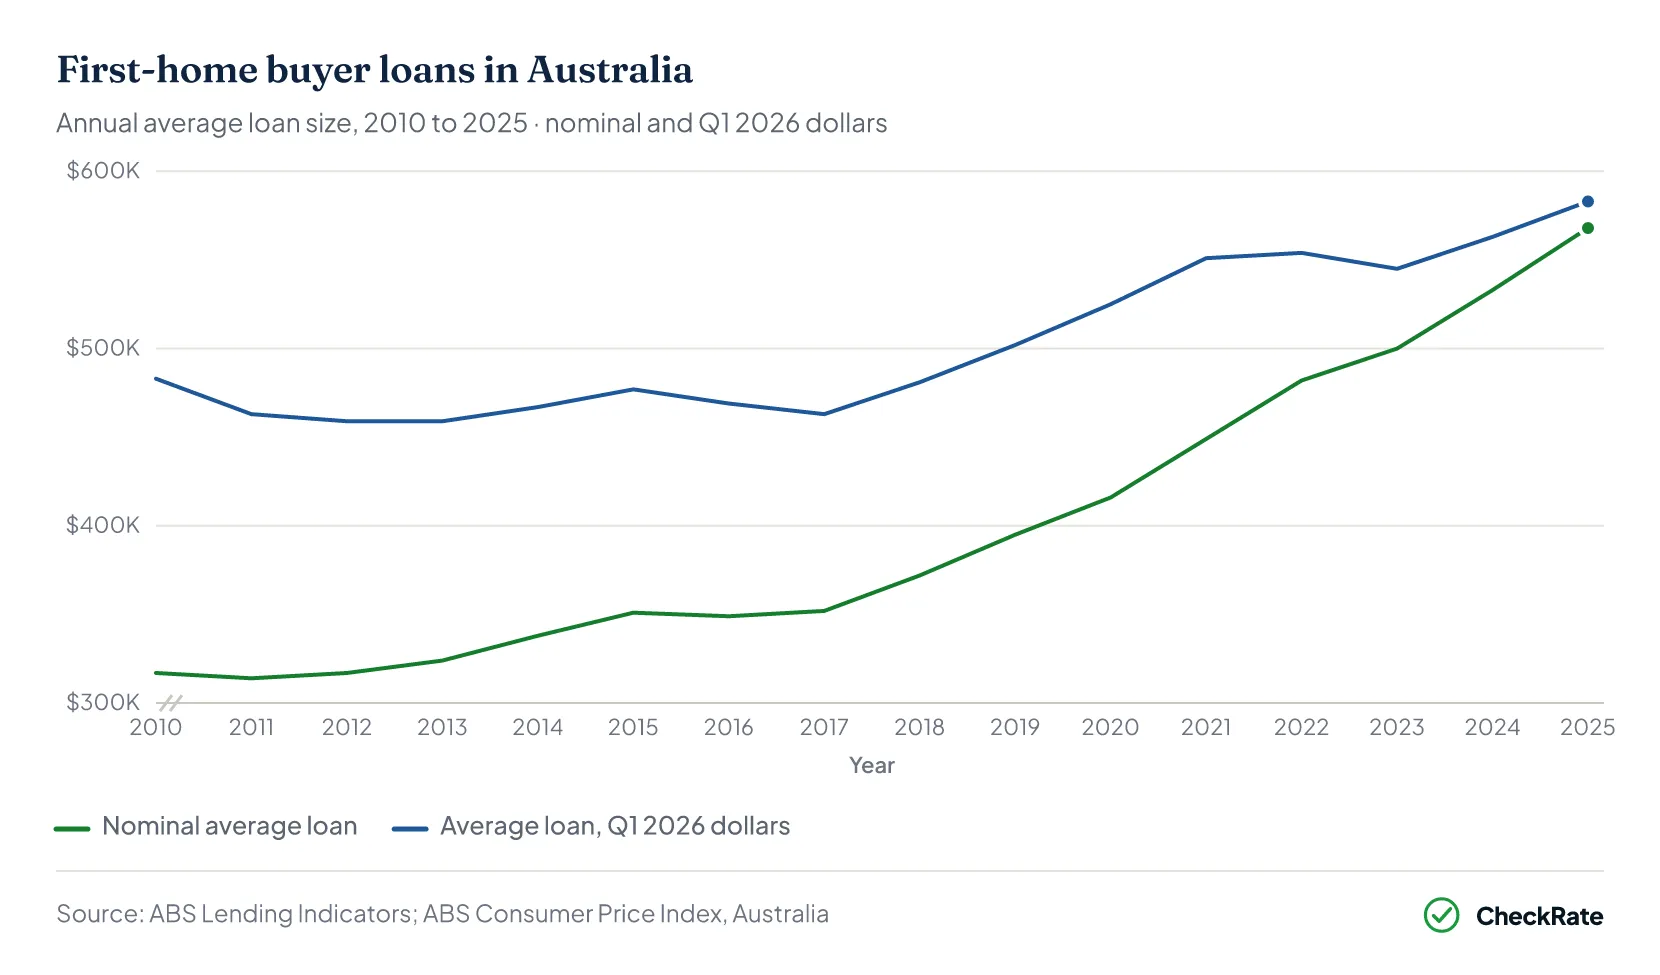
The average first-home buyer loan in Australia was $568,000 in 2025, up from $349,000 in 2016. That is a 62.6% increase over nine years, or 24.2% after inflation. First-home buyer loans have grown faster than the broader market. This occurred during a period of larger average loan sizes and higher lending rates.
What first-home buyers pay each month and week
In 2019, the average first-home buyer loan was $395,000. At an average rate of 3.33%, that worked out to about $1,734 a month, or $400 a week, on a 30-year principal-and-interest loan. By 2025, the average loan had risen to $568,000, while the average rate had climbed to 5.69%. That lifted the estimated repayment to about $3,291 a month, or $759 a week.
The estimated monthly repayment on the average first-home buyer loan has almost doubled in six years.
First-home buyer activity has slowed
The number of new first-home buyer loans in 2025 was 119,407, down from a 2021 stimulus-era peak of 164,094 but well above the 2023 trough of around 110,000. As a share of total owner-occupier commitments, first-home buyers accounted for about 35% of new loans in 2025, broadly steady with 2024.
Larger loans and higher rates increased repayment pressure for first-home buyers. Even before counting the rise in loan sizes, the rate cycle alone added more than $1,000 a month to repayments compared with pandemic-era lows.
Section 06 · By loan size
Mortgage repayments by loan size: how much different loans cost
At the February 2026 rate of 5.66% over 30 years, estimated monthly repayments range from about $1,734 on a $300,000 loan to $5,779 on a $1,000,000 loan. The 2025 national average loan of $693,000 works out to about $4,006 a month, while the NSW state average of $873,000 works out to about $5,045 a month. Each extra $100,000 of borrowing adds roughly $578 to the monthly repayment under the same assumptions.
| Mortgage Repayments by Loan Size in Australia | |||||
|---|---|---|---|---|---|
| Loan size | Monthly · 30 yr | Weekly · 30 yr | Monthly · 25 yr | Weekly · 25 yr | Yearly · 30 yr |
| $300,000 | $1,734 | $400 | $1,871 | $432 | $20,808 |
| $400,000 | $2,311 | $534 | $2,495 | $576 | $27,732 |
| $500,000 | $2,889 | $667 | $3,118 | $720 | $34,668 |
| $600,000 | $3,467 | $800 | $3,742 | $864 | $41,604 |
| $693,000 * | $4,006 | $924 | $4,323 | $998 | $48,074 |
| $750,000 | $4,334 | $1,000 | $4,678 | $1,079 | $52,008 |
| $873,000 ** | $5,045 | $1,164 | $5,445 | $1,257 | $60,541 |
| $1,000,000 | $5,779 | $1,334 | $6,237 | $1,439 | $69,348 |
| $1,250,000 | $7,223 | $1,667 | $7,796 | $1,799 | $86,676 |
| $1,500,000 | $8,668 | $2,000 | $9,355 | $2,159 | $104,016 |
Source · RBA Lenders' Interest Rates, February 2026; ABS Lending Indicators, December quarter 2025
How each $100,000 of borrowing translates into repayments
Each extra $100,000 of principal adds about $578 a month, or about $133 a week, on a 30-year schedule at the February 2026 rate. On a 25-year schedule, the same $100,000 adds about $624 a month. On a $750,000 loan, shortening the term from 30 years to 25 years lifts the estimated monthly repayment by $344, but results in lower total interest over the full loan term under the same assumptions.
Section 07 · Owner-occupier vs first-home buyer
How first-home buyer repayments compare with owner-occupiers
First-home buyers borrowed about $125,000 less than the broader owner-occupier average. In 2025, the average first-home buyer loan was $568,000 compared with $693,000 for all new owner-occupiers. At the February 2026 rate, that gap is about a repayment difference of $723 a month, or $8,700 a year, in lower scheduled repayments.
| Owner-Occupier vs First-Home Buyer in Australia | ||||
|---|---|---|---|---|
| Borrower group | Average new loan | Monthly repayment | Weekly repayment | Yearly repayment |
| All new owner-occupiers | $693,000 | $4,006 | $924 | $48,074 |
| First-home buyers | $568,000 | $3,283 | $757 | $39,396 |
| Difference | $125,000 | $723 | $167 | $8,678 |
Source · ABS Lending Indicators, 2025 calendar year averages; RBA Lenders' Interest Rates (F6), February 2026
Why first-home buyer loans are smaller
A few factors may help explain why the first-home buyer average is below the broader owner-occupier figure:
- Lower-priced properties: First-home buyers typically buy units, townhouses or lower-priced houses rather than higher-priced family homes.
- Eligibility settings on government schemes: Programmes such as the First Home Guarantee, First Home Super Saver Scheme and stamp duty concessions can influence the price range of eligible purchases.
- Deposit constraints: Many first-home buyers borrow at higher loan-to-value ratios, but often against lower-priced properties, so the average dollar value of the loan remains below the broader owner-occupier average.
That gap has narrowed. The average first-home buyer loan has grown 62.6% since 2016, faster than the broader owner-occupier average's roughly 40% growth over the same period. First-home buyers accounted for about 35% of new owner-occupier commitments in 2025, broadly steady with 2024.
Section 08 · Owner-occupier vs investor
Do investors pay more than owner-occupiers?
Investors pay around $4,221 a month on an average $717,000 loan, compared with $4,253 a month for an owner-occupier on an average $736,000 loan, based on December quarter 2025 loan-size averages. The two groups borrow similar amounts, but investors pay a slightly higher rate: 5.83% compared with 5.66% in February 2026, about 17 basis points apart.
| Owner-Occupier vs Investor in Australia | ||||
|---|---|---|---|---|
| Borrower group | Average new loan | Rate (Feb 2026) | Monthly repayment | Weekly repayment |
| Owner-occupiers | $736,000 | 5.66% | $4,253 | $981 |
| Investors | $717,000 | 5.83% | $4,221 | $974 |
Source · ABS Lending Indicators, December quarter 2025; RBA Lenders' Interest Rates (F6), February 2026
Holding loan size constant, the rate gap alone adds about $78 a month to investor repayments. A $717,000 loan at the owner-occupier rate of 5.66% would cost about $4,143 a month, compared with $4,221 at the investor rate of 5.83%. State-level investor loans ranged from $873,000 in NSW, matching the owner-occupier figure, down to $460,000 in the Northern Territory.
Investor interest-only repayments
On a $717,000 interest-only investor loan at the February 2026 rate of 6.00%, monthly repayments come to around $3,585, or $827 a week. That is about $636 less than the equivalent P&I loan, because the repayment does not include principal during the interest-only period. This lowers the scheduled monthly repayment, although the loan balance does not reduce during that period.
Section 09 · Calculator
Mortgage repayment calculator
On the 2025 national average new owner-occupier loan of $693,000 at the February 2026 rate of 5.66% over 30 years, monthly repayments come to $4,006 ($924 a week, $48,074 a year). The figures below show the default scenario; the live calculator can be adjusted by loan amount, interest rate and loan term.
Mortgage repayment calculator
Estimate your home loan repayments and the total interest over the life of the loan.
How is the average mortgage repayment calculated?
The modelled monthly repayment uses the 2025 average new owner-occupier loan size of $693,000, repaid over a 30-year term at the February 2026 average new-loan rate of 5.66%. This produces an estimated monthly repayment of around $4,006. Actual repayments will vary by loan size, rate, term and fees.
References
- ABS Lending Indicators, December quarter 2025 · Australian Bureau of Statistics
- RBA / APRA Housing Lending Rates (F6), data to April 2026 · Reserve Bank of Australia
- RBA Housing Loan Payments (E13) · Reserve Bank of Australia
- ABS, Consumer Price Index, Australia, March 2026 · Australian Bureau of Statistics
- ABS 2021 Census of Population and Housing, All persons QuickStats · Australian Bureau of Statistics
- APRA macroprudential settings update, July 2025 · apra.gov.au
Methodology: Monthly and weekly repayments are calculated using a standard amortising-loan formula at a 30-year term unless otherwise specified. Historical comparisons pair each year's average loan size with that year's RBA F6 average new-loan principal-and-interest rate. Current modelling uses the Feb 2026 rate of 5.66%. The calculator excludes fees, lenders mortgage insurance and any offset-account interest savings. All figures are rounded for presentation.