


Published 15 June 2026 · Updated 2 July 2026
- 32yrs
- To save a 20% deposit on the national mean at the latest March 2026 saving ratio of 6.2%
- $222k
- $222,220 required for a 20% deposit on the national mean of $1,111,100
- 38yrs
- To save in New South Wales, the longest state timeline in March 2026
- 18yrs
- To save in the Northern Territory, the shortest timeline nationally
 Australian Savings Statistics 2025Australia's saving rate shifted over the past decade. Before the pandemic, it sat between 4.5% and 7.4%. When COVID lockdowns limited people's spending, savings increased. By FY2021, the saving rate h…
 Australian mortgage statistics 2026Australia had about 9.3 million occupied private dwellings at the 2021 Census. Of these, around 3.24 million (35.0%) were owned with a mortgage, 2.87 million (31.0%) were owned outright, and 2.84 mill…
 Average house deposit Australia 2026: how much do buyers need?The estimated average deposit gap in Australia was about $352,500 at the end of 2025, equal to roughly 32.4% of the average property price. That figure has risen by about 96.7% since 2015.
Section 01 · Deposit timeline
How long does it take to save a 20% deposit?
In the March 2026 quarter, Australia’s mean dwelling price reached $1,111,100, up from $677,475 in 2017. A 20% deposit on the national mean home is now $222,220.
At the March 2026 household saving ratio of 6.2%, the average annual saving estimate is about $6,933. With no starting savings and no investment return included, it would take approximately 32 years to reach a 20% deposit.
Income has increased over the period, but not as quickly as the deposit required. Average annual income rose from $85,441 in 2017 to $111,815 on the latest November 2025 earnings data, an increase of around 31%. The deposit needed for a mean-priced home rose by 64% over the same period, from $135,495 to $222,220.
That gap shows why the time needed to save a deposit has increased, even as wages have continued to rise.
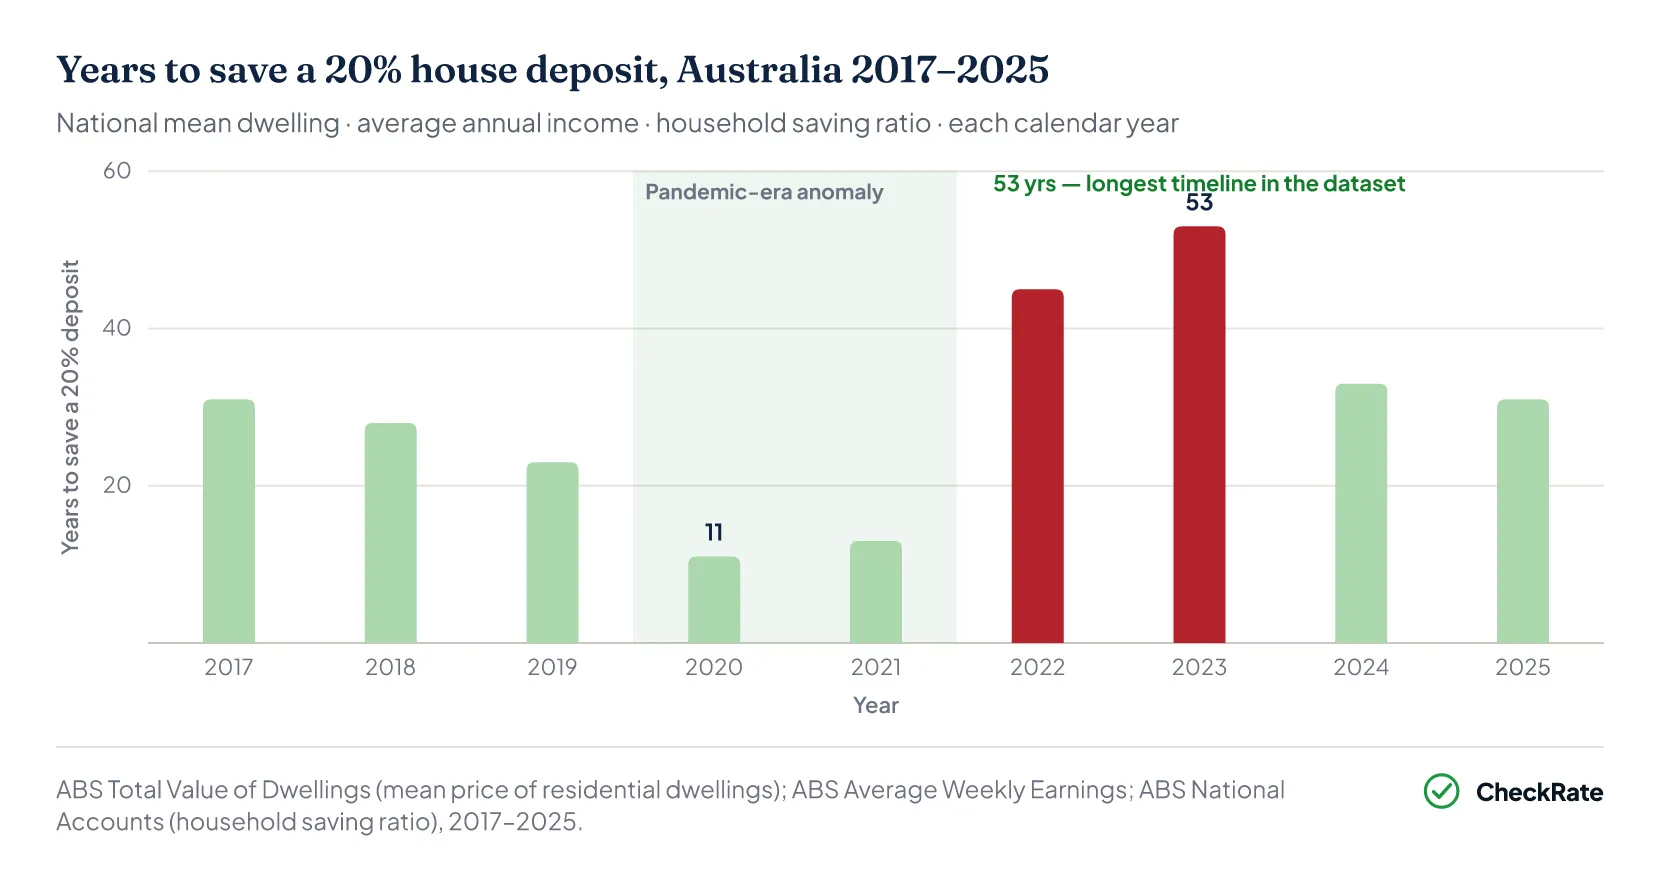
The 2023 result shows how quickly the deposit timeline can change when the saving rate falls. The deposit itself rose by about 1% in 2023, from $181,665 in 2022 to $184,020 in 2023. The larger change was the saving rate, which reduced estimated annual savings from $4,077 to $3,472.
By 2025, the household saving ratio had recovered to 6.1%, bringing the deposit timeline back to 31 years, close to the 31-year timeline recorded in 2017, even though the deposit required was higher in dollar terms. On the latest March 2026 data, the ratio edged up slightly to 6.2% over the quarter and mean prices rose further, extending the national timeline to 32 years.
Section 02 · Saving rate
How saving rates affect deposit timelines
The household saving ratio is a primary input in how long it takes to save a deposit. Between 2017 and 2025, it ranged from 3.3% to 13.9%, a span of more than four times. Across those years the estimated deposit-saving timeline moved between 11 years and 53 years, though that range reflects changes in dwelling prices as well as the saving rate.
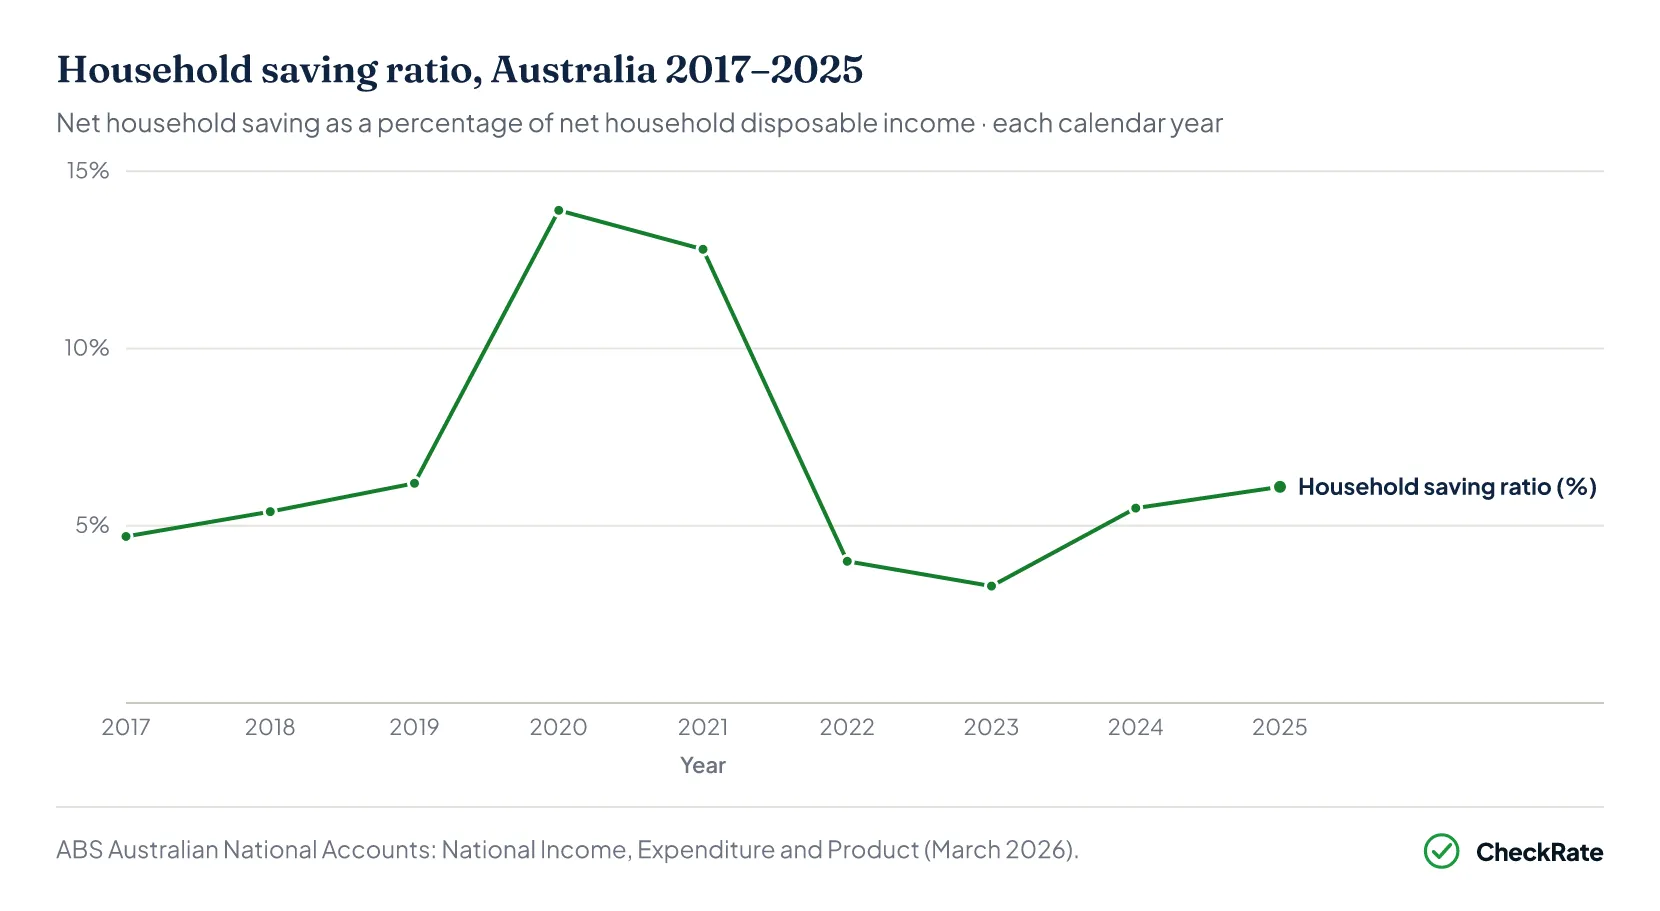
By 2025, the saving ratio had recovered to 6.1%, but it remained below the levels recorded during the COVID saving period. On the latest March 2026 data, it read 6.2% on a quarterly basis. That kept the national deposit-saving timeline well above the 11-year and 13-year estimates recorded in 2020 and 2021.
Section 03 · By state
Where you buy determines how long it takes to save
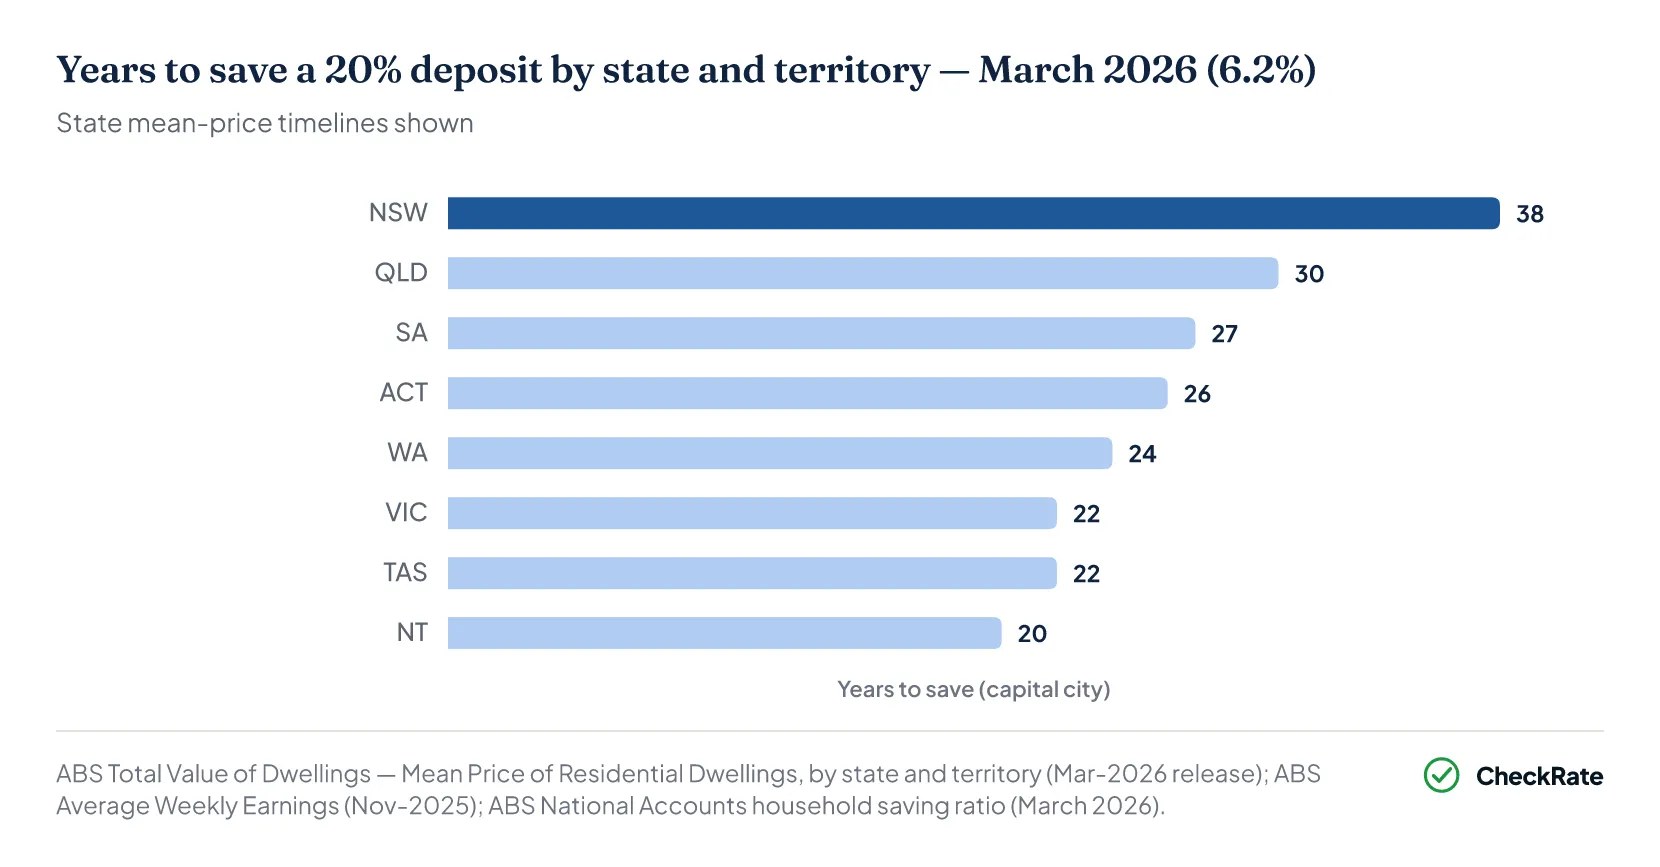
The national estimate of 32 years covers a wide range across the states. On the latest March 2026 figures, the deposit-saving timeline runs from 18 years in the Northern Territory to 38 years in New South Wales, a 20-year gap driven mostly by dwelling prices. The calculation applies the same national saving rate across all states and territories.
New South Wales has the longest estimate, while the Northern Territory has the shortest. Queensland is the only other state above the national 32-year estimate. Most other states and territories sit below the national figure because their mean dwelling prices, deposit thresholds or average earnings produce shorter timelines under the same calculation.
Section 04 · All states
House deposit saving time by state and territory
Deposit-saving times vary widely across Australia because mean dwelling prices and average earnings differ by state and territory. On the latest March 2026 figures, the estimated timeline ranges from 18 years in the Northern Territory to 38 years in New South Wales.
New South Wales and Queensland sit above the 32-year national estimate, while South Australia and Western Australia sit just below it at 30 years. Every other state and territory has a shorter estimated timeline under the same March 2026 saving-rate method.
| March 2026 - deposit-saving time by state and territory | ||||||
|---|---|---|---|---|---|---|
| State / territory | Mean price | 20% deposit | Annual saving | Years | Annual saving | Years to save |
| New South Wales | $1,324,800 | $264,960 | $6,932 | 38 | $7,462/yr | 12 |
| Queensland | $1,123,700 | $224,740 | $6,739 | 33 | $7,311/yr | 16 |
| South Australia | $973,100 | $194,620 | $6,476 | 30 | $8,372/yr | 16 |
| Western Australia | $1,103,500 | $220,700 | $7,415 | 30 | $7,570/yr | 17 |
| Victoria | $947,100 | $189,420 | $6,705 | 28 | $6,872/yr | 18 |
| Australian Capital Territory | $1,018,000 | $203,600 | $7,361 | 28 | $7,462/yr | 20 |
| Tasmania | $750,300 | $150,060 | $6,087 | 25 | $7,827/yr | 21 |
| Northern Territory | $597,300 | $119,460 | $6,609 | 18 | $7,609/yr | 21 |
| Australia | $1,111,100 | $222,220 | $6,933 | 32 | $7,570/yr | 22 |
Section 05 · Quarterly comparison
How the current timeline compares with the previous quarter
The figures above use the latest March 2026 data. A quarter earlier, in the December 2025 quarter, the household saving ratio was higher at 7.0%, compared with 6.2% in March 2026, and mean dwelling prices were lower. Both changes lengthened the deposit-saving timeline: nationally from 28 years in the December 2025 quarter to 32 years on the current figures, with every state and territory extending.
In the December 2025 quarter, at the higher 7.0% saving ratio, the estimated NSW annual saving amount was approximately $7,827 per year, against $6,932 at the current 6.2% rate. Combined with a lower mean price in that quarter, that produced a New South Wales timeline of 34 years, four years shorter than the current 38-year figure.
Between the December 2025 quarter and the current March 2026 figures, every state and territory extends by two to five years. Queensland and Western Australia recorded the largest increases, both rising by five years, while the Northern Territory recorded the smallest increase, rising by two years. The table below shows the December 2025 quarter starting figures for each market.
| December 2025 quarter, deposit-saving time by state and territory | ||||||
|---|---|---|---|---|---|---|
| State / territory | Mean price | 20% deposit | Annual saving | Years | Annual saving | Years to save |
| New South Wales | $1,319,500 | $263,900 | $7,827 | 34 | $6,609/yr | 14 |
| Queensland | $1,073,900 | $214,780 | $7,609 | 28 | $6,476/yr | 18 |
| South Australia | $938,700 | $187,740 | $7,311 | 26 | $7,415/yr | 18 |
| Victoria | $949,500 | $189,900 | $7,570 | 25 | $6,705/yr | 19 |
| Australian Capital Territory | $1,004,300 | $200,860 | $8,311 | 24 | $6,087/yr | 20 |
| Western Australia | $1,029,800 | $205,960 | $8,372 | 25 | $6,609/yr | 23 |
| Tasmania | $722,100 | $144,420 | $6,872 | 21 | $6,932/yr | 24 |
| Northern Territory | $578,800 | $115,760 | $7,462 | 16 | $6,739/yr | 24 |
| Australia | $1,088,800 | $217,760 | $7,827 | 28 | $6,087/yr | 24 |
The gap between the most and least affordable markets widens slightly under the lower saving rate. New South Wales at 38 years and the Northern Territory at 18 years are now 20 years apart, up from 18 years in the revised December 2025 quarter estimate. The widening is driven by both higher mean dwelling prices in the March quarter and the reduced saving capacity that applies across every state.
Section 06 · Policy
Policy pathways for first-home buyers
Government schemes can reduce the upfront deposit needed to buy a home or make it more tax-effective to save one. For eligible first-home buyers, this can shorten the time needed to reach a deposit.
First Home Guarantee
Eligible buyers can purchase with a minimum 5% deposit, with the government guaranteeing up to 15% of the property value so the buyer can avoid lenders mortgage insurance. On the national mean dwelling price, the deposit falls from $222,220 to approximately $55,555, a saving timeline of around 8 years at the current March 2026 rate.
First Home Super Saver Scheme
Up to $50,000 in eligible voluntary super contributions, capped at $15,000 per financial year, can be released toward a deposit. Concessional contributions are generally taxed at 15%, and the assessable FHSS released amount receives a 30% tax offset. For higher-income earners, the tax difference can be material, although the benefit depends on income, contribution type and release timing.
The two main federal pathways are the First Home Guarantee Scheme, which allows eligible buyers to purchase with a minimum 5% deposit, and the First Home Super Saver Scheme, which lets buyers use eligible voluntary super contributions toward a deposit. Both schemes have eligibility rules, property requirements and contribution limits that can change over time, so they may not apply to every buyer.
Section 07 · Scenario analysis
What changes the deposit-saving timeline?
The deposit-saving timeline changes when one of the inputs changes: the annual saving amount, the deposit size or the dwelling price used in the calculation. The examples below show how sensitive the estimate is to those inputs.
Note: The national figures used throughout this article are a baseline only. Individual saving capacity varies by income, household size, location and living costs.
Higher saving rates shorten the estimate
At the current March 2026 saving ratio of 6.2%, reaching the national mean deposit takes 32 years. At a 10% saving rate, the estimate falls to approximately 20 years. At 15%, it falls to around 13 years. Adding $400 a month would lift annual savings from about $6,933 to $11,733, cutting the estimated national timeline from 32 years to about 19 years.
Dwelling prices create the largest state gap
Mean dwelling prices vary widely between states and territories. Under the March 2026 method, the estimated timeline ranges from 18 years in the Northern Territory to 38 years in New South Wales. The difference reflects the deposit required in each market. A 20% deposit on the NSW mean dwelling price is $264,960, compared with $119,460 in the Northern Territory.
Smaller deposits reduce the upfront target but increase the loan size
A 20% deposit on the national mean dwelling price is $222,220. A 10% deposit would be $111,110, while a 5% deposit would be $55,555. A smaller deposit reduces the amount needed upfront, but increases the loan amount. On a $1,111,100 purchase, a 5% deposit leaves a loan of about $1,055,545 before transaction costs. Lenders mortgage insurance may also apply when a buyer borrows more than 80% of a property’s value without a government guarantee. These costs are not included in the deposit-saving timeline, which only measures the time needed to reach the deposit target.
First Home Super Saver Scheme outcomes depend on tax settings
The First Home Super Saver Scheme allows eligible buyers to use voluntary super contributions, capped at $15,000 per financial year and $50,000 in total, toward a home deposit. Concessional contributions are generally taxed at 15%, rather than the buyer’s marginal tax rate. The assessable FHSS released amount then receives a 30% tax offset. For a buyer on a 37% marginal tax rate, using the maximum $50,000 in concessional contributions could produce a tax difference of about $11,000 before release-tax effects and other individual factors. The exact outcome depends on contribution type, income, tax position and ATO release rules.
References
- ABS Total Value of Dwellings, March quarter 2026 · Australian Bureau of Statistics
- ABS, Average Weekly Earnings, Australia, Nov 2025 · Australian Bureau of Statistics
- ABS: Australian National Accounts: National Income, Expenditure and Product, March quarter 2026 · Australian Bureau of Statistics
- Housing Australia: Australian Government 5% Deposit Scheme (2025 expansion) · housingaustralia.gov.au