

Updated
- Home ownership rate
- 66%
- Owned outright + with mortgage
- Total private dwellings
- 10.85M
- 2021 Census, occupied
- Owned with mortgage
- 3.80M
- 35% of all dwellings
- Owned outright
- 3.36M
- 31% of all dwellings
 Australian mortgage statistics 2026Australia had about 9.3 million occupied private dwellings at the 2021 Census. Of these, around 3.24 million (35.0%) were owned with a mortgage, 2.87 million (31.0%) were owned outright, and 2.84 mill…
 Mortgage stress in Australia: how many households are affected? (2026)Mortgage stress is a term used when housing costs take up a large share of a household's income.
 How long does it take to save a house deposit in Australia?In the March 2026 quarter, Australia’s mean dwelling price reached $1,111,100, up from $677,475 in 2017. A 20% deposit on the national mean home is now $222,220.
Section 01 · Total homeowners
How many Australians own their home?
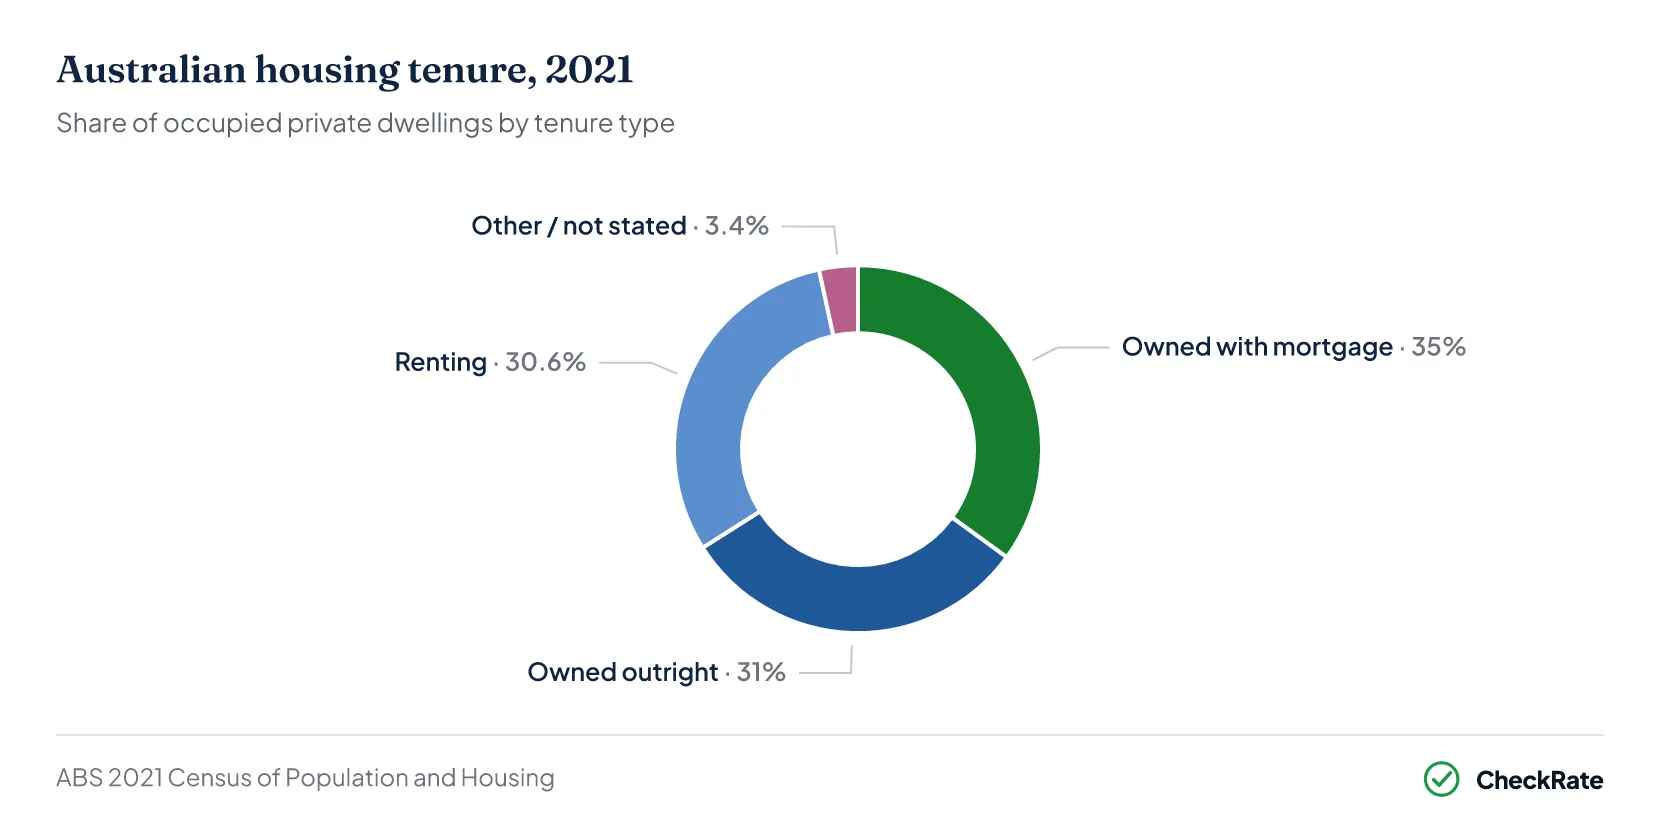
The 2021 Census counted 10,852,208 occupied private dwellings across Australia. Roughly two in three were owner-occupied, split almost evenly between households that own outright and those still paying off a mortgage. The remaining third rent, either privately or through public housing.
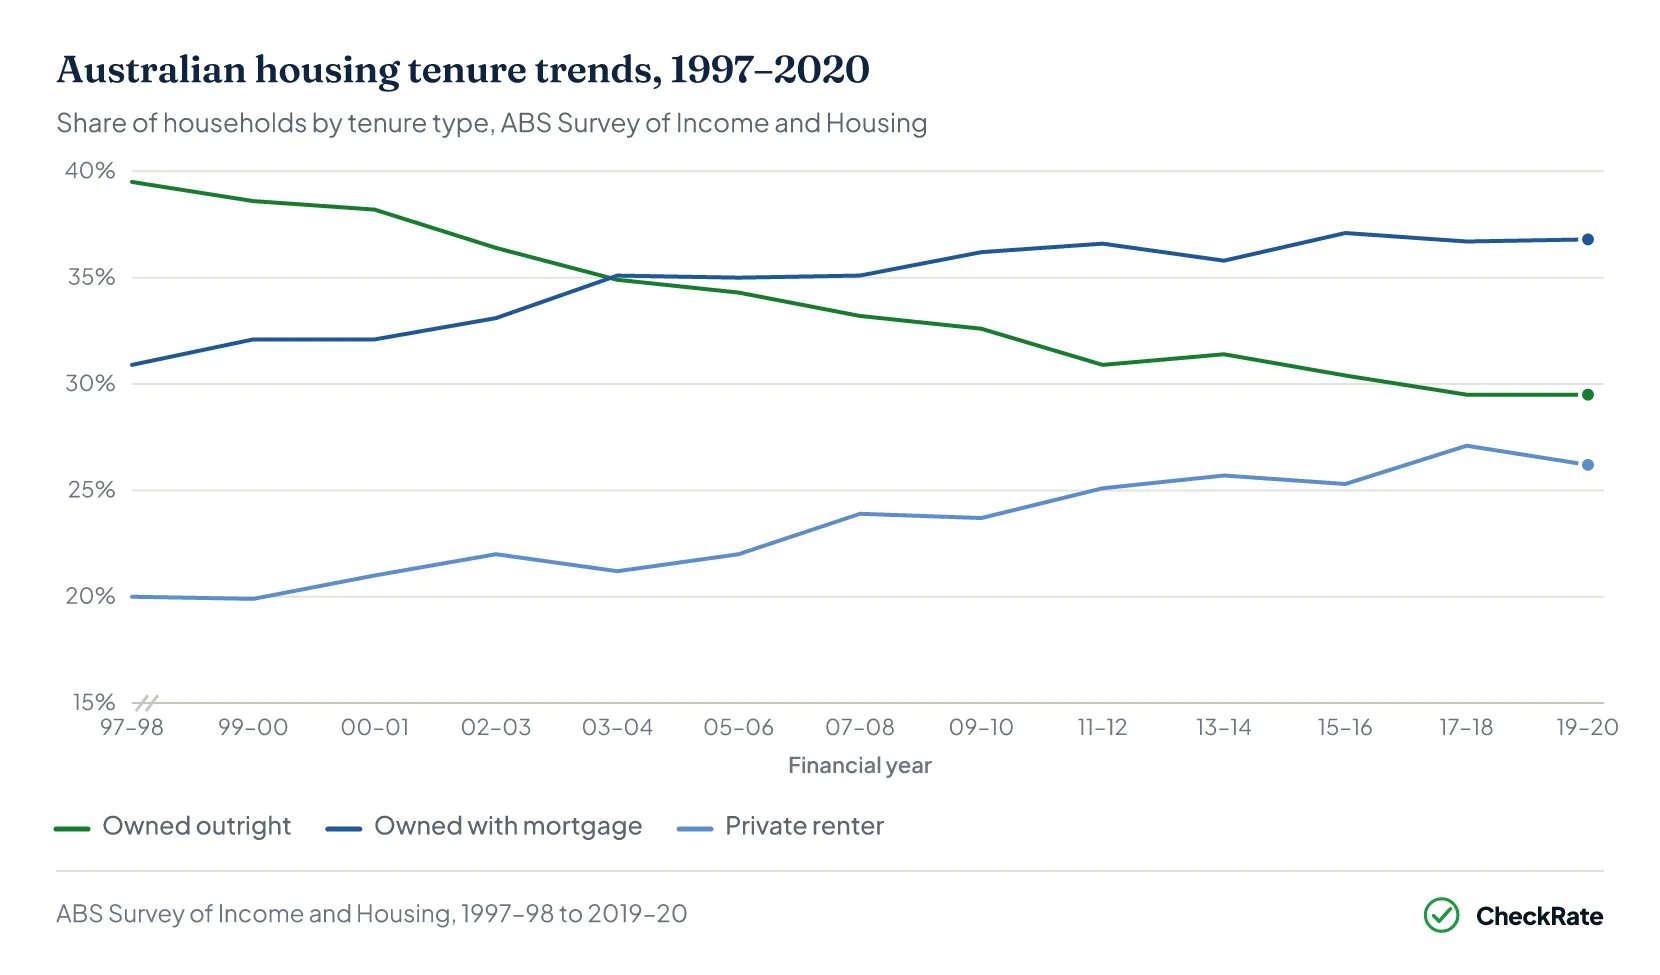
The combined home ownership rate of 66% was below the roughly 70% recorded in the early 1980s. Outright ownership has fallen over the longer term, while mortgage ownership has become more common. Since 2003, more households have owned their homes with a mortgage than have owned their homes outright.
- around 70%
- Home ownership rate in the early 1980s
- 66%
- Home ownership rate, 2021 Census
- 39.5%
- Outright owners in 1997–98
- 29.5%
- Outright owners in 2019–20
Outright ownership has fallen 10 percentage points over roughly two decades. More Australians now own their home with a mortgage than own it outright.
Is Australia's home ownership rate falling?
Yes. Australia's home ownership rate was 66% at the 2021 Census, below the roughly 70% recorded in the early 1980s. Outright ownership has fallen the most, dropping from 39.5% in 1997–98 to 29.5% in 2019–20. Over the same period, mortgage ownership became more common.
Section 02 · Mortgage holders
How many Australians have a mortgage?
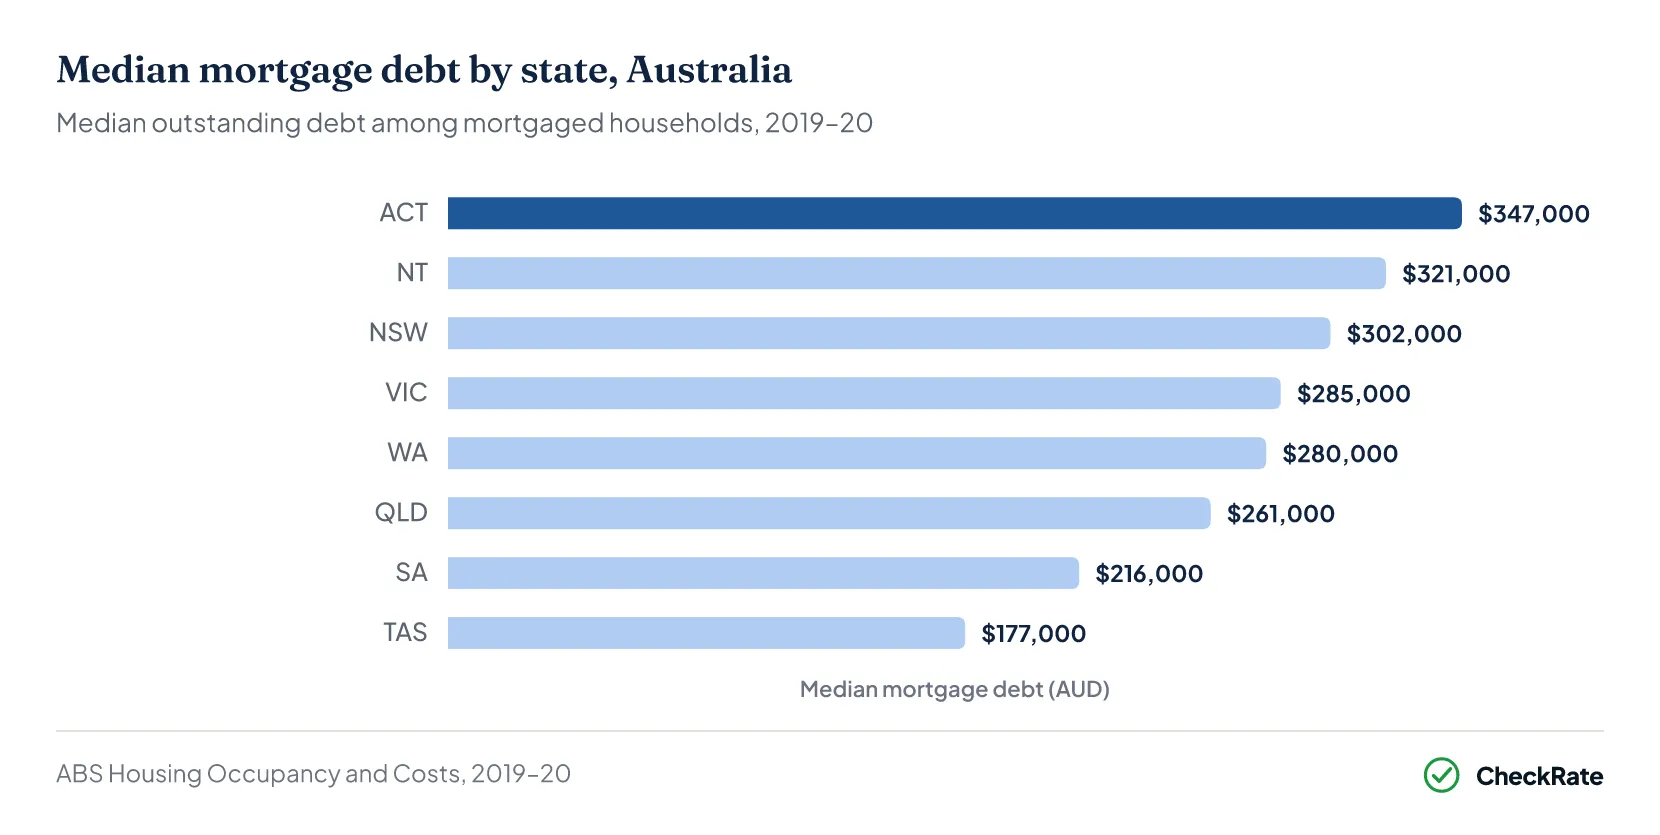
Around 3.8 million households, or 35% of all occupied private dwellings, owned their home with a mortgage at the 2021 Census. The national median outstanding mortgage debt was $275,000 in 2019–20, with weekly housing costs averaging $493, equal to about 16% of gross household income.
In 1997–98, outright ownership was 39.5% and mortgage ownership was 30.9%. By 2019–20, outright ownership had dropped to 29.5%, while mortgage ownership had risen to 36.8%. Private renting also increased, from 20% to 26.2% over the same period.
New lending fell in the March quarter 2026 after rising through 2025. ABS Lending Indicators show 139,794 new dwelling loan commitments in the March quarter 2026, seasonally adjusted and excluding refinancing, down 6.2% from the December quarter 2025 but still 8.6% higher than a year earlier. Owner-occupier commitments fell 6.9% over the quarter, investor commitments fell 5.3%, and owner-occupier first home buyer commitments fell 4.3%. The average new loan size across all dwelling commitments was $724,415 nationally in the March quarter 2026, up 9.0% from a year earlier. Among owner-occupier loans specifically, the average was about $735,000.
What percentage of Australian homeowners have a mortgage?
Based on the 2021 Census, 35% of all occupied private dwellings were owned with a mortgage, covering around 3.8 million households. The median outstanding debt was $275,000 nationally in 2019–20, and weekly housing costs averaged $493, about 16% of gross household income. New loan sizes have grown since then, with the average new owner-occupier loan reaching about $735,000 nationally in the March quarter 2026.
Section 03 · Who is buying
Who is buying homes in Australia?
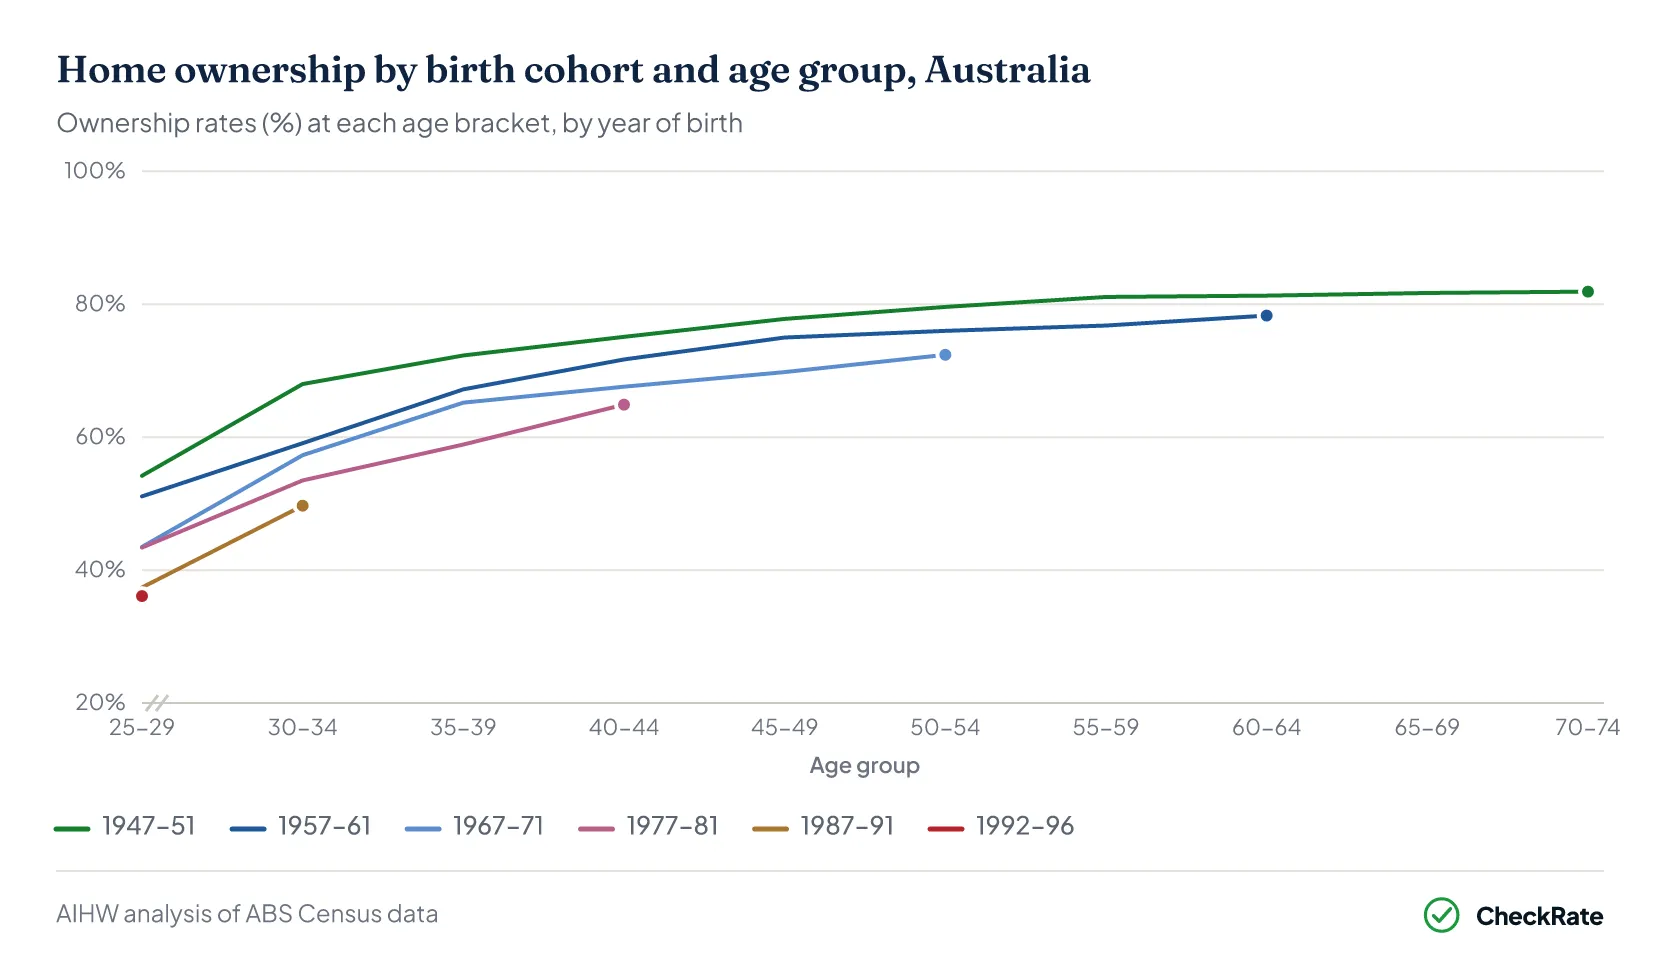
Age is the strongest driver of home ownership in Australia. Ownership rises sharply through people's 30s and 40s, then levels out in their 60s and 70s. Every generation born since the mid-1950s has reached each age group with lower ownership rates than the generation before.
Australians born between 1947 and 1951 reached a 54.2% home ownership rate at ages 25–29. Those born from 1992 to 1996 had reached just 36.1% at the same stage of life, an 18-percentage-point gap. This may reflect rising prices, larger deposits and longer mortgage terms, pushing the ownership timeline back for each successive generation.
Born 1947–51 (at age 25–29)
- 54.2%
Home ownership rate for the post-war generation entering their late 20s
Born 1992–96 (at age 25–29)
- 36.1%
Home ownership rate for millennials and Gen Z at the same life stage, 18 pp below the post-war generation
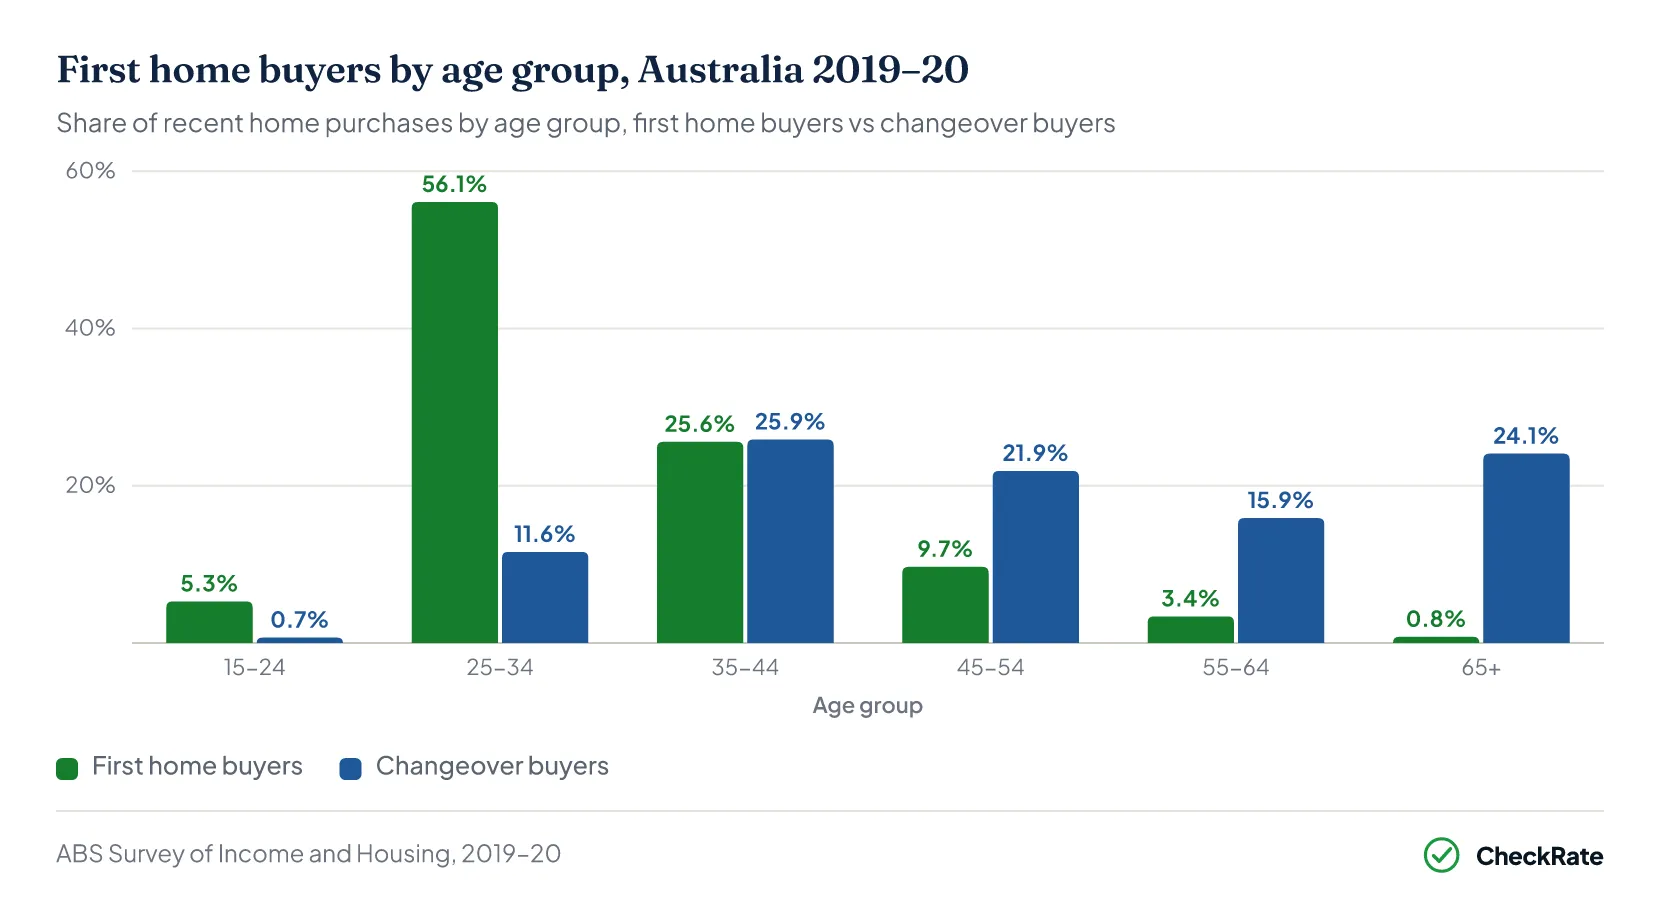
56.1% of first home buyers who purchased in the three years to 2019–20 were aged between 25 and 34, up from 49.6% in 2017–18. The share under 25 remained small at 5.3%, consistent with the income and savings thresholds required for mortgage approval.
Changeover buyers are usually older. Around 24% of changeover purchases in 2019–20 were made by households aged 65 or over, likely reflecting retirees using built-up home equity to downsize rather than buying for investment.
What age do most Australians buy their first home?
According to the ABS Survey of Income and Housing 2019–20, 56.1% of first home buyers were aged 25–34, while only 5.3% were under 25. This may reflect the high deposits and income usually needed to get a mortgage. Buying a first home is happening later with each generation, and younger Australians now have lower ownership rates at ages 25–29 than any earlier generation on record.
Section 04 · Dwelling types
What types of homes do Australians live in?
Of Australia's 10.85 million occupied private dwellings, separate houses make up the majority. The 2021 Census counted 7.7 million separate houses, equal to roughly 71% of all homes. High-density apartments in buildings of nine or more storeys accounted for 394,303 homes nationally, concentrated mainly in NSW and Victoria.
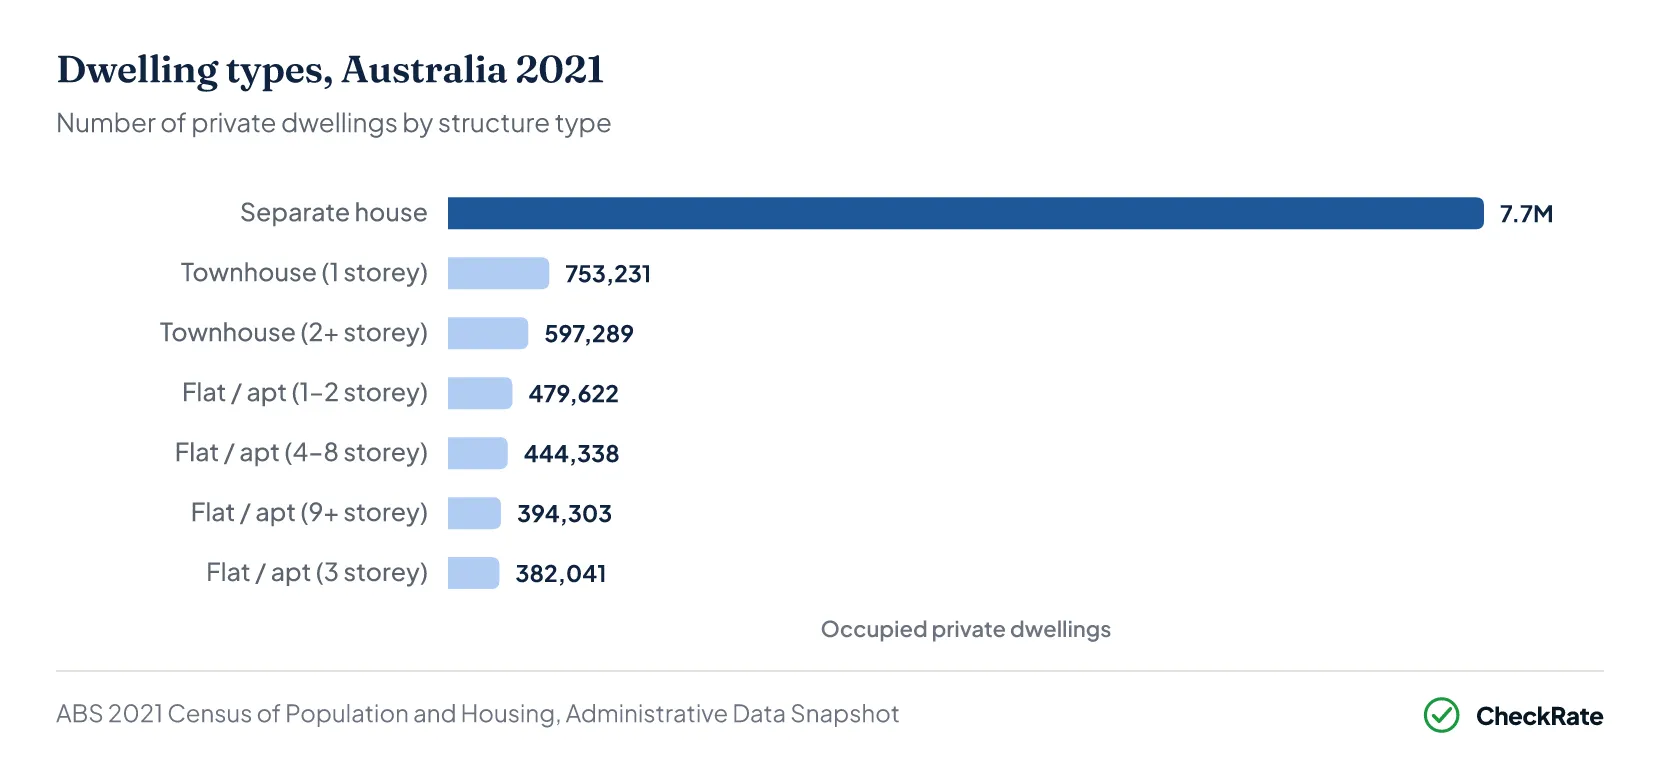
The state breakdown shows how housing types vary across Australia. New South Wales had the highest share of flats and apartments, partly reflecting Sydney's higher-density housing mix. Western Australia and Queensland had larger detached-house shares, while Victoria stood out for medium-density housing. The 2021 Census counted 237,779 one-storey townhouses in Victoria, more than any other state.
Section 05 · State by state
Which Australian states have the highest home ownership rates?
Home ownership is not evenly spread across Australia, with clear differences between states and territories. Rates range from 59% in the Northern Territory to 69.3% in Western Australia. The Northern Territory, Western Australia and the ACT have the highest shares of mortgaged households.
New South Wales
- TOTAL OWNERSHIP
64%
- WITH MORTGAGE
34%
- WEEKLY COST (MORTGAGE)
$574
Victoria
- TOTAL OWNERSHIP
68%
- WITH MORTGAGE
37%
- WEEKLY COST (MORTGAGE)
$501
Queensland
- TOTAL OWNERSHIP
64%
- WITH MORTGAGE
36%
- WEEKLY COST (MORTGAGE)
36%
South Australia
- TOTAL OWNERSHIP
69%
- WITH MORTGAGE
39%
- WEEKLY COST (MORTGAGE)
$390
Western Australia
- TOTAL OWNERSHIP
69.3%
- WITH MORTGAGE
42.7%
- WEEKLY COST (MORTGAGE)
$443
Tasmania
- TOTAL OWNERSHIP
68%
- WITH MORTGAGE
35%
- WEEKLY COST (MORTGAGE)
$346
Northern Territory
- TOTAL OWNERSHIP
59%
- WITH MORTGAGE
43%
- WEEKLY COST (MORTGAGE)
$534
Australian Capital Territory
- TOTAL OWNERSHIP
69%
- WITH MORTGAGE
42%
- WEEKLY COST (MORTGAGE)
$546
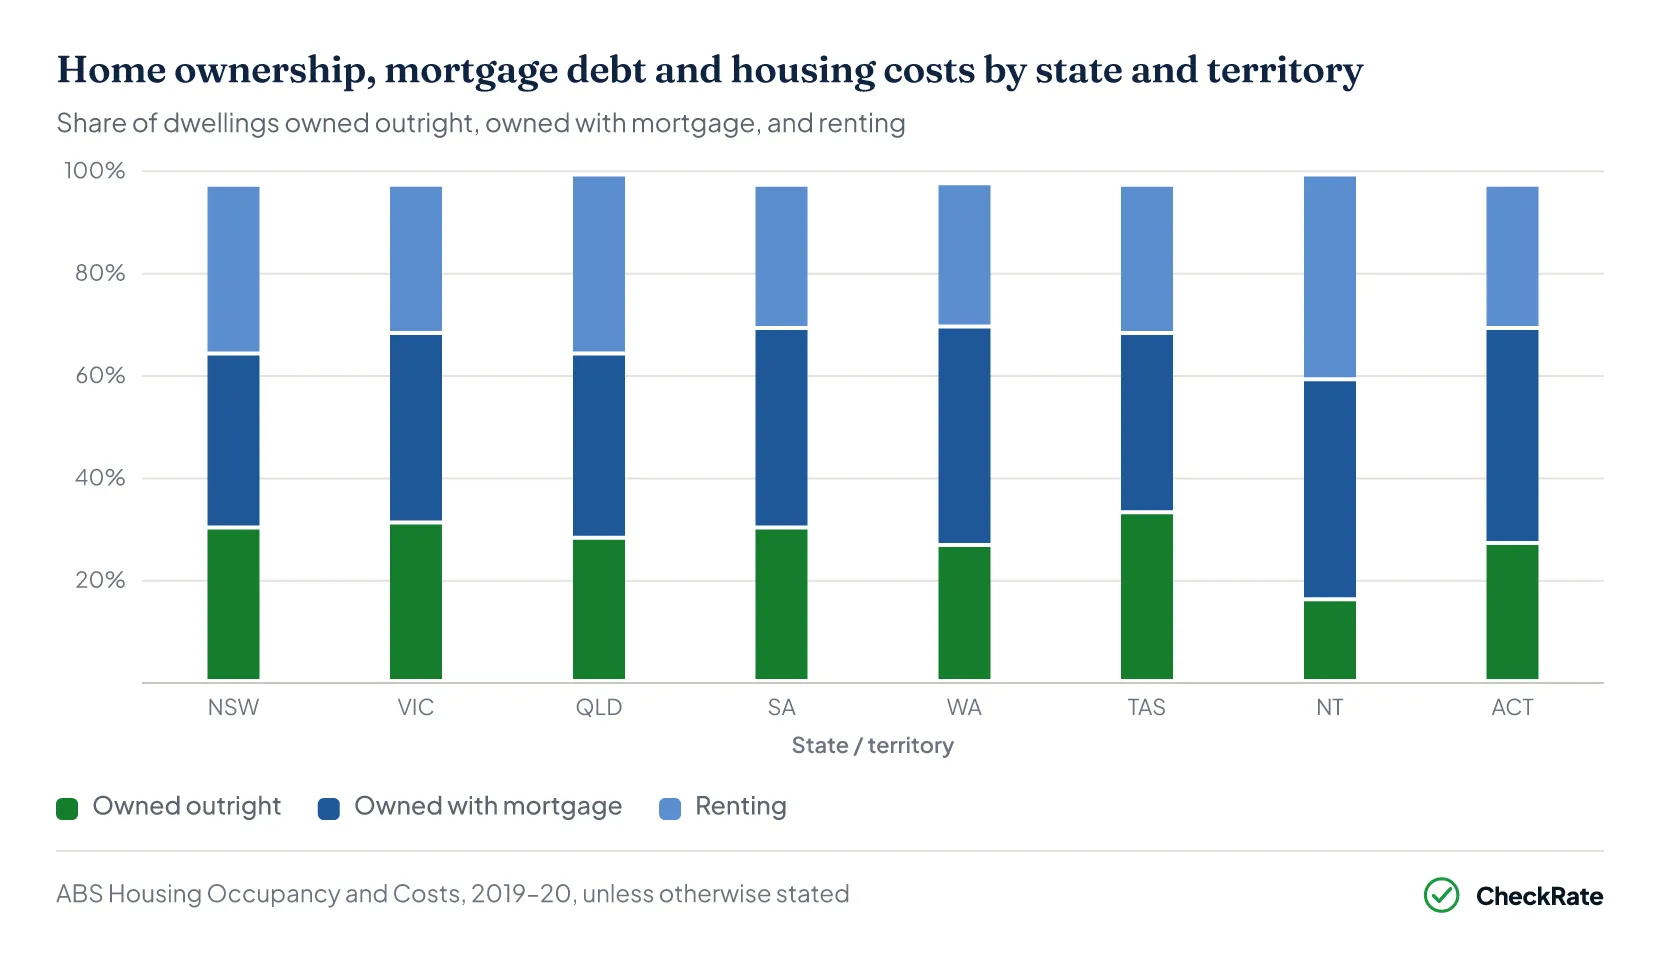
| State / territory | Ownership | Mortgaged | Outright | Renting | Median mortgage | Cost % of income |
|---|---|---|---|---|---|---|
| New South Wales | 64% | 34% | 30% | 33% | $302,000 | 17% |
| Victoria | 68% | 37% | 31% | 29% | $285,000 | 16% |
| Queensland | 64% | 36% | 28% | 35% | $261,000 | 15% |
| South Australia | 69% | 39% | 30% | 28% | $216,000 | 14% |
| Western Australia | 69.3% | 42.7% | 26.6% | 28% | $280,000 | 14% |
| Tasmania | 68% | 35% | 33% | 29% | $177,000 | 15% |
| Northern Territory | 59% | 43% | 16% | 40% | $321,000 | 16% |
| Australian Capital Territory | 69% | 42% | 27% | 28% | $347,000 | 16% |
| Australia (national) | 66% | 35% | 31% | 30.6% | $275,000 | 16% |
Source · ABS Housing Occupancy and Costs, 2019–20; ABS 2021 Census of Population and Housing for national tenure totals.
- Northern Territory: the NT has the lowest overall ownership rate at 59% and the highest rental rate at 40%, reflecting the large share of public and community housing in remote areas. Among NT owners, 43% still carry a mortgage, and the median debt of $321,000 is the second highest nationally.
- Western Australia: WA had the highest ownership rate at 69.3%, which may partly reflect Perth's historically more affordable land prices and higher proportion of detached housing. However, that gap is narrowing. Perth's median established house transfer price rose from $660,000 in the December quarter 2023 to $1,000,000 in the March quarter 2026, a 52% increase in just over two years.
- Tasmania: Tasmania has a 68% home ownership rate and records the lowest median mortgage debt at $177,000 and the lowest average weekly cost at $346. However, housing costs still represent 15% of gross income, in line with the national average, because lower wages reduce much of the cost advantage.
- ACT: the ACT has a 69% home ownership rate, along with the highest median outstanding mortgage at $347,000 and the highest weekly mortgage cost at $546, reflecting Canberra's high property values and above-average incomes among government-sector households.
- Queensland and NSW: both sit at 64% ownership and share the lowest ownership rates among the mainland states. NSW also has the highest share of renters at 33% and the highest mortgage cost as a share of income at 17%.
Which Australian state has the highest home ownership rate?
Western Australia had the highest home ownership rate at 69.3%, followed by South Australia and the Australian Capital Territory, both at 69%. The Northern Territory had the lowest overall rate at 59% and the highest rental rate at 40%. Among all states and territories, Tasmania had the lowest median mortgage debt, at $177,000, while the Australian Capital Territory had the highest, at $347,000.
Section 06 · Affordability
How affordable is it to buy a home in Australia?
Saving a deposit can take decades in every capital city, but the timeframe depends heavily on where a household is buying. Based on one full-time income, the March quarter 2026 household saving ratio of 6.2% and a 20% deposit, the time needed to save ranges from around 23 years in Darwin to close to 43 years in Sydney.
The household saving ratio has moved between roughly 6% and 7% over the past year and sat at 6.2% in the March quarter 2026, down from 7.0% in the December quarter 2025. A lower saving rate lengthens the estimate because less income is assumed to be saved each year. Capital-city house prices also remained high relative to full-time earnings in early 2026, keeping deposit-saving timelines long across every capital.
- Sydney
- 42.9yrs
- Years to save a 20% deposit in Sydney on a single income, the longest of any capital city
- Darwin
- 22.8yrs
- The most accessible capital, on the same basis
- Sydney price-to-income
- 13×
- Sydney's median established house versus a single full-time annual wage
- Household saving ratio
- 6.2%
- March 2026, assumed throughout
Estimate based on one full-time income at the state average full-time wage, a 6.2% household saving ratio and a 20% deposit on the capital-city median established-house transfer price. The estimate does not account for tax, rent, living costs, stamp duty, grants, investment returns or dual incomes. Source: ABS dwelling prices (6432.0), average weekly earnings (6302.0, November 2025), National Accounts saving ratio (March 2026).
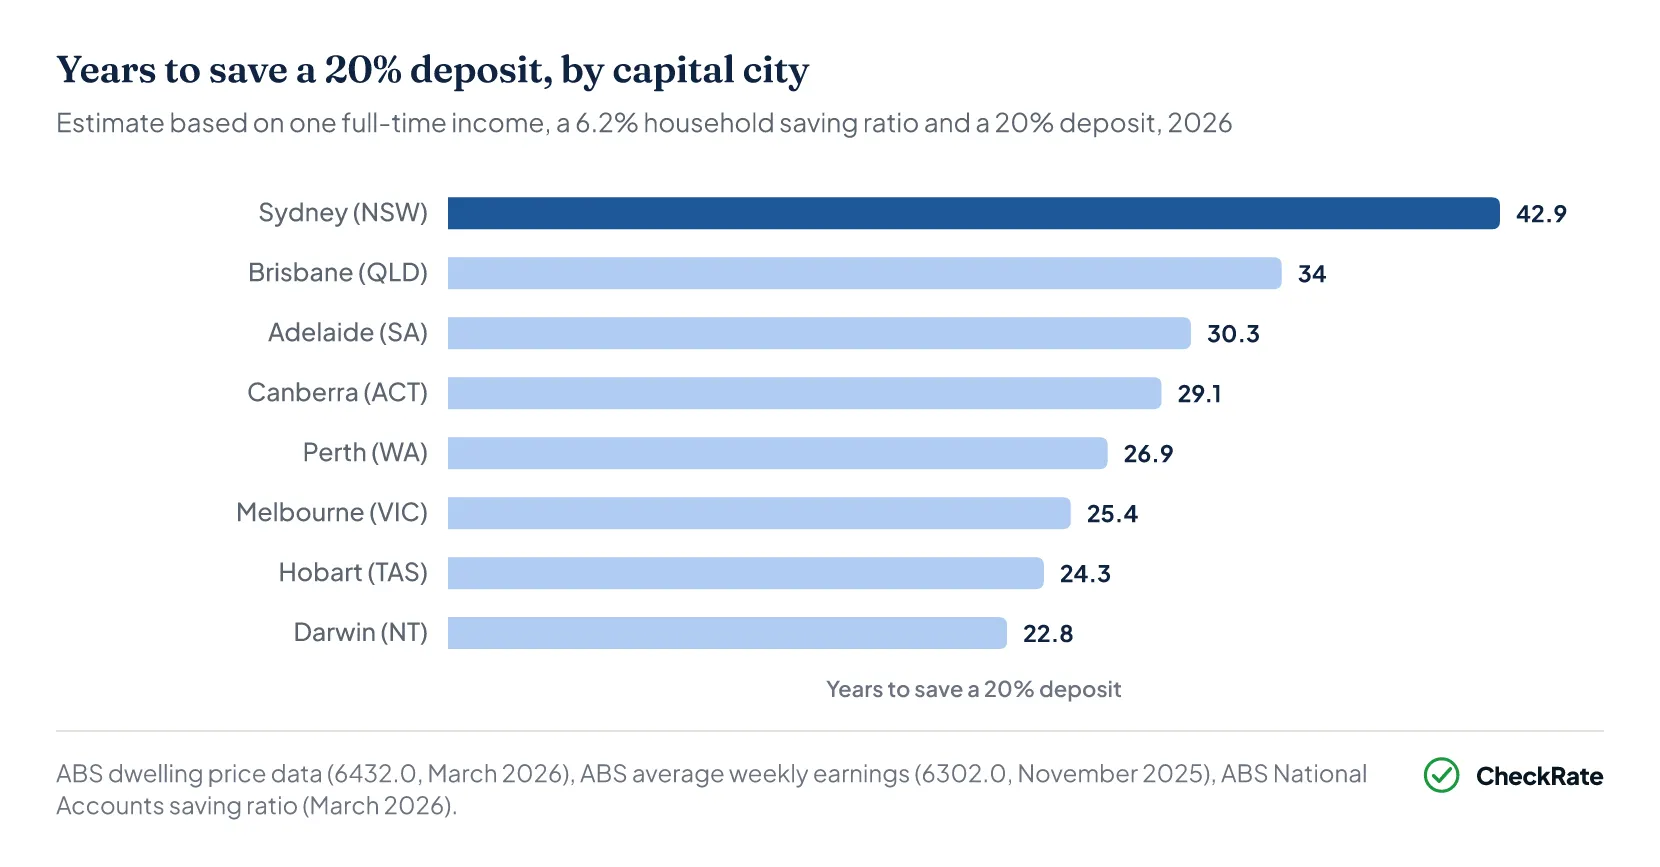
Government programmes, including the First Home Guarantee, shared equity schemes and state-based stamp duty concessions, are designed to reduce upfront costs for eligible buyers. However, the deposit estimates show that high house prices relative to full-time earnings remain a major affordability barrier across every capital city.
How long does it take to save for a house deposit in Australia?
It depends heavily on the city. Based on one full-time income, the March quarter 2026 household saving ratio of 6.2% and a 20% deposit, saving for a house deposit takes around 43 years in Sydney. Brisbane is about 34 years, Adelaide 30, Canberra 29, Perth 27, Melbourne 25 and Hobart 24. Darwin has the shortest timeframe, at roughly 23 years. The estimate does not account for tax, rent, living costs, stamp duty, grants, investment returns or dual incomes.
References
- Australian Bureau of Statistics — Housing: Census, 2021 · Australian Bureau of Statistics
- ABS Housing Occupancy and Costs, 2019-20 financial year · Australian Bureau of Statistics
- AIHW: Home ownership and housing tenure · aihw.gov.au
- Lending Indicators, June Quarter 2026, Table 24, cat. 5601.0 · Australian Bureau of Statistics
- ABS Total Value of Dwellings, March quarter 2026 · Australian Bureau of Statistics
- ABS: Australian National Accounts: National Income, Expenditure and Product, March quarter 2026 · Australian Bureau of Statistics
- ABS, Average Weekly Earnings, Australia, Nov 2025 · Australian Bureau of Statistics
- RBA, Lenders' Interest Rates (Statistical Table F6) — housing rates, February 2026 · Reserve Bank of Australia