

Published
 Australian wealth statistics: net worth, assets and the wealth gapThat gap is not new. When both figures were last measured together in 2019–20, average household net worth was $1.04 million, while the median was $579,200. By 2024, the average had risen to $1.58 mil…
 Savings account rates in Australia: the average rate vs the headline rateIn July 2026, the average bonus savings rate at the five largest banks was 4.80 per cent, assuming all bonus conditions were met. The average online savings rate at prominent providers was 3.10 per ce…
 Term deposit rates in Australia: current rates and historyThe Reserve Bank publishes monthly averages of the five largest banks' term deposit rates for a $10,000 deposit. In July 2026, the average across all terms was 3.60 per cent. The five published terms…
Section 01 · current
What is the current RBA cash rate?
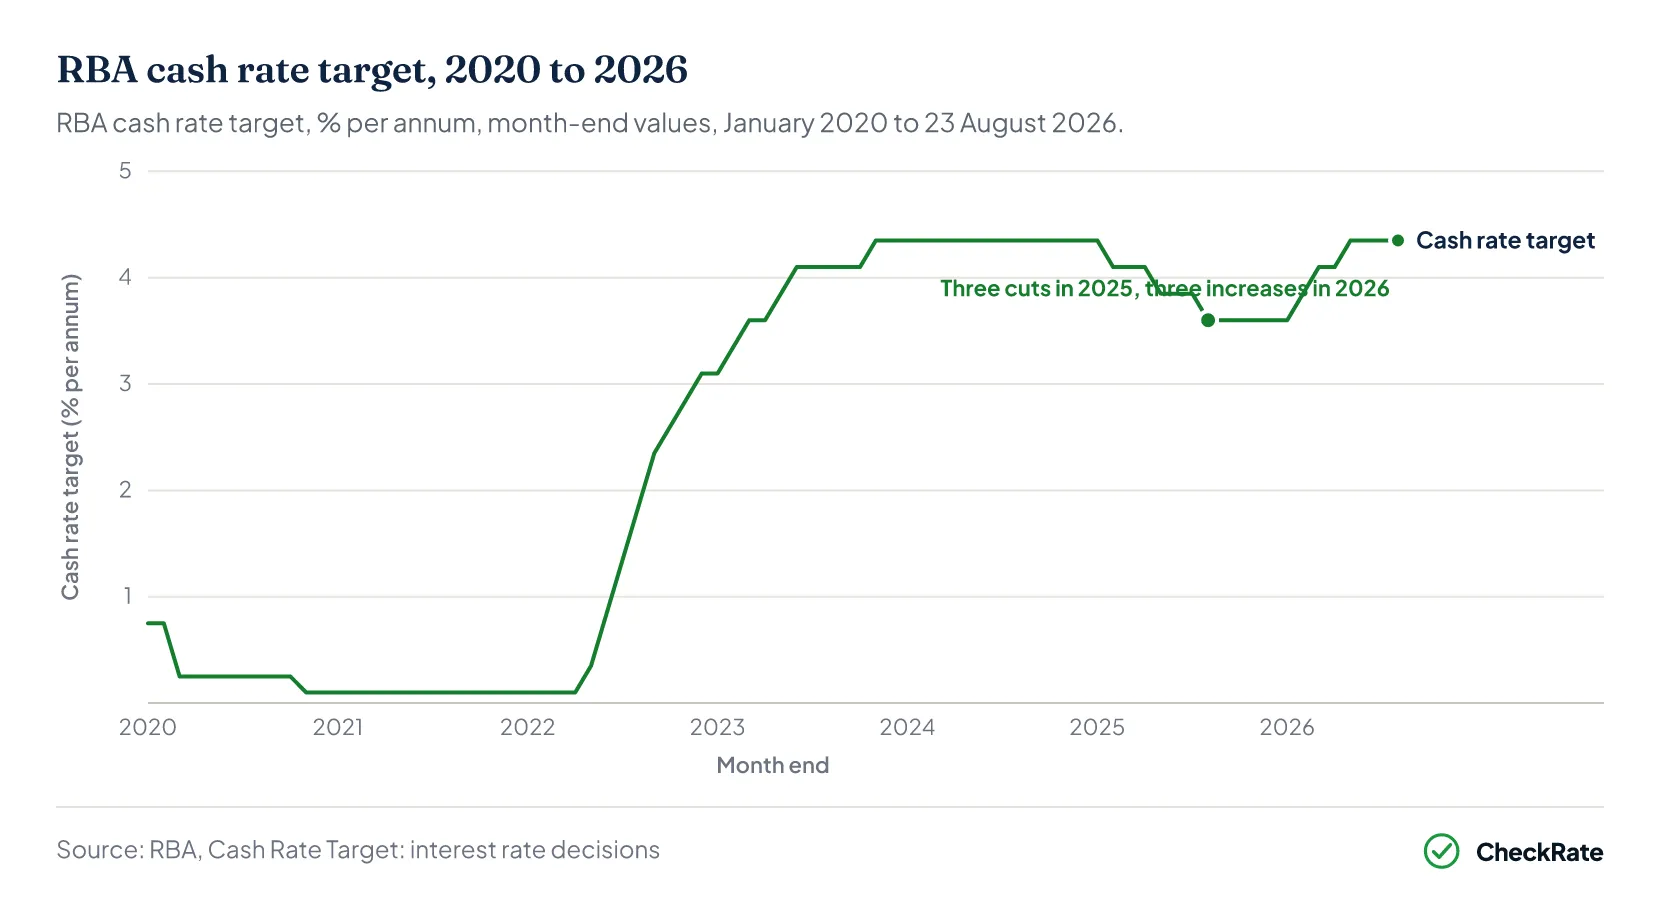
The Monetary Policy Board left the cash rate target unchanged at 4.35 per cent at its August 2026 meeting1. The Board said financial conditions had tightened following three cash rate increases in 2026, while headline inflation remained too high.
The target rose from 3.60 to 3.85 per cent effective 4 February 2026, to 4.10 per cent effective 18 March 2026, and to 4.35 per cent effective 6 May 2026, each a 0.25 percentage point step2. In February, the Board said inflation had picked up materially during the second half of 20253. By May, it said the conflict in the Middle East had resulted in sharply higher fuel and related commodity prices, adding to inflation4.
The target previously reached 4.35 per cent on 8 November 2023 and stayed there for 469 days, before a cut took effect on 19 February 20252. The Monetary Policy Board's remaining 2026 meetings are on 28 and 29 September, 2 and 3 November, and 7 and 8 December, with each outcome announced at 2.30 pm on the second day5. Any change to the target takes effect the day after it is announced6.
Section 02 · Decisions
How does the RBA decide the cash rate?
The Monetary Policy Board sets the cash rate target at its eight scheduled meetings each year. The cash rate is the interest rate on unsecured overnight loans between banks2. The cash rate target is the level the Monetary Policy Board sets for it at each of its meetings6. The Reserve Bank says the cash rate strongly influences other interest rates and forms the base of the interest-rate structure in the economy.
The objectives behind each decision are set by law. Under the Reserve Bank Act 1959, as amended in 2024, the Reserve Bank's overarching objective is to promote Australia's economic prosperity and welfare, while monetary policy is directed at price stability and the maintenance of full employment in Australia6. Since the early 1990s, those objectives have found practical expression in a target for consumer price inflation of 2–3 per cent a year. The Reserve Bank dates the earliest references to this approach to speeches by the then Governor in August 1992 and in March and August 1993.
Since February 2024, the Board has met eight times a year rather than monthly, over two days, with the outcome announced at 2.30 pm on the second day7. The Governor holds a media conference after each meeting to explain the decision6. Before December 2007, the Reserve Bank issued a media release only when the target was changed2.
How changes in the cash rate flow through to what banks charge business borrowers is covered in the business loan interest rate statistics.
Section 03 · Since 1990
How has the cash rate changed since 1990?
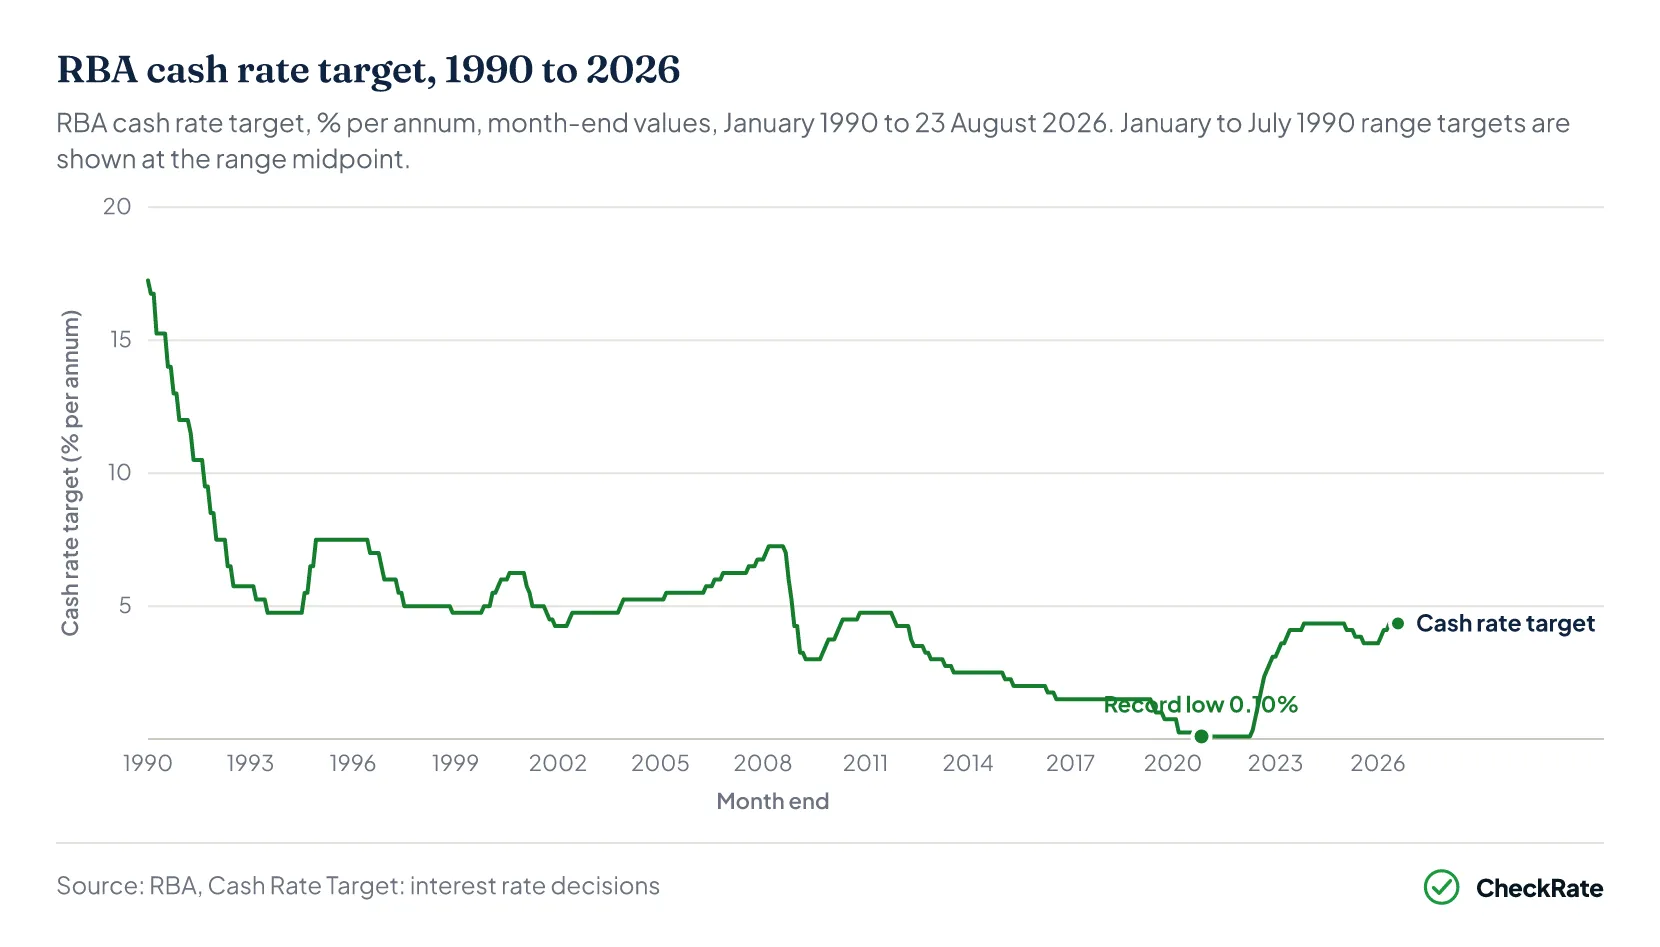
The Reserve Bank's published decisions series opens on 23 January 1990, with the target at a range of 17.00 to 17.50 per cent. The opening entry is itself recorded as a cut2. The published series records 97 changes between 23 January 1990 and 23 August 2026: 43 increases and 54 cuts. Until August 1990 the target was announced as a range. From the 14.00 per cent entry effective 2 August 1990, every target has been a single value.
The target fell from the opening range to 4.75 per cent by July 1993, then rose to 7.50 per cent by December 1994. It stayed between 4.25 and 7.50 per cent until the cuts of 2008 and 2009 took it to 3.00 per cent. After returning to 4.75 per cent by November 2010, it fell in steps to the record low of 0.10 per cent in November 2020. It then rose to 4.35 per cent by November 2023, fell to 3.60 per cent across 2025, and returned to 4.35 per cent in May 20262.
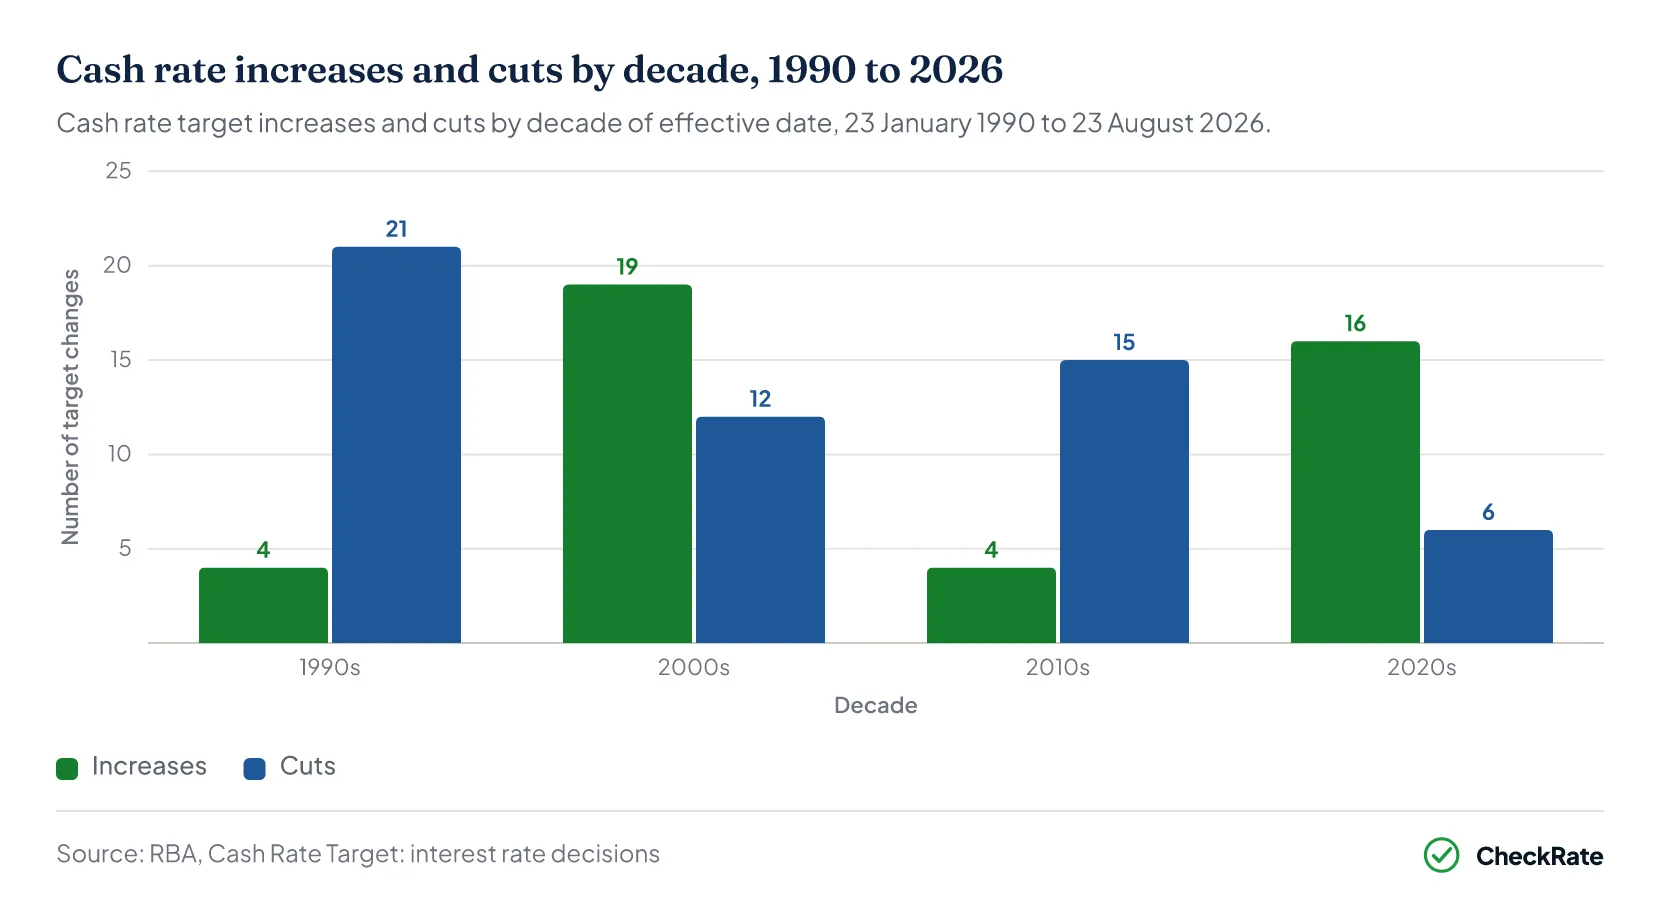
The pace of change differed by decade. The 2000s had the most changes of any decade, 31, compared with 25 in the 1990s, 19 in the 2010s and 22 in the 2020s to 23 August 20262. Cuts outnumbered increases 21 to 4 in the 1990s and 15 to 4 in the 2010s. Increases outnumbered cuts 19 to 12 in the 2000s and 16 to 6 in the 2020s.
Section 04 · Records
What are the cash rate's record highs, lows, longest holds and biggest moves?
The published cash rate series ranges from a high of 17.00 to 17.50 per cent to a low of 0.10 per cent. The longest hold lasted 1,036 days at 1.50 per cent, while the largest single-value moves were one percentage point.
The series opened at the 17.00 to 17.50 per cent range on 23 January 1990. The highest single-value target was 14.00 per cent, effective 2 August 1990, and the highest level since 2000 was 7.25 per cent, held from March to September 20082. The series does not cover the period before 23 January 1990.
The 0.10 per cent target took effect on 4 November 2020.2 It was announced as part of a wider pandemic package: the same decision cut the target for the yield on the three-year Australian Government bond to around 0.1 per cent, cut the Term Funding Facility rate to 0.1 per cent, and announced the purchase of $100 billion of government bonds8. The 0.10 per cent target stayed in place for 546 days, until an increase took effect on 4 May 20222.
The 1.50 per cent target remained unchanged for 1,036 days, or about 34 months, between a cut effective 3 August 2016 and a cut effective 5 June 2019. The second longest lasted 595 days at 7.50 per cent from December 1994. The third longest is a tie. The holds at 2.50 per cent from August 2013 and 0.10 per cent from November 2020 each lasted 546 days2.
| Longest cash rate target holds, Australia, 1990 to 2026 | |||
|---|---|---|---|
| Target level | Held from (effective) | Held until (next change effective) | Days |
| 1.50% | 3 August 2016 | 5 June 2019 | 1,036 |
| 7.50% | 14 December 1994 | 31 July 1996 | 595 |
| 2.50% | 7 August 2013 | 4 February 2015 | 546 |
| 0.10% | 4 November 2020 | 4 May 2022 | 546 |
| 4.75% | 5 June 2002 | 5 November 2003 | 518 |
Source · RBA, Cash Rate Target: interest rate decisions
There were 11 one-percentage-point cuts: eight between August 1990 and May 1992, and three between October 2008 and February 2009.2 There were two such increases, in October and December 1994. Since February 2009, no single change has been larger than 0.50 percentage points. Five changes reached that size: a cut effective 2 May 2012, and the four consecutive increases of June to September 2022.
| Cash rate changes of a full percentage point, Australia, 1990 to 2026 | ||
|---|---|---|
| Effective date | Change (points) | New target (%) |
| 2 August 1990 | −1.00 | 14.00 |
| 15 October 1990 | −1.00 | 13.00 |
| 18 December 1990 | −1.00 | 12.00 |
| 16 May 1991 | −1.00 | 10.50 |
| 3 September 1991 | −1.00 | 9.50 |
| 6 November 1991 | −1.00 | 8.50 |
| 8 January 1992 | −1.00 | 7.50 |
| 6 May 1992 | −1.00 | 6.50 |
| 24 October 1994 | +1.00 | 6.50 |
| 14 December 1994 | +1.00 | 7.50 |
| 8 October 2008 | −1.00 | 6.00 |
| 3 December 2008 | −1.00 | 4.25 |
| 4 February 2009 | −1.00 | 3.25 |
Source · RBA, Cash Rate Target: interest rate decisions
Section 05 · Cycles
What were the major cash rate cycles since 1990?
Grouping the changes into runs of consecutive moves in the same direction, with holds not breaking a run, gives 12 runs. Every one of the 97 changes belongs to one of them2. The six cuts between 3 September 2008 and 8 April 2009 took the target from 7.25 to 3.00 per cent.
In October 2008, the RBA said international financial conditions had deteriorated sharply in September, including large-scale financial failures in several major countries9. The largest tightening in points was the 13 increases from May 2022 to November 2023, which took the target from 0.10 to 4.35 per cent2. When the tightening cycle began in May 2022, the RBA said monetary support introduced during the pandemic was beginning to be withdrawn as inflation had risen faster and higher than expected10.
The two most recent runs match in size and number. Three 0.25 point cuts, effective 19 February, 21 May and 13 August 2025, took the target from 4.35 to 3.60 per cent.2 Three 0.25 point increases, effective 4 February, 18 March and 6 May 2026, took it back to 4.35 per cent.
| Runs of consecutive same-direction cash rate changes, Australia, 1990 to 2026 | |||
|---|---|---|---|
| Run (effective dates) | Moves | Target went | Net change (points) |
| 23 Jan 1990 to 30 Jul 1993 | 15 cuts | 17.00–17.50% range to 4.75% | about −12.5 |
| 17 Aug 1994 to 14 Dec 1994 | 3 increases | 4.75% to 7.50% | +2.75 |
| 31 Jul 1996 to 2 Dec 1998 | 6 cuts | 7.50% to 4.75% | −2.75 |
| 3 Nov 1999 to 2 Aug 2000 | 5 increases | 4.75% to 6.25% | +1.50 |
| 7 Feb 2001 to 5 Dec 2001 | 6 cuts | 6.25% to 4.25% | −2.00 |
| 8 May 2002 to 5 Mar 2008 | 12 increases | 4.25% to 7.25% | +3.00 |
| 3 Sep 2008 to 8 Apr 2009 | 6 cuts | 7.25% to 3.00% | −4.25 |
| 7 Oct 2009 to 3 Nov 2010 | 7 increases | 3.00% to 4.75% | +1.75 |
| 2 Nov 2011 to 4 Nov 2020 | 18 cuts | 4.75% to 0.10% | −4.65 |
| 4 May 2022 to 8 Nov 2023 | 13 increases | 0.10% to 4.35% | +4.25 |
| 19 Feb 2025 to 13 Aug 2025 | 3 cuts | 4.35% to 3.60% | −0.75 |
| 4 Feb 2026 to 6 May 2026 | 3 increases | 3.60% to 4.35% | +0.75 |
Source · RBA, Cash Rate Target: interest rate decisions
23 January 1990
The published series opened with the target at a range of 17.00 to 17.50 per cent. The opening entry is itself recorded as a cut.
1990 to July 1993
Fifteen cuts took the target from the opening range to 4.75 per cent.
August 1992 to August 1993
The Reserve Bank dates the earliest references to the 2–3 per cent inflation target to Governor speeches in this period.
August to December 1994
Three increases added 2.75 percentage points, taking the target to 7.50 per cent.
May 2002 to March 2008
Twelve increases over almost six years lifted the target from 4.25 to 7.25 per cent.
September 2008 to April 2009
Six cuts removed 4.25 percentage points, taking the target from 7.25 to 3.00 per cent.
November 2011 to November 2020
Eighteen consecutive cuts, split by long holds including the record 1,036 days at 1.50 per cent, took the target from 4.75 to the record low of 0.10 per cent.
May 2022 to November 2023
Thirteen increases added 4.25 percentage points, taking the target from 0.10 to 4.35 per cent.
February 2025 to May 2026
Three 0.25 point cuts across 2025 took the target to 3.60 per cent, and three 0.25 percentage point increases in 2026 returned it to 4.35 per cent, where it stands as at 23 August 2026.
Source · Dates are effective dates from the decisions table. RBA, Cash Rate Target: interest rate decisions; RBA, About Monetary Policy
Section 06 · Every change
Every cash rate change since 1990
The tables below record every change to the cash rate target at its effective date, the day the new target applied, which is the day after the announcement. Positive changes are increases and negative changes are cuts, in percentage points. January to July 1990 entries record range targets. Decisions that left the target unchanged are not shown2.
RBA cash rate target changes by decade, Australia, 1990 to 2026
| Effective date | Change (points) | New target (%) |
|---|---|---|
| 4 Mar 2020 | −0.25 | 0.50 |
| 20 Mar 2020 | −0.25 | 0.25 |
| 4 Nov 2020 | −0.15 | 0.10 |
| 4 May 2022 | +0.25 | 0.35 |
| 8 Jun 2022 | +0.50 | 0.85 |
| 6 Jul 2022 | +0.50 | 1.35 |
| 3 Aug 2022 | +0.50 | 1.85 |
| 7 Sep 2022 | +0.50 | 2.35 |
| 5 Oct 2022 | +0.25 | 2.60 |
| 2 Nov 2022 | +0.25 | 2.85 |
| 7 Dec 2022 | +0.25 | 3.10 |
| 8 Feb 2023 | +0.25 | 3.35 |
| 8 Mar 2023 | +0.25 | 3.60 |
| 3 May 2023 | +0.25 | 3.85 |
| 7 Jun 2023 | +0.25 | 4.10 |
| 8 Nov 2023 | +0.25 | 4.35 |
| 19 Feb 2025 | −0.25 | 4.10 |
| 21 May 2025 | −0.25 | 3.85 |
| 13 Aug 2025 | −0.25 | 3.60 |
| 4 Feb 2026 | +0.25 | 3.85 |
| 18 Mar 2026 | +0.25 | 4.10 |
| 6 May 2026 | +0.25 | 4.35 |
Source · RBA, Cash Rate Target: interest rate decisions
| Effective date | Change (points) | New target (%) |
|---|---|---|
| 3 Mar 2010 | +0.25 | 4.00 |
| 7 Apr 2010 | +0.25 | 4.25 |
| 5 May 2010 | +0.25 | 4.50 |
| 3 Nov 2010 | +0.25 | 4.75 |
| 2 Nov 2011 | −0.25 | 4.50 |
| 7 Dec 2011 | −0.25 | 4.25 |
| 2 May 2012 | −0.50 | 3.75 |
| 6 Jun 2012 | −0.25 | 3.50 |
| 3 Oct 2012 | −0.25 | 3.25 |
| 5 Dec 2012 | −0.25 | 3.00 |
| 8 May 2013 | −0.25 | 2.75 |
| 7 Aug 2013 | −0.25 | 2.50 |
| 4 Feb 2015 | −0.25 | 2.25 |
| 6 May 2015 | −0.25 | 2.00 |
| 4 May 2016 | −0.25 | 1.75 |
| 3 Aug 2016 | −0.25 | 1.50 |
| 5 Jun 2019 | −0.25 | 1.25 |
| 3 Jul 2019 | −0.25 | 1.00 |
| 2 Oct 2019 | −0.25 | 0.75 |
Source · RBA, Cash Rate Target: interest rate decisions
| Effective date | Change (points) | New target (%) |
|---|---|---|
| 2 Feb 2000 | +0.50 | 5.50 |
| 5 Apr 2000 | +0.25 | 5.75 |
| 3 May 2000 | +0.25 | 6.00 |
| 2 Aug 2000 | +0.25 | 6.25 |
| 7 Feb 2001 | −0.50 | 5.75 |
| 7 Mar 2001 | −0.25 | 5.50 |
| 4 Apr 2001 | −0.50 | 5.00 |
| 5 Sep 2001 | −0.25 | 4.75 |
| 3 Oct 2001 | −0.25 | 4.50 |
| 5 Dec 2001 | −0.25 | 4.25 |
| 8 May 2002 | +0.25 | 4.50 |
| 5 Jun 2002 | +0.25 | 4.75 |
| 5 Nov 2003 | +0.25 | 5.00 |
| 3 Dec 2003 | +0.25 | 5.25 |
| 2 Mar 2005 | +0.25 | 5.50 |
| 3 May 2006 | +0.25 | 5.75 |
| 2 Aug 2006 | +0.25 | 6.00 |
| 8 Nov 2006 | +0.25 | 6.25 |
| 8 Aug 2007 | +0.25 | 6.50 |
| 7 Nov 2007 | +0.25 | 6.75 |
| 6 Feb 2008 | +0.25 | 7.00 |
| 5 Mar 2008 | +0.25 | 7.25 |
| 3 Sep 2008 | −0.25 | 7.00 |
| 8 Oct 2008 | −1.00 | 6.00 |
| 5 Nov 2008 | −0.75 | 5.25 |
| 3 Dec 2008 | −1.00 | 4.25 |
| 4 Feb 2009 | −1.00 | 3.25 |
| 8 Apr 2009 | −0.25 | 3.00 |
| 7 Oct 2009 | +0.25 | 3.25 |
| 4 Nov 2009 | +0.25 | 3.50 |
| 2 Dec 2009 | +0.25 | 3.75 |
Source · RBA, Cash Rate Target: interest rate decisions
| Effective date | Change (points) | New target (%) |
|---|---|---|
| 23 Jan 1990 | −0.50 to −1.00 | 17.00 to 17.50 |
| 15 Feb 1990 | −0.50 | 16.50 to 17.00 |
| 4 Apr 1990 | −1.00 to −1.50 | 15.00 to 15.50 |
| 2 Aug 1990 | −1.00 | 14.00 |
| 15 Oct 1990 | −1.00 | 13.00 |
| 18 Dec 1990 | −1.00 | 12.00 |
| 4 Apr 1991 | −0.50 | 11.50 |
| 16 May 1991 | −1.00 | 10.50 |
| 3 Sep 1991 | −1.00 | 9.50 |
| 6 Nov 1991 | −1.00 | 8.50 |
| 8 Jan 1992 | −1.00 | 7.50 |
| 6 May 1992 | −1.00 | 6.50 |
| 8 Jul 1992 | −0.75 | 5.75 |
| 23 Mar 1993 | −0.50 | 5.25 |
| 30 Jul 1993 | −0.50 | 4.75 |
| 17 Aug 1994 | +0.75 | 5.50 |
| 24 Oct 1994 | +1.00 | 6.50 |
| 14 Dec 1994 | +1.00 | 7.50 |
| 31 Jul 1996 | −0.50 | 7.00 |
| 6 Nov 1996 | −0.50 | 6.50 |
| 11 Dec 1996 | −0.50 | 6.00 |
| 23 May 1997 | −0.50 | 5.50 |
| 30 Jul 1997 | −0.50 | 5.00 |
| 2 Dec 1998 | −0.25 | 4.75 |
| 3 Nov 1999 | +0.25 | 5.00 |
Source · January to July 1990 targets were announced as ranges. RBA, Cash Rate Target: interest rate decisions
Section 07 · FAQ
Cash rate history: quick answers
What is the current RBA cash rate?
The cash rate target is 4.35 per cent as at 23 August 2026. The Monetary Policy Board left it unchanged at its meeting on 10 and 11 August 20261, after three 0.25 percentage point increases earlier in 2026 took it from 3.60 to 4.35 per cent.
When did the RBA last change the cash rate?
The last change was a 0.25 percentage point increase announced on 5 May 2026 and effective 6 May 2026, which took the target from 4.10 to 4.35 per cent2. The Board then held the target unchanged at its June and August 2026 meetings.
What is the lowest the RBA cash rate has been?
The lowest cash rate target in the published series is 0.10 per cent, effective 4 November 20202. It was held for 546 days, until a 0.25 percentage point increase took effect on 4 May 2022. The published series begins in January 1990.
What is the highest the RBA cash rate has been?
The highest level in the published series is its opening range of 17.00 to 17.50 per cent, in place from 23 January 1990. The highest single-value target was 14.00 per cent, effective 2 August 19902. The published series does not cover the period before January 1990.
How often does the RBA meet to set the cash rate?
The Monetary Policy Board has met eight times a year since February 20247. Each meeting runs over two days, the decision is announced at 2.30 pm on the second day, and any change to the target takes effect the following day.
When is the next RBA cash rate decision?
The next decision is due at 2.30 pm on Tuesday 29 September 2026, at the end of the Monetary Policy Board's meeting of 28 and 29 September. The remaining 2026 meetings after that are on 2 and 3 November and 7 and 8 December5.
References
- RBA — Statement by the Monetary Policy Board, 11 August 2026 (Media Release 2026-19) · Reserve Bank of Australia ↑ b
- RBA Cash Rate Target · Reserve Bank of Australia ↑ b c d e f g h i j k l m n o p q r s
- RBA — Statement by the Monetary Policy Board, 3 February 2026 (Media Release 2026-03) · Reserve Bank of Australia ↑
- RBA — Statement by the Monetary Policy Board, 5 May 2026 (Media Release 2026-12) · Reserve Bank of Australia ↑
- RBA — Board Meeting Schedules · Reserve Bank of Australia ↑ b
- RBA — About Monetary Policy · Reserve Bank of Australia ↑ b c d
- RBA — 2024 Reserve Bank Board Meeting Dates, 25 July 2023 (Media Release 2023-18) · Reserve Bank of Australia ↑ b
- RBA — Statement by Philip Lowe, Governor, 3 November 2020 (Media Release 2020-28) · Reserve Bank of Australia ↑
- RBA — Statement by Glenn Stevens, Governor, 7 October 2008 (Media Release 2008-20) · Reserve Bank of Australia ↑
- RBA — Statement by Philip Lowe, Governor, 3 May 2022 (Media Release 2022-12) · Reserve Bank of Australia ↑