


Updated
- National rent inflation
- 3.8%
- Year-on-year, Feb 2026, down from a 7.8% peak in Aug 2023
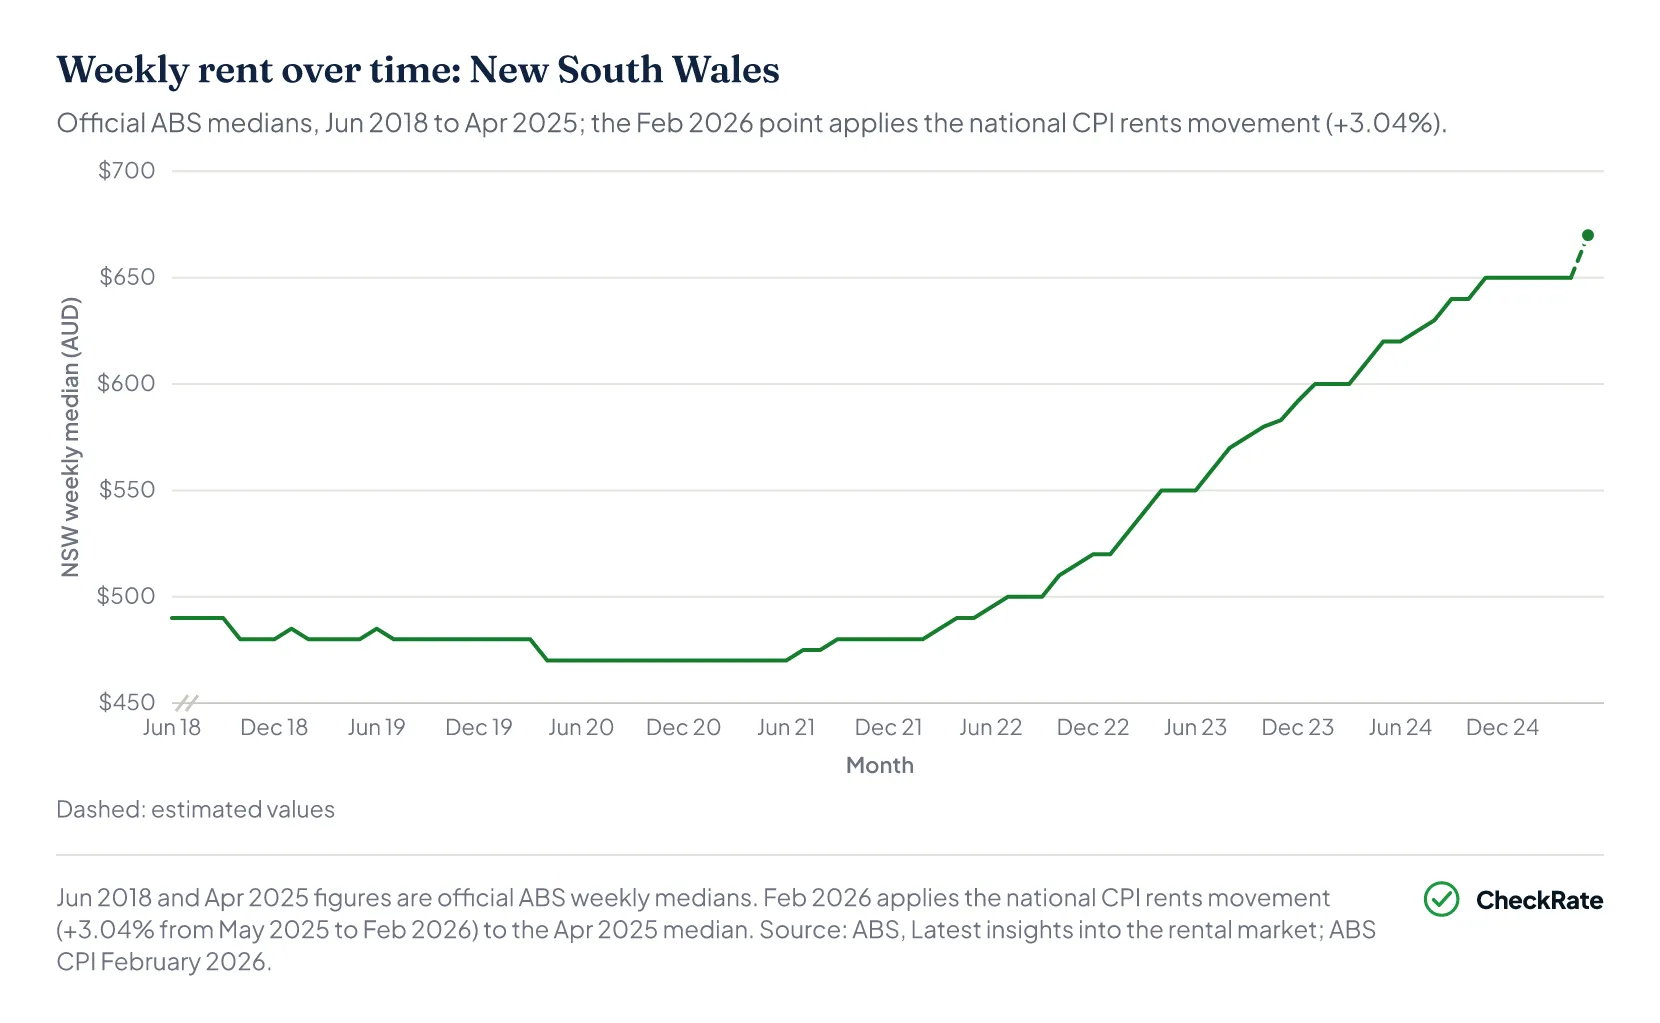
- NSW median weekly rent
- $670
- Estimated Feb 2026, the highest of any state or territory
- Rise in WA median rent
- 75%
- Jun 2018 to Apr 2025, the largest rise of any state
- Renting households in stress
- 32.2%
- Paying more than 30% of income on rent at the 2021 Census
Source · ABS Latest insights into the rental market (28 May 2025) · from www.abs.gov.au
 Average grocery bill in Australia: what households spendThe average Australian household spends $178 a week on groceries in 2025, up from $168 in 2024 and $160 in 2023. Over three years, that is an $18 rise at the checkout, or roughly $936 more a year.
 Australian electricity costs 2026: average bills, prices and household spendingAustralian household electricity usage was valued at $23.9 billion in 2024–25, up from $11.674 billion in 2009–10. That represents an increase of around 105% in nominal terms over 15 years.
 Rent vs buy Australia 2026: is it cheaper to rent or buy a home?The comparison is not a full buy-versus-rent decision model. It compares cash outflows, upfront purchase costs, mortgage rates, rent levels and housing stress, using the latest available official data…
Section 01 · National rent
How much is rent in Australia?
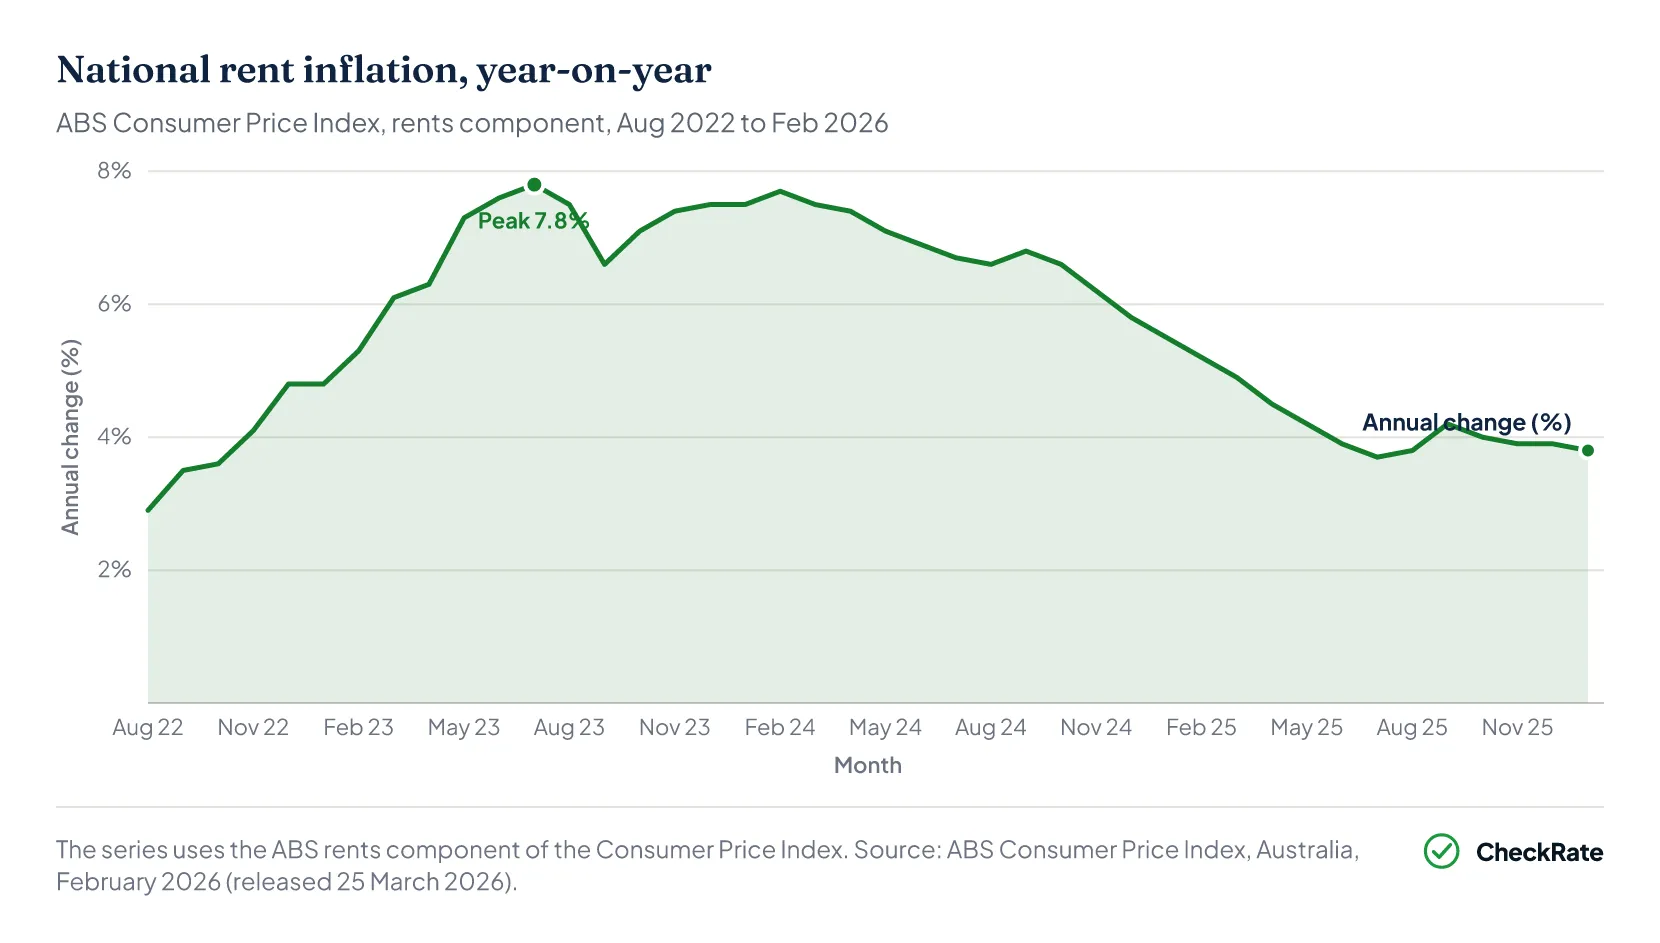
Australian rent inflation eased to 3.8% year-on-year in February 2026, down from a peak of 7.8% in August 2023. The pace of rent growth has roughly halved over the past 30 months, although rents themselves are still rising.
There is no single official "average rent" dollar figure for 2026. The two main national benchmarks are:
- 2021 Census: median weekly rent of $375
- 2019–20 Survey of Income and Housing: mean weekly housing cost of $379, or about 20% of gross weekly household income
Both figures are now several years old, but they remain the most complete official national dollar snapshots available.
How much is the average rent in Australia in 2026?
As of February 2026, CPI rent inflation sat at 3.8% year-on-year, down from a peak of 7.8% in August 2023.
The latest official state-level medians, published for April 2025, put NSW at $650 a week and Tasmania at $430. Applying national rent inflation through to February 2026 gives an estimated NSW median of around $670 a week. There is no single official 2026 national rent dollar figure. The most recent national snapshot is the 2021 Census median weekly rent of $375, which is now several years old.
What is the average monthly rent in Australia?
In NSW, median rent worked out to about $2,817 a month in April 2025, based on $650 a week. The estimated February 2026 figure is around $2,903 a month.
Australian rent data is reported weekly, so monthly figures are estimates calculated as weekly × 52 ÷ 12. Using the latest official April 2025 medians:
- NSW: $2,817 ($650 a week)
- WA: $2,656 ($613 a week)
- Queensland: $2,427 ($560 a week)
- Victoria: $2,253 ($520 a week)
- Tasmania: $1,863 ($430 a week)
Section 02 · By state
Average rent by state and territory in Australia
NSW had the highest median weekly rent of any state or territory at $650, or about $2,817 a month, in April 2025. Tasmania was the cheapest at $430 a week, or about $1,863 a month. That leaves a gap of about $940 a month between the most and least expensive states.
Most other states and territories sat in the middle: WA at $613, ACT at $595, Queensland and NT at $560, Victoria at $520, and South Australia at $495.
Growth over the seven years to April 2025 tells a different story. Western Australia stands out, with its median weekly rent rising from $350 to $613, an increase of 75%.
Other states with above-average growth:
- Tasmania: up 59%
- South Australia: up 55%
The slowest growth was in the Northern Territory, up 24%, and the ACT, up 27%.
Median weekly rent by state and territory
Ranked by April 2025 weekly rent
- New South WalesNSW$650 /wk
- Western AustraliaWA$613 /wk
- Australian Capital TerritoryACT$595 /wk
- QueenslandQLD$560 /wk
- Northern TerritoryNT$560 /wk
- VictoriaVIC$520 /wk
- South AustraliaSA$495 /wk
- TasmaniaTAS$430 /wk
Source · ABS Latest insights into the rental market (28 May 2025) · from www.abs.gov.au
Applying the national CPI rents monthly movements to the April 2025 medians gives an estimated set of February 2026 figures.
New South Wales in detail
Source · ABS Latest insights into the rental market (28 May 2025) · from www.abs.gov.au
| Median rent by state and territory | |||||
|---|---|---|---|---|---|
| State / territory | Jun 2018 | Apr 2025 | Apr 2025 monthly (est.) | Feb 2026 (est.) | Growth 2018–2025 |
| New South Wales | $490 | $650 | $2,817 ★ | $670 ★ | +32.7% |
| Victoria | $375 | $520 | $2,253 ★ | $536 ★ | +38.7% |
| Queensland | $380 | $560 | $2,427 ★ | $577 ★ | +47.4% |
| South Australia | $320 | $495 | $2,145 ★ | $510 ★ | +54.7% |
| Western Australia | $350 | $613 | $2,656 ★ | $632 ★ | +75.1% |
| Tasmania | $270 | $430 | $1,863 ★ | $443 ★ | +59.3% |
| Northern Territory | $450 | $560 | $2,427 ★ | $577 ★ | +24.4% |
| Australian Capital Territory | $470 | $595 | $2,578 ★ | $613 ★ | +26.6% |
Estimated: CPI-adjusted, not an ABS-published median
Source · ABS, Latest insights into the rental market (April 2025); ABS Consumer Price Index (February 2026); CheckRate calculations.
Which Australian state has the cheapest rent?
Tasmania has the lowest median weekly rent of any state or territory. The Tasmanian median was $430 a week in April 2025, compared with NSW at $650. After applying national rent inflation through to February 2026, the estimated Tasmanian figure sits near $443 a week.
Tasmania also recorded one of the largest percentage increases since 2018, up 59%, which has narrowed the gap.
What is the average rent in NSW, Victoria and Queensland?
The most expensive of the three is NSW at $650 a week, or about $2,817 a month in April 2025. Estimated February 2026 figures are around $670 for NSW, $577 for Queensland, and $536 for Victoria.
NSW has held the highest state median throughout the series, but Queensland and Victoria have grown faster in percentage terms since 2018.
Section 03 · By city
Average rent by city: Australian capital city rents compared
Greater Sydney topped Australian capitals at the 2021 Census, with a median weekly rent of $470, or about $2,037 a month. Greater Adelaide was the cheapest of the major cities at $320 a week, or around $1,387 a month. That was a difference of about 47% between the most and least expensive major capitals.
Those 2021 Census figures are now several years old, but they remain the only fully comparable official city-by-city dollar series available. Current rent inflation data is published at state level, not for individual capitals, so there is no clean current dollar figure for a single city like Brisbane on its own.
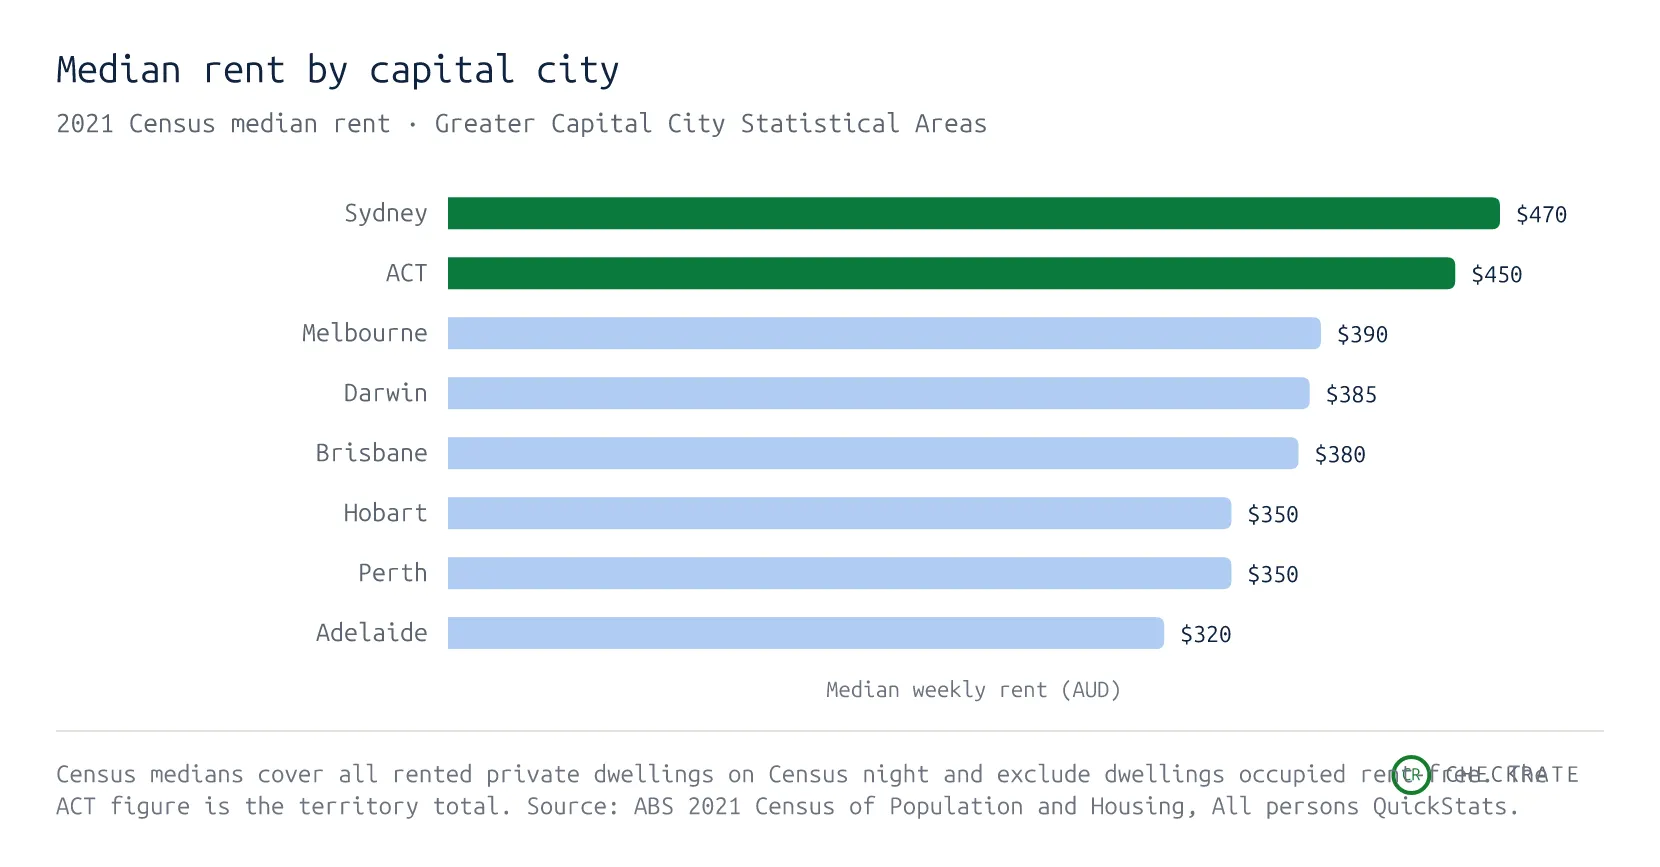
Capital-city dollar levels do not always reflect the pressure renters feel. Greater Hobart's $350 median rent is lower than Sydney's $470, but household incomes in Hobart are also lower. That means lower dollar rents do not always translate into lower rent pressure.
Section 04 · Regional vs metro
Regional rent vs city rent: which is growing faster?
Regional rents have grown faster than capital-city rents since 2018. Using June 2018 as a base of 100, the rent price index reached 122.3 in capital cities by April 2025, against 128.6 in regional areas. That leaves a gap of 6.3 points in regional growth's favour.
In dollar terms, capital-city rents still sit higher than regional rents in every state. Regional Australia is generally the cheaper market overall, but the gap has been narrowing.
The pattern flipped during the 2023 inflation peak. Annual capital-city rent inflation reached 8.5% in late 2023, ahead of regional inflation at 6.3%.
Regional growth had run faster through 2021 and 2022, when remote-work patterns and limited rental supply placed more pressure on some regional, country and coastal markets. Capital-city markets then caught up as migration resumed and rental vacancies tightened.
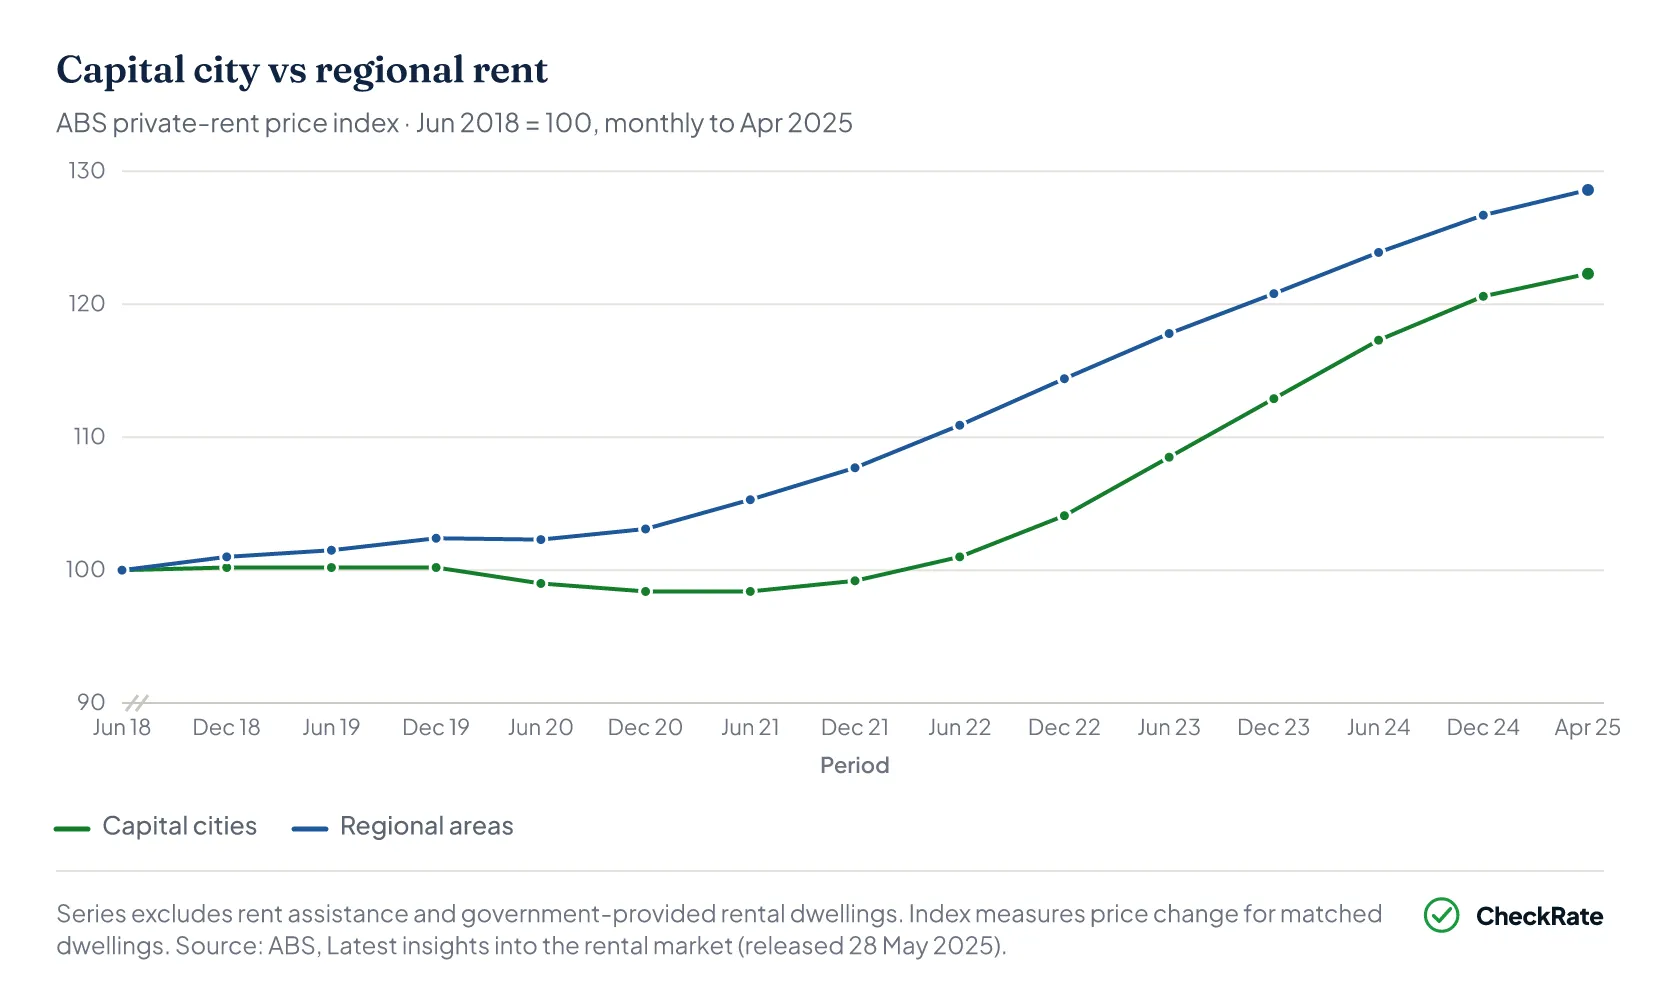
Source · ABS Latest insights into the rental market (28 May 2025) · from www.abs.gov.au
Is rent cheaper in regional Australia?
In dollar terms, yes. Regional rents generally sit below capital-city rents in every state and territory.
Victoria's most recent official figures (September 2025 quarter) show:
- Metropolitan Melbourne: $580/week
- Regional Victoria: $470/week
The rent price index rose 28.6% in regional areas against 22.3% in capital cities, so regional rents have grown faster than capital-city rents over that period.
Section 05 · Houses vs units
House rent vs unit rent in Queensland
In Queensland's March 2026 figures, a 2-bedroom flat had a median weekly rent of $650, which was $120 a week more than a 2-bedroom house at $530. The same pattern appears at three bedrooms, with 3-bedroom flats at $700 compared with 3-bedroom houses at $620.
Houses only pull ahead at four bedrooms, where the median is $720 a week.
There is no clean nationwide comparison of house and unit rents, because national rent series do not publish dollar medians split by dwelling type. State bond authorities publish more detailed data, but each one uses its own methodology. Queensland's quarterly data is used here as a current state-level example.
| Dwelling type | Mar 2024 | Mar 2025 | Mar 2026 | 1-year change |
|---|---|---|---|---|
| Flat, 1 bedroom | $450 | $470 | $525 | 11.7% |
| Flat, 2 bedroom | $580 | $620 | $650 | 4.8% |
| Flat, 3 bedroom | $600 | $650 | $700 | 7.7% |
| House, 2 bedroom | $460 | $480 | $530 | 10.4% |
| House, 3 bedroom | $555 | $590 | $620 | 5.1% |
| House, 4 bedroom | $650 | $680 | $720 | 5.9% |
| Townhouse, 2 bedroom | $530 | $550 | $600 | 9.1% |
| Townhouse, 3 bedroom | $630 | $650 | $690 | 6.2% |
| All dwellings, Queensland | $580 | $580 | $620 | 6.9% |
| Dwelling type | Mar 2024 | Mar 2025 | Mar 2026 | 1-year change |
|---|---|---|---|---|
| Flat, 1 bedroom | $1,950 | $2,037 | $2,275 | 11.7% |
| Flat, 2 bedroom | $2,513 | $2,687 | $2,817 | 4.8% |
| Flat, 3 bedroom | $2,600 | $2,817 | $3,033 | 7.7% |
| House, 2 bedroom | $1,993 | $2,080 | $2,297 | 10.4% |
| House, 3 bedroom | $2,405 | $2,557 | $2,687 | 5.1% |
| House, 4 bedroom | $2,817 | $2,947 | $3,120 | 5.9% |
| Townhouse, 2 bedroom | $2,297 | $2,383 | $2,600 | 9.1% |
| Townhouse, 3 bedroom | $2,730 | $2,817 | $2,990 | 6.2% |
| All dwellings, Queensland | $2,513 | $2,513 | $2,687 | 6.9% |
Are houses or units cheaper to rent in Australia?
There is no single national answer. In Queensland's March 2026 bond data, a 2-bedroom flat cost $650 a week, compared with $530 for a 2-bedroom house. That is a difference of $120 a week in favour of houses at this bedroom count. The cheaper option depends on bedroom count, dwelling type and location.
In the Queensland example, houses pulled ahead at four bedrooms.
Why are 1-bedroom flats rising so fast in Queensland?
Queensland one-bedroom flats rose 11.7% in the year to March 2026, the largest one-year rise of any category in the bond data. Two-bedroom houses were close behind, up 10.4%. Both sit at the lower end of the market, where population growth, tight vacancy conditions and demand for smaller rentals may be placing extra pressure on rents.
Section 06 · Rent vs income
Rent affordability: which states have the highest rental stress?
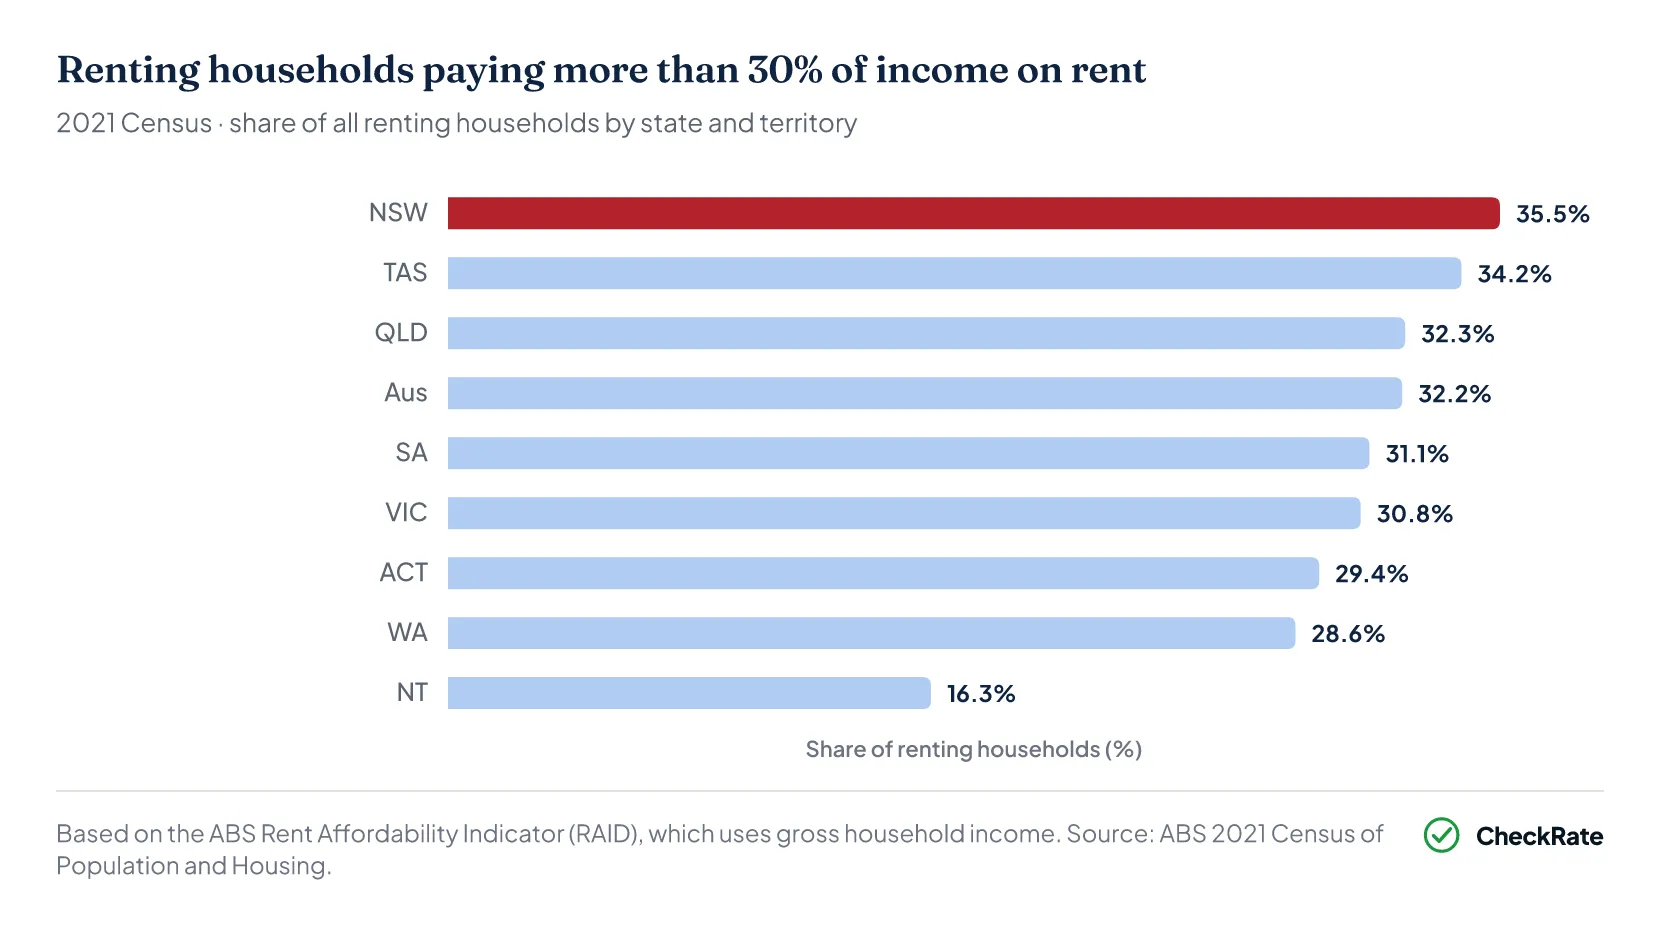
Around 32.2% of Australian renting households, or 915,317 households, were paying more than 30% of gross household income on rent at the 2021 Census. This threshold is commonly used to identify rental stress in Australian housing research. NSW had the highest rate at 35.5%, while the Northern Territory had the lowest at 16.3%, a gap of nearly 20 percentage points.
Rents have risen significantly since 2021, but the Census is still the most complete dataset on the share of renters above that line.
Renter-stress rates by state:
- NSW: 35.5%, the highest
- Tasmania: 34.2%
- Queensland: 32.3%
- Northern Territory: 16.3%, the lowest
The NT's low share may partly reflect public-housing tenancies that carry below-market rents. WA was the only mainland state below 30%.
At the lower-income end, 58% of private-renter households were spending more than 30% of gross income on housing costs, with a mean weekly housing cost of $353, or about 32% of gross income on average. That figure comes from the 2019–20 Survey of Income and Housing.
Lower-income renters in NSW had the highest state share, with 51% spending more than 30% of income on rent.
References
- ABS Consumer Price Index, Australia, February 2026 · Australian Bureau of Statistics
- ABS Latest insights into the rental market (28 May 2025) · Australian Bureau of Statistics
- ABS 2021 Census of Population and Housing, All persons QuickStats · Australian Bureau of Statistics
- ABS Housing Occupancy and Costs, 2019-20 financial year · Australian Bureau of Statistics
- Queensland Residential Tenancies Authority median rents data · rta.qld.gov.au
- Victorian Department of Families, Fairness and Housing Rental Report · dffh.vic.gov.au