

Updated
Australia’s inflation target is 2 to 3%1, but most households do not experience inflation as a neat number.
They feel it in the weekly grocery shop, rent increases, power bills, insurance renewals, fuel prices, medical appointments, school costs and the price of everyday services. When several of these costs rise at once, the pressure on household budgets becomes harder to ignore.
Inflation is one of the main economic signals watched before a Reserve Bank of Australia cash rate decision because it shows how quickly prices are rising across the economy. The Consumer Price Index, or CPI, is the main measure used to track this.1
Keeping inflation within its target range helps support price stability, full employment and the broader welfare of Australians.1
- Annual inflation
- 4.0%
- 12 months to August 2026, up from 3.5% in July
- Trimmed mean inflation
- 3.6%
- Underlying inflation, unchanged from July
- RBA inflation target
- 2–3%
- Both measures sit above the target range
- Housing prices
- 5.7%
- Largest group rise, with electricity up 13.2%
 Cost of living in Australia: what households spent in 2025Australian households spent a combined $923 billion across tracked consumer categories in 2025, up 52% from $606 billion in 2016. When housing costs are included, the average household is estimated to…
 The RBA cash rate history: every change since 1990The Monetary Policy Board left the cash rate target unchanged at 4.35 per cent at its August 2026 meeting. The Board said financial conditions had tightened following three cash rate increases in 2026…
 How much do Australians spend on bills each month?The average Australian household spent $674 a month on essential bills in 2025, covering electricity and gas, water, phone and internet, and home and contents insurance. That was 51% higher than in 20…
Section 01 · A broad average
One household, two different budgets
A higher fuel bill, a more expensive grocery shop or another rent increase can all feel like inflation. But inflation is not measured by one price going up. It looks at how prices are moving across a wider mix of goods and services households regularly pay for.
The broader view matters because prices do not all move in the same direction at the same time. Petrol might rise while clothing falls. Rent might keep climbing while some household goods become cheaper. CPI brings those movements together to give a clearer picture of overall price pressure.
But no two household budgets look the same. A renter may feel housing costs more sharply than someone with a fixed-rate mortgage. A household with several cars may be more exposed to fuel prices, while a family with children may notice groceries, school costs and childcare more than a single-person household.
Location can also change how inflation is felt. Costs may vary across capital cities, regional towns and remote communities, depending on transport, rent, insurance, healthcare and access to services.
Inflation can feel higher or lower than the national figure suggests because the CPI gives a broad average, while household budgets are personal.
Section 02 · Everyday prices
The prices people notice first
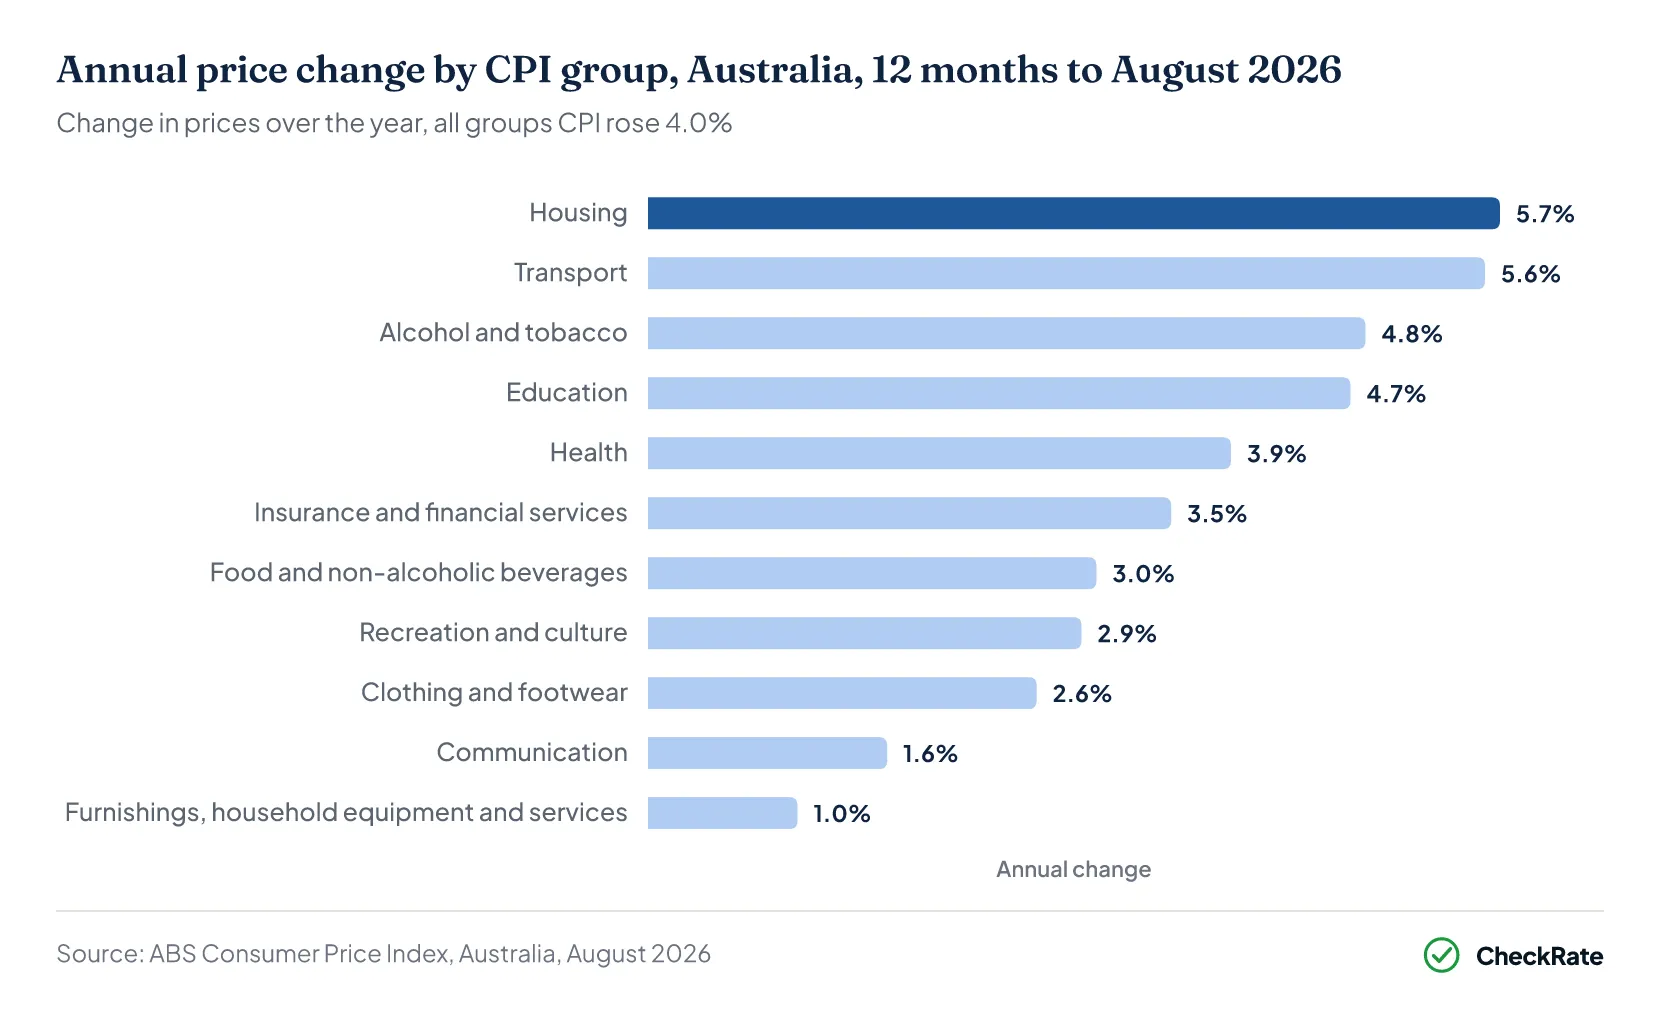
In the 12 months to August 2026, the CPI rose 4.0%, up from 3.5% in the 12 months to July 2026.2 The biggest contributors were housing, up 5.7%, transport, up 5.6%, and food and non-alcoholic beverages, up 3.0%.
Those numbers matter because they are among the expenses households tend to notice and feel most quickly. Rent or mortgage costs, fuel, public transport, groceries and basic food items are not easy to avoid.
The CPI is useful because it captures price changes across many parts of household spending, rather than focusing on one bill or one category. The Australian Bureau of Statistics describes it as a measure of household inflation, covering price changes across common areas of household expenditure.3
Section 03 · The drivers
What pushes inflation higher?
Inflation usually rises when costs build up in several places at once.
Some of the pressure starts inside Australia, through higher wages, rent, electricity, insurance, materials or transport costs for businesses. When it becomes more expensive to run a business, some of that cost can be passed on to customers.
Demand can also push prices higher. If households are spending and businesses are busy, prices may rise when there is not enough supply to keep up.
Other pressures come from outside the country. Weather events, shipping delays, global conflict, fuel prices or shortages can make goods harder or more expensive to produce and move. Those costs can then filter through to groceries, deliveries, travel and everyday services.
Housing is another major part of the inflation picture. Rent, new home construction, maintenance, rates, insurance and utilities can all add pressure, especially when they rise at the same time.
Section 04 · Why stability matters
Steady prices matter more than people think
Inflation matters because stable prices make it easier for households and businesses to plan ahead. When prices are rising at a steady pace, people have a better sense of what their money is likely to buy next month, next year or further down the track.
When inflation is too high, that certainty starts to weaken. The same income does not stretch as far, regular bills take up more of the budget, and households may have less room for other spending.
Very low inflation can also be a warning sign. If prices are barely rising, or falling, it may point to weak demand. Businesses may be selling less, hiring more cautiously or delaying investment.
The aim is not to make inflation as low as possible. The goal is inflation that is low, stable and sustainable over time.
Section 05 · Underlying inflation
The RBA looks beyond one inflation number
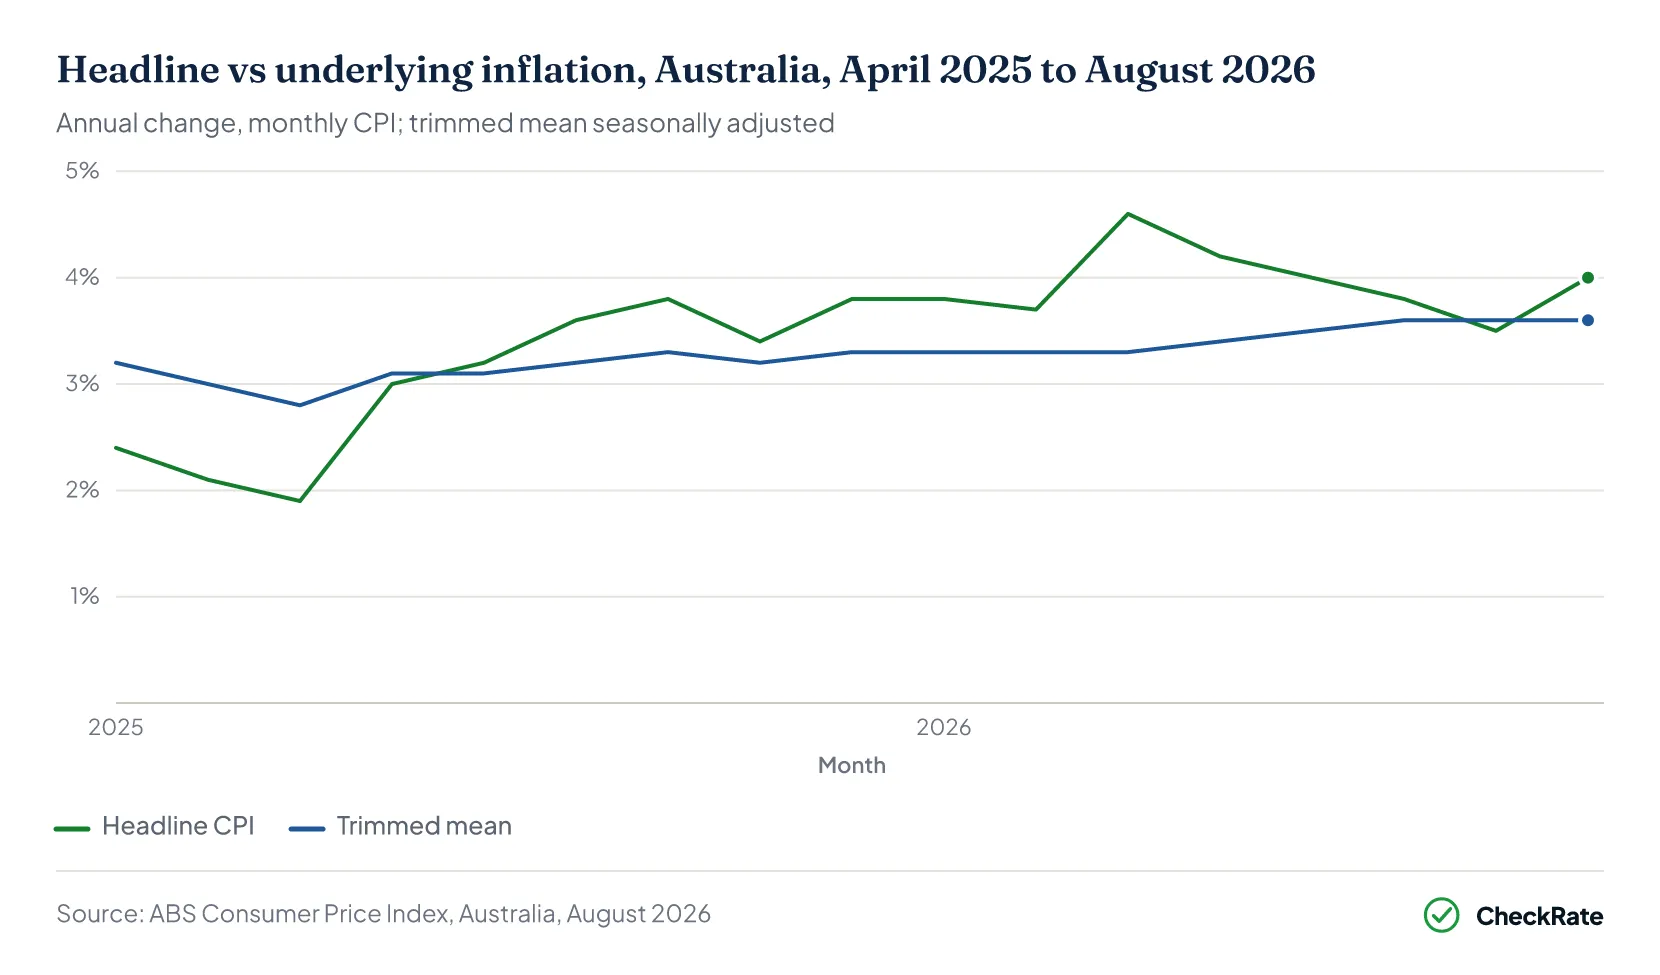
The headline CPI figure gets the most attention, but it does not tell the whole story. Policymakers also look at underlying inflation, which smooths out unusually large price movements that can push the main number sharply higher or lower.1
That matters because some price changes are temporary. Petrol prices can jump one month and ease the next. Fresh food prices may move because of floods, droughts or seasonal conditions. Government rebates and subsidies can also temporarily affect measured inflation.3
The bigger question is whether price pressure is becoming more persistent. If inflation starts spreading across more parts of the economy, lasting longer, or influencing wages, pricing decisions and spending behaviour, it becomes more significant than a short-term spike in one category.
The focus is not only on whether prices increased, but whether those increases are broad, sustained and likely to keep affecting the economy over time.
Section 06 · Household pressure
When the weekly budget starts to shift
Inflation becomes very real when the weekly budget starts to feel the pressure.
When prices rise faster than wages, households often become more careful about where their money goes. That might mean comparing brands more closely, watching weekly bills, cutting back on extras or holding off on purchases that no longer feel affordable.
Those small decisions can add up. If enough households become more cautious, businesses can feel it through fewer bookings, slower sales, smaller baskets or weaker demand for non-essential services.
Inflation is closely watched because it does not only measure price changes. It can also show how much pressure households are under and how that pressure is moving through the wider economy.
Section 07 · The bottom line
The bottom line on inflation
Inflation is one of the clearest signs of how Australia’s cost-of-living pressure is shifting. It shows whether everyday prices are rising slowly, quickly or starting to ease.
For anyone following RBA decision dates, inflation helps explain why cash rate announcements get so much attention. It sits close to the centre of the economy because it affects household budgets, business costs, wages, spending and confidence.
References
- RBA Explainer: Australia's Inflation Target · Reserve Bank of Australia ↑ b c d e
- ABS, Consumer Price Index, Australia, August 2026 · Australian Bureau of Statistics ↑ b c
- ABS, Consumer Price Index, Australia, March 2026 · Australian Bureau of Statistics ↑ b
- RBA, Inflation Overview · Reserve Bank of Australia