Home insurance claims also rose sharply in 2025. Gross home insurance claims incurred reached $13.9 billion, up 61% on 2024 and the highest annual total in APRA's current reporting series. Claims rose faster than gross accrued premium over the year, although annual claims did not exceed annual premium on the APRA series.
Insurance prices are rising faster than the cost of living
Insurance prices rose 5.5% in the 12 months to May 2026, faster than the 3.2% rise in the broader Insurance and financial services group and the 4.0% rise in All groups CPI over the same period. The ABS says the increase in insurance was driven by higher premiums for motor vehicle, house and home contents insurance.
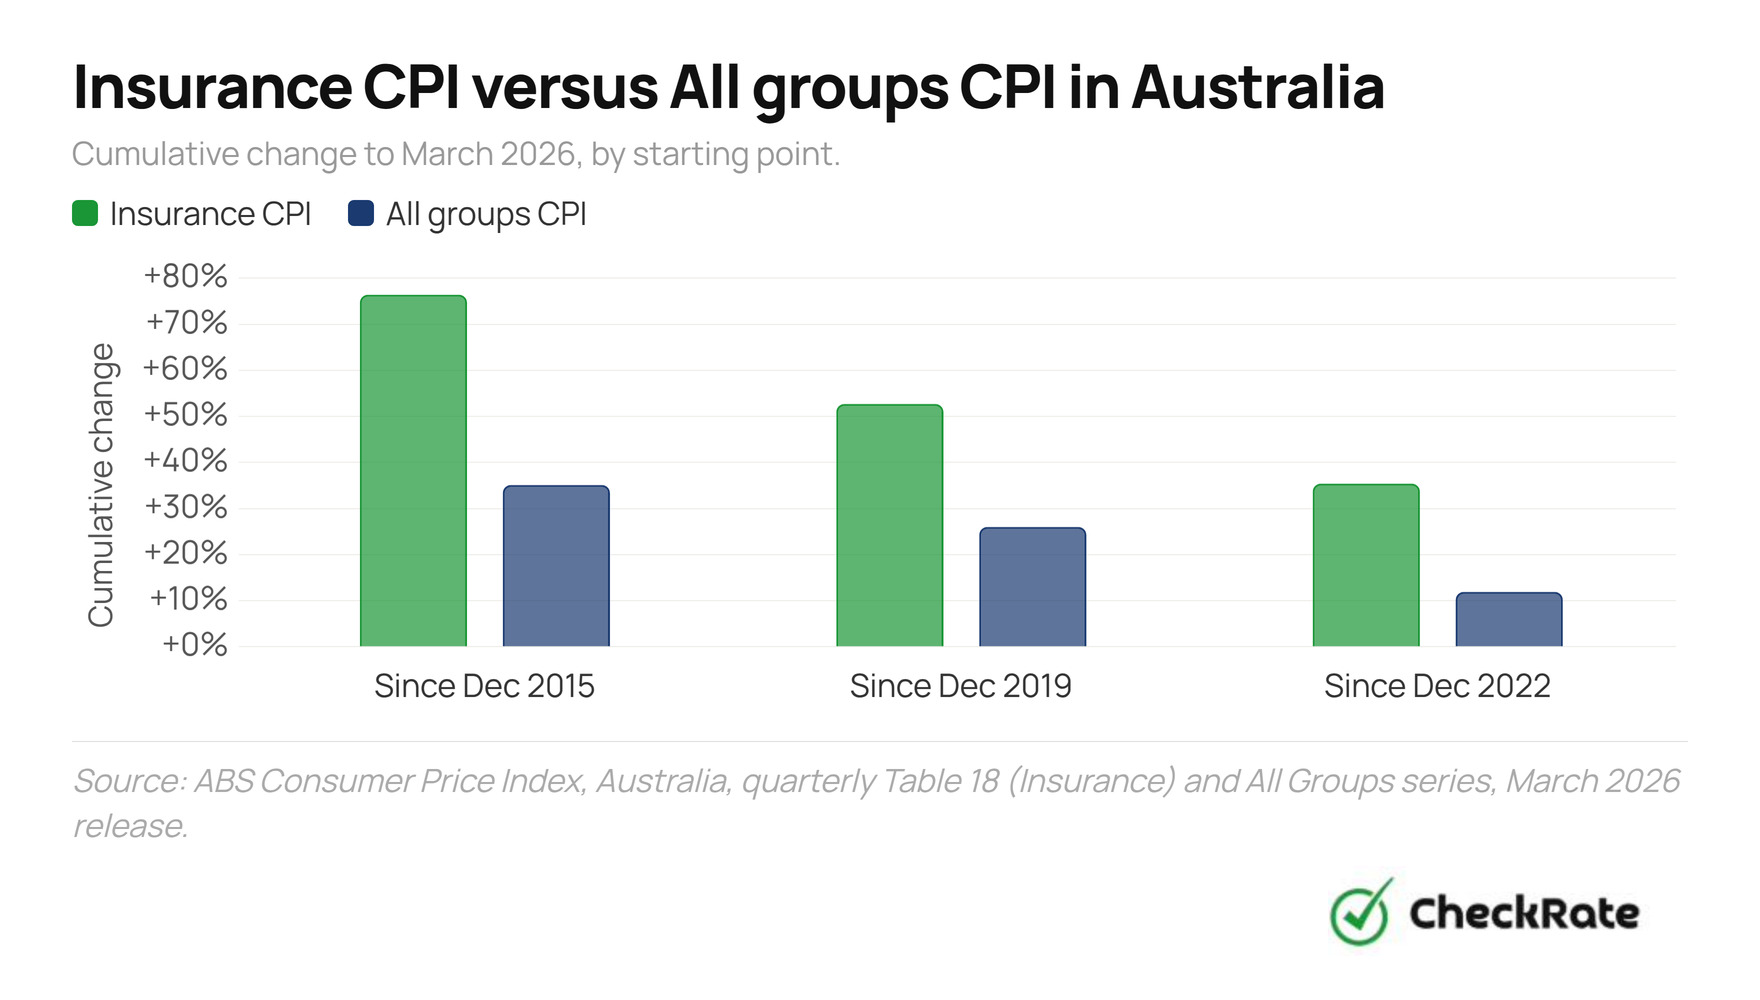
A single month shows the latest annual movement, but the longer quarterly series shows how the increases have built up over time. By March 2026, insurance prices were 76.4% higher than in December 2015, 52.7% higher than in December 2019 and 35.4% higher than in December 2022. Over each of those periods, insurance prices rose faster than All groups CPI.
- Insurance CPI
- All groups CPI

How insurance premium growth has changed over time
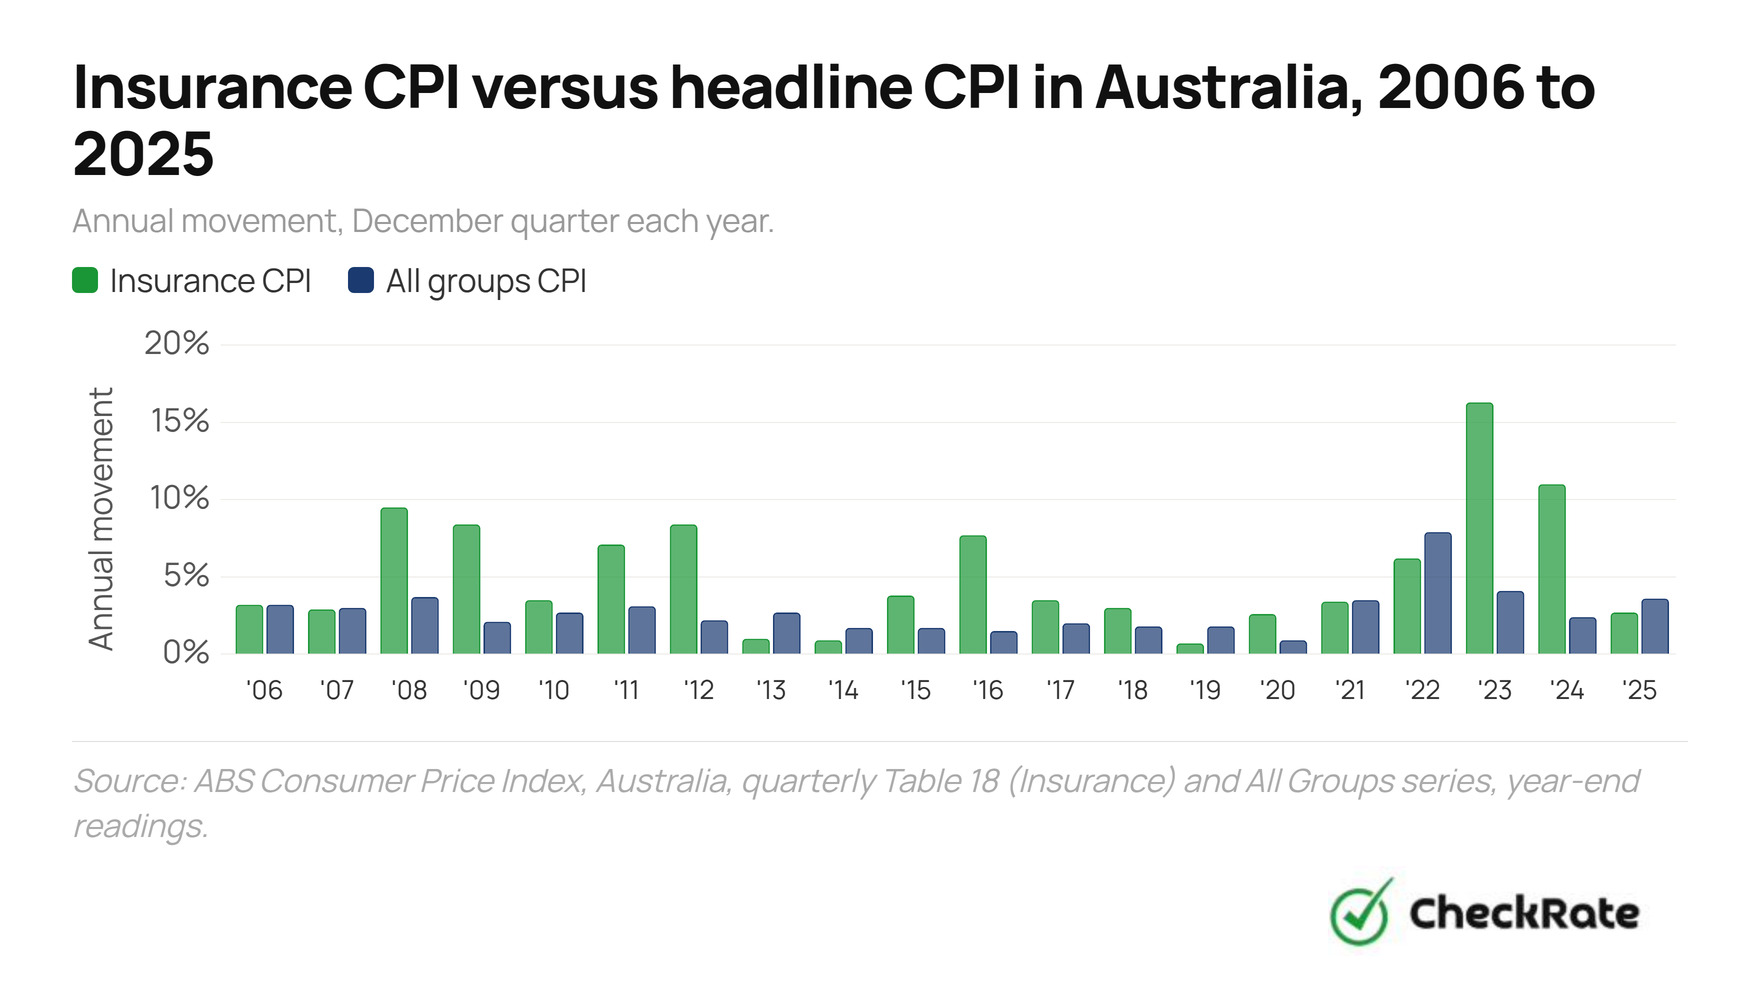
Insurance premium growth has varied widely over the past two decades, from annual increases below 1% in some years to 16.3% in 2023. The ABS quarterly Insurance CPI rose more slowly than All groups CPI in 2013, 2014 and 2019, before lifting more sharply from 2022.
The annual increase reached 16.3% in 2023, the strongest December-quarter annual movement in this 2006 to 2025 comparison, and remained high at 11.0% in 2024. Growth eased to 2.7% by December 2025, before rising to 3.7% in March 2026 on the quarterly series and 5.5% in May 2026 on the monthly series.
- Insurance
- All groups CPI
Why home building premiums have risen faster than contents premiums
Home building premiums were 5.2 times their March 2004 level by March 2024, while home contents premiums were 1.7 times their March 2004 level. This difference is not visible in the ABS Insurance CPI, which groups house, contents and motor vehicle insurance together. A separate Insurance Statistics Australia domestic insurance index tracks home building and home contents cover from March 2004.
- Building
- Contents
How insurance premium indicators differ by policy type
Home building cover shows the largest long-run increase in the available index data, while CTP recorded the fastest annual growth in gross written premium among the APRA classes listed below. These figures should not be read as a direct ranking of price increases, because each source measures a different thing.
A price index, a gross written premium figure and an average approved private health premium increase are not directly comparable. The table therefore labels each figure by metric.
| Type | Metric | Latest figure |
|---|---|---|
| Home building | Price index | 5.2× March 2004 level |
| Home contents | Price index | 1.7× March 2004 level |
| CTP (compulsory third party) | Gross written premium | +10.5% to $1.06bn |
| Home (householders) | Gross written premium | +6.1% to $4.25bn |
| Domestic motor | Gross written premium | +5.9% to $4.83bn |
| Private health | Average approved increase | +4.41% from 1 Apr 2026 |
| Travel | Gross written premium | −0.2% to $406m |
Within those limits, the APRA data show CTP had the fastest annual growth in gross written premium among the listed general insurance classes, up 10.5% in the year to the March 2026 quarter. Home insurance gross written premium rose 6.1%, domestic motor rose 5.9%, and travel was broadly flat, down 0.2%.
Private health insurance premium increases have also lifted. The industry-average approved increase was 3.73% in 2025 and 4.41% in 2026, the largest average approved increase since 2017.
Why are insurance premiums rising in Australia?
Gross claims incurred for home insurance reached $13.9 billion in 2025, up 61% on 2024 and the highest annual total in APRA's current reporting series. Gross accrued premium also rose over the year, but by much less than claims.
The heaviest quarters were March and December 2025. The March quarter included widespread flooding and wind damage associated with ex-Tropical Cyclone Alfred across south-east Queensland and northern New South Wales, while total gross home insurance claims incurred reached $4.70 billion for the quarter. The December quarter was the largest quarter in APRA's current series, at $5.45 billion, including $3.47 billion in Queensland.
- Gross accrued premium
- Gross claims incurred
The March 2026 quarter showed lower claims pressure than the December 2025 peak, but gross accrued premium continued to rise. Gross claims incurred eased to $3.25 billion, down 40% from December 2025. Calculated from APRA's gross claims incurred and gross accrued premium data, claims were equal to 76.3% of gross accrued premium in March 2026, compared with 125.9% in December 2025. Gross accrued premium was still 7.7% higher than a year earlier.
The figures show that premium revenue continued to increase after the December claims peak. APRA data do not show how insurers set individual premiums, but the pattern is consistent with premiums reflecting broader claims experience rather than one quarter of claims.
Several factors can contribute to higher premiums:
- Reinsurance costs, which are part of the cost insurers face when they buy protection against large events
- Building material and labour costs, which can affect repair and rebuild costs
- Extreme weather events, which can increase the number and size of claims in affected periods
The ACCC has identified reinsurance as a significant cost component of premiums for cyclone-exposed policies. In the rest of Australia, inflation-adjusted reinsurance costs for home and contents insurance rose from about $3.4 billion in 2022–23 to about $4.0 billion in 2023–24, before falling by 6% in 2024–25.
How insurance premium increases vary across Australian cities and risk areas
Adelaide recorded the fastest rise in insurance prices of any capital city in the year to May 2026, at 6.9%. It was followed by Brisbane at 6.5%, Hobart at 6.3%, Melbourne at 6.1%, Sydney at 5.9%, Darwin at 5.3% and Canberra at 3.8%. Perth recorded the slowest increase, at 1.5%.
Cyclone risk creates a sharper split in home insurance premiums
The ACCC's final cyclone reinsurance pool report found that premium changes differed by cyclone risk. For combined home and contents insurance, average premiums per $100,000 sum insured were:
- 11% lower in medium-to-high cyclone-risk areas in the first year after insurers entered the pool
- 3% higher in low cyclone-risk areas
- 6% higher in nil cyclone-risk areas
The ACCC also found that the reduction in medium-to-high cyclone-risk areas was sustained into the second year after pool entry: average home and contents premiums per $100,000 sum insured were 14% lower than pre-pool premiums in medium-to-high cyclone-risk areas, compared with increases of 4% in low-risk areas and 8% in nil-risk areas.
Average combined home and contents premiums remained highest in northern Australia in 2024–25. The ACCC reported average premiums of $4,966 in north Western Australia, $3,546 in the Northern Territory, $3,117 in north Queensland and $2,310 for the rest of Australia. Some cyclone-exposed cities also recorded lower premiums after insurers entered the pool: Karratha down 15%, Mackay down 14% and Cairns down 12%.
What rising premiums mean for Australian household budgets
Australian households spent an average of $79.74 a week on insurance in 2015–16, according to the ABS Household Expenditure Survey. This is the latest direct national household spending survey for this category, so it should not be read as a current 2026 dollar estimate.
Based on the spending measure used in the ABS detailed expenditure data, insurance accounted for about 5.2% of weekly household spending in 2015–16. Since insurance prices have risen substantially since then, the 2015–16 dollar amount is likely to understate current spending. However, the official data do not show the average household insurance bill in 2026.
What survey data show about insurance gaps
A 2025 Australia Institute survey of 2,009 Australians found that some homeowners reported gaps in building or contents cover. Among respondents who owned their home outright or had a mortgage, 15% said their house was underinsured and 4% said it was uninsured. For contents cover, 19% said their contents were underinsured and 10% said they were uninsured.
Frequently asked questions
Home building premiums were 5.2 times their March 2004 level by March 2024, while home contents premiums were 1.7 times their March 2004 level. More broadly, the ABS Insurance CPI, which includes motor vehicle, house and contents insurance, was 52.7% higher in March 2026 than in December 2019.
References
- 1Australian Bureau of Statistics: Consumer Price Index, Australia, monthly release, May 2026, incl. capital city detail (Table 11).
- 2Australian Bureau of Statistics: Consumer Price Index, Australia, quarterly release, March 2026, incl. the Table 18 Insurance time series.
- 3Australian Bureau of Statistics: Household Expenditure Survey, Australia: Summary of Results, 2015–16.
- 4Australian Prudential Regulation Authority: Quarterly General Insurance Performance Statistics, March 2026 release, incl. class-of-business and state-level data.
- 5Department of Health, Disability and Ageing: Average annual price changes in private health insurance premiums, 1997 to 2026.
- 6Australian Competition and Consumer Commission: Insurance Monitoring Report 2026, the fifth and final report under the cyclone reinsurance pool direction, published 25 June 2026.
- 7Insurance Council of Australia / Insurance Statistics Australia: quarterly home building and contents insurance index, via the data hub, March 2004 to March 2024.
- 8The Australia Institute: home and contents insurance polling, 2025 survey of 2,009 Australians who own outright or have a mortgage.
Data Snapshots