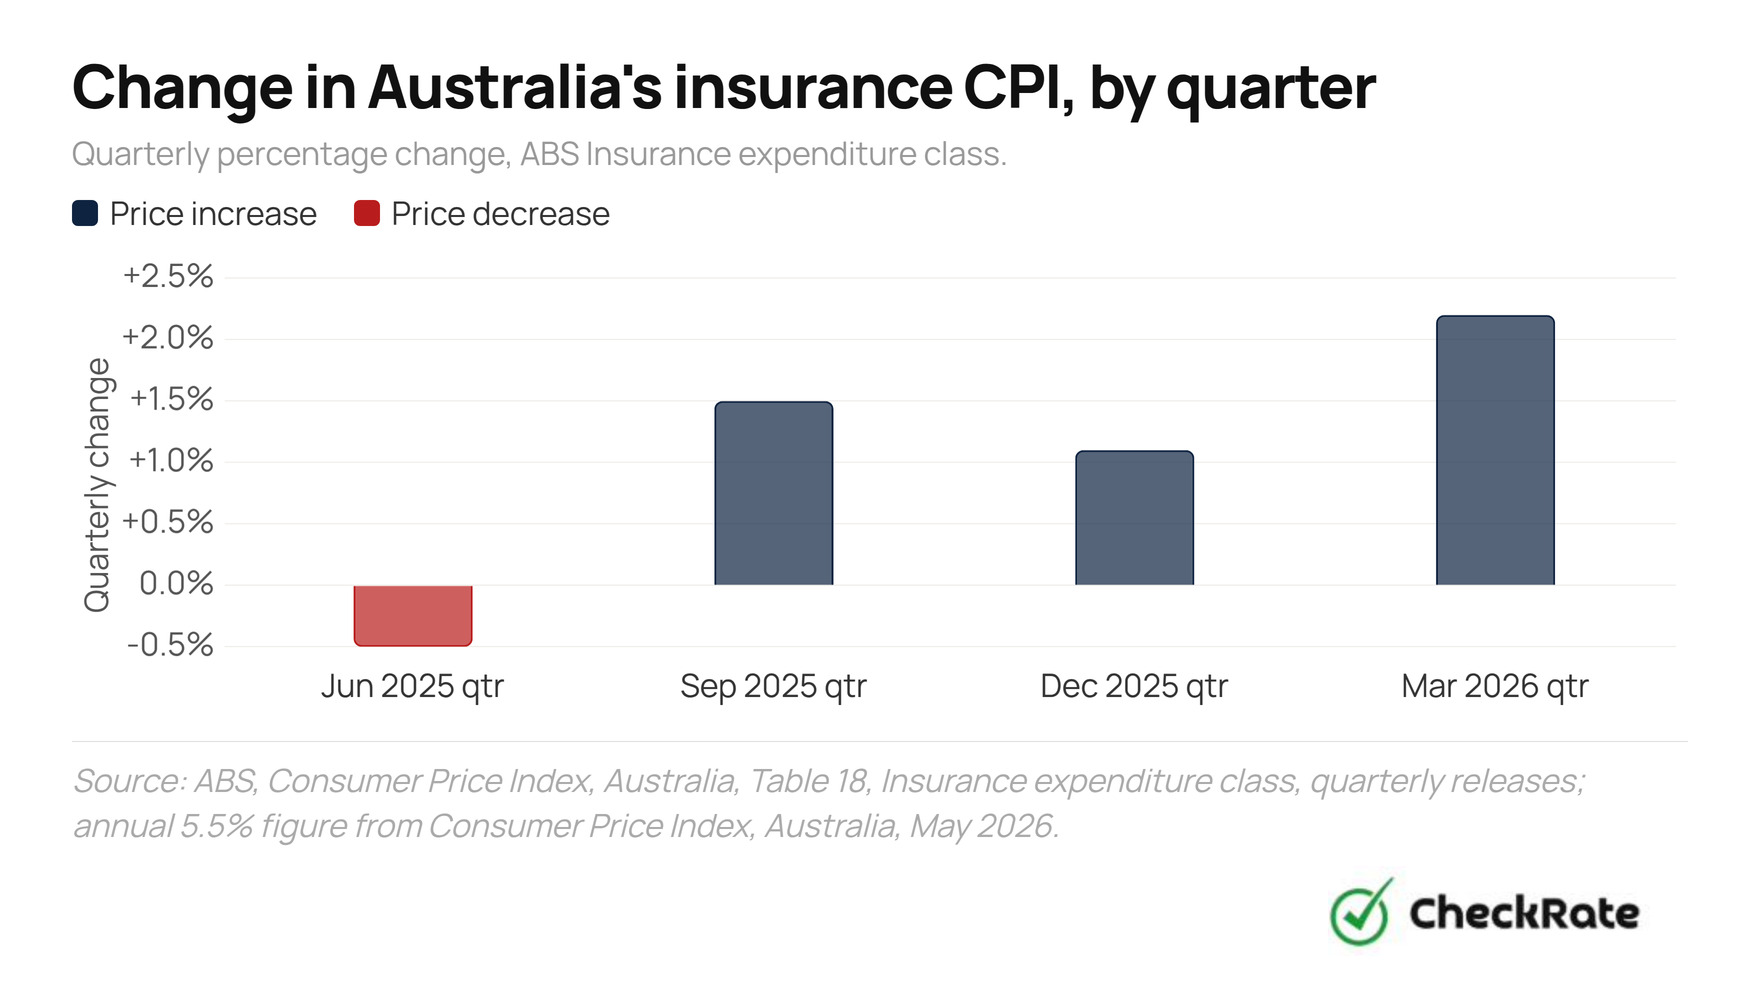
The ABS Insurance expenditure class rose 5.5% over the year to May 2026, while motor vehicle theft rose 8% nationally in 2024. Compulsory third party prices are published separately by jurisdiction, vehicle type and period, so they are best treated as statutory scheme examples rather than a national car insurance average.
What is the average car insurance cost in Australia?
The closest official measure of car insurance cost in Australia is APRA's domestic motor average gross written premium per risk. It was $1,011 in the March 2026 quarter, based on $4.833 billion in gross written premium across 4.781 million risks.
This is an industry-level benchmark, not the average price paid by a driver for comprehensive car insurance. No official national dataset publishes the average comprehensive car insurance premium paid by Australian drivers, because optional car insurance is priced individually by insurer, vehicle, driver, location and cover type.
The article uses three separate official measures to describe car insurance costs. They should not be combined into one national average.
These three measures cannot be combined into a single average car insurance cost.
Gross written premium (GWP) is the total premium insurers wrote across the domestic motor class during the reporting period, covering comprehensive, third-party property and third-party fire and theft business across different vehicles and risk profiles. Dividing GWP by the number of risks written gives an industry-level benchmark for the whole class, not a quote for any individual driver, vehicle, address or cover level.
Domestic motor premiums and claims, March 2026 quarter
Gross written premium reached $4.833bn in the March 2026 quarter, up 14.6% on two years earlier, while net claims incurred rose to $2.859bn (up 22.1%) and the insurance service result reached $472m, the strongest result in the current series. The average premium per risk is simply gross written premium divided by the number of risks written; net claims incurred and the insurance service result are separate measures that add financial context for the same quarter.
Compulsory third party (CTP) insurance works differently again. It is compulsory in every state and territory, though pricing and collection vary by jurisdiction.
- It operates through a regulated scheme in each state and territory. In New South Wales, Queensland and the ACT, licensed insurers set prices within their own regulatory frameworks.
- Depending on the jurisdiction, it is either bundled into registration charges or bought separately alongside registration.
- It provides cover or statutory benefits for eligible people injured in motor vehicle accidents, subject to the rules of each scheme. It does not cover damage to vehicles or property.
- It does not include optional comprehensive or third-party property cover, which many motorists purchase separately.
How much have car insurance premiums increased in Australia?
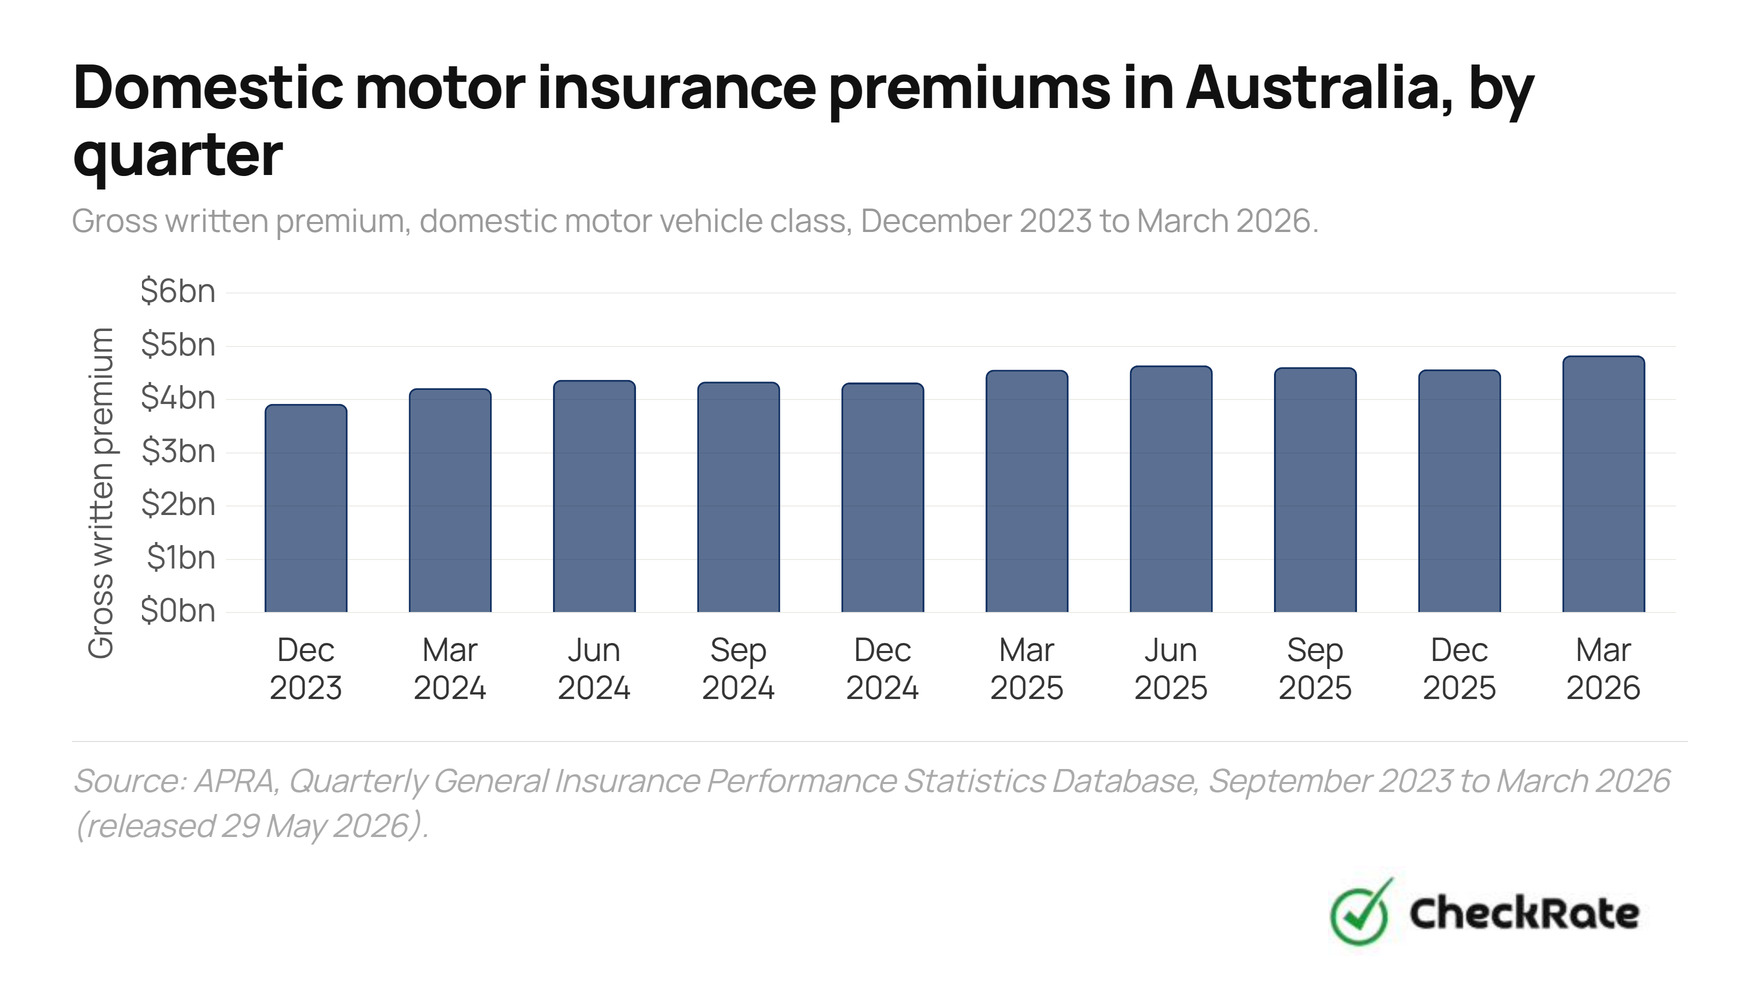
Domestic motor gross written premium rose from $3.921 billion in December 2023 to $4.833 billion in March 2026, an increase of about 23%. The rise was not continuous, with several quarters in between recording modest declines.
The industry average gross written premium per risk for the same class followed a similar path, rising from roughly $920 per risk in the March 2024 quarter to roughly $1,011 in March 2026, an increase of about 9.9% over two years. This is an APRA industry benchmark, not the change in a typical driver's comprehensive car insurance premium.

Net claims incurred peaked slightly earlier than premium, at $2.880 billion in the December 2025 quarter, before easing back in March 2026. Over the same period, gross written premium rose from $4.568 billion to $4.833 billion. That gap helped lift the domestic motor insurance service result.
The ABS Insurance expenditure class, which reflects premium movements for motor vehicle, house and home contents insurance, rose 5.5% over the year to May 2026. It is a price-inflation measure, not a dollar estimate of car insurance premiums.
How much is compulsory third party (CTP) insurance in Australia?
CTP premiums vary widely by jurisdiction, vehicle type and registration period. The official figures below are selected published CTP measures, not a like-for-like national ranking. New South Wales' scheme-wide average sits at $536 across all vehicle types for the year to 30 June 2025, while passenger-vehicle premiums in Queensland and the ACT sit between about $391 and $424 across different 2025 and 2026 periods. CTP, sometimes called a Green Slip in NSW or a MAI premium in the ACT, covers compensation for people injured in a vehicle accident.
The figures below come from New South Wales, Queensland and the Australian Capital Territory. They are published on different bases, cover different vehicle populations and periods, and are not a like-for-like national ranking.
| Jurisdiction | Basis | Premium | Period | Comparability limitation |
|---|---|---|---|---|
| New South Wales | Scheme-wide average, all vehicle types | $536 | Year to 30 Jun 2025 | Includes taxis and motorcycles; not passenger vehicles alone |
| Queensland | Class 1 private passenger vehicle, by insurer | $390.80–$405.80 | Oct–Dec 2025 quarter (historical) | Passenger vehicle only; three insurers; rates and levy have since changed |
| Australian Capital Territory | Passenger vehicle (no ITC), by insurer | $396.60–$423.90 | May–Jun 2026, depending on insurer | Passenger vehicle only; four insurers, two effective dates |
Source: SIRA, 2017 CTP Scheme Performance Report to 30 June 2025; MAIC, Price competition returns to Queensland's CTP scheme and CTP premium information; ACT Treasury, Motor Accident Injuries premium schedules (AAMI, APIA, GIO, NRMA).
Looking specifically at private passenger vehicles gives the closest available vehicle-class comparison between Queensland and the ACT. Across the historical Queensland rates for October to December 2025 and the ACT schedules effective in May and June 2026, premiums range from $390.80 to $423.90, a spread of $33.10. The comparison is not contemporaneous, and differences in scheme design mean the prices are not a direct value ranking.
How much is a Green Slip in New South Wales?
The NSW average CTP premium across all vehicle types was $536 at 30 June 2025, up $35 (7%) on the year before. SIRA attributed the increase to 2022 legislative benefit increases, higher levies and general inflation.
The scheme-wide figure blends very different vehicle categories: the average metropolitan taxi premium was $4,726, while the average motorcycle premium was $418. Specific NSW Green Slip prices vary by vehicle and insurer, so the scheme-wide average should not be read as a passenger-car quote.
SIRA's performance report also lists an adjusted pre-reform all-vehicle comparison of $935 alongside the current $536 average, along with a stated saving of $465. That saving does not reconcile with the two published premium figures (the actual difference is $399), so it is not repeated here as a settled number.
On a separate affordability measure, based on the average annual passenger-vehicle Class 1 premium excluding GST and including levies (not the all-vehicle $536 figure), CTP represented about 23% of average weekly earnings at 30 June 2025, down from 37% under the scheme it replaced.
How much is CTP in Queensland?
Queensland's Class 1 CTP premiums for the October to December 2025 quarter ranged from $390.80 to $405.80 across three insurers, the first time rates have differed since January 2017, after price competition returned to the scheme for registrations due from 1 October 2025.
For registrations due in that quarter, the difference between the lowest and highest Class 1 insurer price was $15 a year. Each insurer sets its own rate within limits set by the regulator.
The Class 1 benchmark rose from $353.80 in December 2021 to $369.60 in December 2024, an increase of roughly 4.5% over three years, and stayed flat at $369.60 between December 2023 and December 2024. Levy changes, particularly the National Injury Insurance Scheme Queensland (NIISQ) levy, have been a significant component of that increase.
MAIC says Queensland's Class 1 CTP remains the lowest-cost scheme of its kind on the mainland.
The prices above are for the October to December 2025 quarter, the first quarter of differentiated pricing, and are a historical comparison point rather than current pricing. Queensland has since published further quarterly updates with different rates, and the fixed levy and administration component has risen from $157.80 to $166.80 for registrations from 1 July 2026.
How much is CTP (MAI) in the ACT?
ACT MAI premiums for a passenger vehicle range from $396.60 to $423.90 across four insurers, a spread of $27.30. The scheme, in place since February 2020, is community rated: licensed insurers set a premium for each vehicle class, subject to government regulation, so motorists within the same class pay the same insurer premium regardless of their personal risk characteristics.
Four insurers currently publish MAI schedules for the ACT. Passenger vehicles sit at the cheaper end of the schedule; commercial and higher-risk vehicle classes cost more.
| Vehicle class | AAMI | APIA | GIO | NRMA |
|---|---|---|---|---|
| Passenger vehicle | $396.60 | $423.90 | $399.60 | $396.60 |
| Motorcycle, over 600cc | $502.00 | $502.00 | $502.00 | $502.00 |
| Motorcycle, 300–600cc | $502.00 | $502.00 | $502.00 | $502.00 |
| Motorcycle, up to 300cc / electric | $105.00 | $116.90 | $105.00 | $105.00 |
| Goods vehicle, up to 4.5t GVM | $501.40 | $523.50 | $475.80 | $475.80 |
| Goods vehicle, over 4.5t GVM | $1,883.60 | $1,995.00 | $1,945.90 | $1,776.70 |
| Private hire car | $1,449.10 | $1,491.50 | $1,460.80 | $1,407.00 |
| Rideshare / personal share vehicle | $1,519.10 | $1,589.50 | $1,535.60 | $1,289.20 |
| Taxi | $7,762.60 | $8,122.40 | $7,846.90 | $7,882.60 |
Source: ACT Treasury, AAMI, APIA, GIO and NRMA Motor Accident Injuries premium schedules.
CTP is compulsory and regulated in every jurisdiction. The optional cover many motorists also carry, comprehensive or third-party property, is priced individually instead, and is not published in an official national dataset.
What are the main types of car insurance in Australia?
Australia has four main car insurance cover types: compulsory third party, third-party property damage, third-party fire and theft, and comprehensive insurance. CTP is compulsory, while the other cover types are optional and priced individually by insurers.
No Australian government body publishes an official national average price for comprehensive car insurance, or a national dollar comparison between comprehensive and third-party property cover. Optional car insurance premiums vary by driver, vehicle, address, cover type and insurer, and this pricing data is not published in an official national dataset.
- Comprehensive cover generally pays for insured damage to the policyholder's own vehicle and damage caused to another person's vehicle or property, subject to the policy's terms, limits and exclusions.
- Third-party property damage cover pays only for damage caused to someone else's vehicle or property. It does not cover repairs to the policyholder's own vehicle.
- Third-party fire and theft cover adds cover for the policyholder's own vehicle if it is stolen or damaged by fire, on top of third-party property damage.
- Compulsory third party (CTP) is compulsory in every state and territory. Depending on the jurisdiction, it is included in registration charges or purchased as part of the registration process. It covers eligible personal injuries rather than damage to vehicles or property.
ASIC's Moneysmart, the government's consumer finance guidance service, sets out these same distinctions and notes that comprehensive cover does not cover everything, since exclusions and limits vary by policy.
Why do car insurance costs vary by location?
Car insurance costs can vary by location, and one measurable indicator of location-based risk is motor vehicle theft. Recorded motor vehicle theft rose 8% nationally in 2024, to 65,603 victims. For this ABS offence category, the stolen motor vehicle is counted as the victim.
Adjusting for how many vehicles are registered in each state gives an indicative theft rate by fleet size.
Victoria's theft figures show a different pattern. It recorded 6,547 more motor vehicle theft victims in 2024, a 41% rise and its highest total since 2003. That rise on its own exceeded the national net increase of 4,604 victims (+8%). New South Wales also recorded a rise, up 6% on 2023.
Several other jurisdictions recorded falls over the same period:
- Queensland: down 4%
- South Australia: down 12%
- Tasmania: down 11%
- Western Australia: down 16%*
- Northern Territory: down 4%
- ACT: down 7%
These falls offset part of the rises in Victoria and New South Wales, leaving the national total 8% higher overall.
| State / territory | 2024 victims | Change on 2023 | Registered vehicles | Rate per 100k |
|---|---|---|---|---|
| Northern Territory | 1,737 | −4% | 170,990 | 1,015.8 |
| Victoria | 22,504 | +41% | 5,685,173 | 395.8 |
| Queensland | 17,493 | −4% | 4,892,464 | 357.5 |
| Tasmania | 1,493 | −11% | 549,847 | 271.5 |
| Australian Capital Territory | 920 | −7% | 344,380 | 267.1 |
| Western Australia | 5,653 | −16%* | 2,621,125 | 215.7 |
| South Australia | 3,479 | −12% | 1,632,496 | 213.1 |
| New South Wales | 12,319 | +6% | 6,407,874 | 192.2 |
Source: ABS, Recorded Crime – Victims, Australia, 2024; BITRE, Road Vehicles Australia, January 2025.
Separately, the ABS Crime Victimisation survey estimated that about 0.6% of Australian households, around 64,400 in total, had a motor vehicle stolen in 2024–25, similar to 0.7% the year before. Of those, 88% reported the incident to police.
What affects the cost of car insurance?
Insurers commonly consider several factors when pricing optional car insurance, including:
- The driver's age and claims history
- The vehicle's make, model and value
- Where the vehicle is parked overnight
- How the vehicle is used
- The excess and level of cover chosen
Road safety data can describe risk without describing price. National road-fatality and hospitalised-injury data, published through BITRE and the National Road Safety Data Hub, is broken down by age, road-user type, state and remoteness. That data can provide context for road-risk patterns, but it does not show how insurers convert those risks into premiums.
References
- 1APRA: Quarterly general insurance performance statistics, September 2023 to March 2026, released 29 May 2026.
- 2ABS: Consumer Price Index, Australia, May 2026, Insurance expenditure class.
- 3ABS: Consumer Price Index, Australia, September Quarter 2025, Insurance expenditure class and cost drivers.
- 4SIRA: 2017 CTP Scheme Performance Report to 30 June 2025.
- 5MAIC: Price competition returns to Queensland's CTP scheme, September 2025.
- 6MAIC: Queensland CTP insurance premiums and levies and administration fee.
- 7ACT Treasury: Motor Accident Injuries premium schedules: AAMI, APIA, GIO and NRMA.
- 8BITRE: Road Vehicles Australia, January 2025.
- 9ABS: Recorded Crime – Victims, 2024 and methodology.
- 10ABS: Crime Victimisation, 2024–25 financial year.
- 11ASIC Moneysmart: Choosing car insurance.
Average gross written premium per risk, theft rates per 100,000 registered vehicles and percentage changes not published directly by a source agency are CheckRate calculations based on official source data. They are not official statistics.
Data Snapshots