Insurance prices have risen much faster than wages over the past decade. The ABS Insurance Consumer Price Index increased by approximately 73% between March 2016 and March 2026, compared with approximately 30% growth in the Wage Price Index. Private health insurance premiums also rose by an approved industry average of 4.41% from 1 April 2026.
What types of insurance do Australian households pay for?
Australian households may pay for several types of insurance, including private health, motor vehicle, home building, contents, landlord, life, income protection, travel and pet insurance.
Compulsory third-party motor injury insurance is required to register and drive a car, although payment arrangements differ between states and territories. Other forms of household insurance are generally optional, but some may be required as a condition of a loan.
APRA supervises registered general insurers, life insurers and private health insurers in Australia. ASIC's Moneysmart service provides Australian Government consumer information about how different insurance products work.
Only CTP motor insurance is legally compulsory, tied to vehicle registration in every state and territory. "Lender requirement" means it isn't compulsory by law but is generally a mortgage condition. Everything else here is a personal choice.
What is the latest official benchmark for household insurance spending?
The ABS Household Expenditure Survey provides the latest official benchmark for average household insurance spending by type.
The survey collected expenditure data from Australian private households in 2015–16 and remains the most recent direct ABS measurement of this spending.
What counts as household insurance spending?
Insurance spending is not published as one single number. It's split across four different ABS categories, each with its own name and purpose:
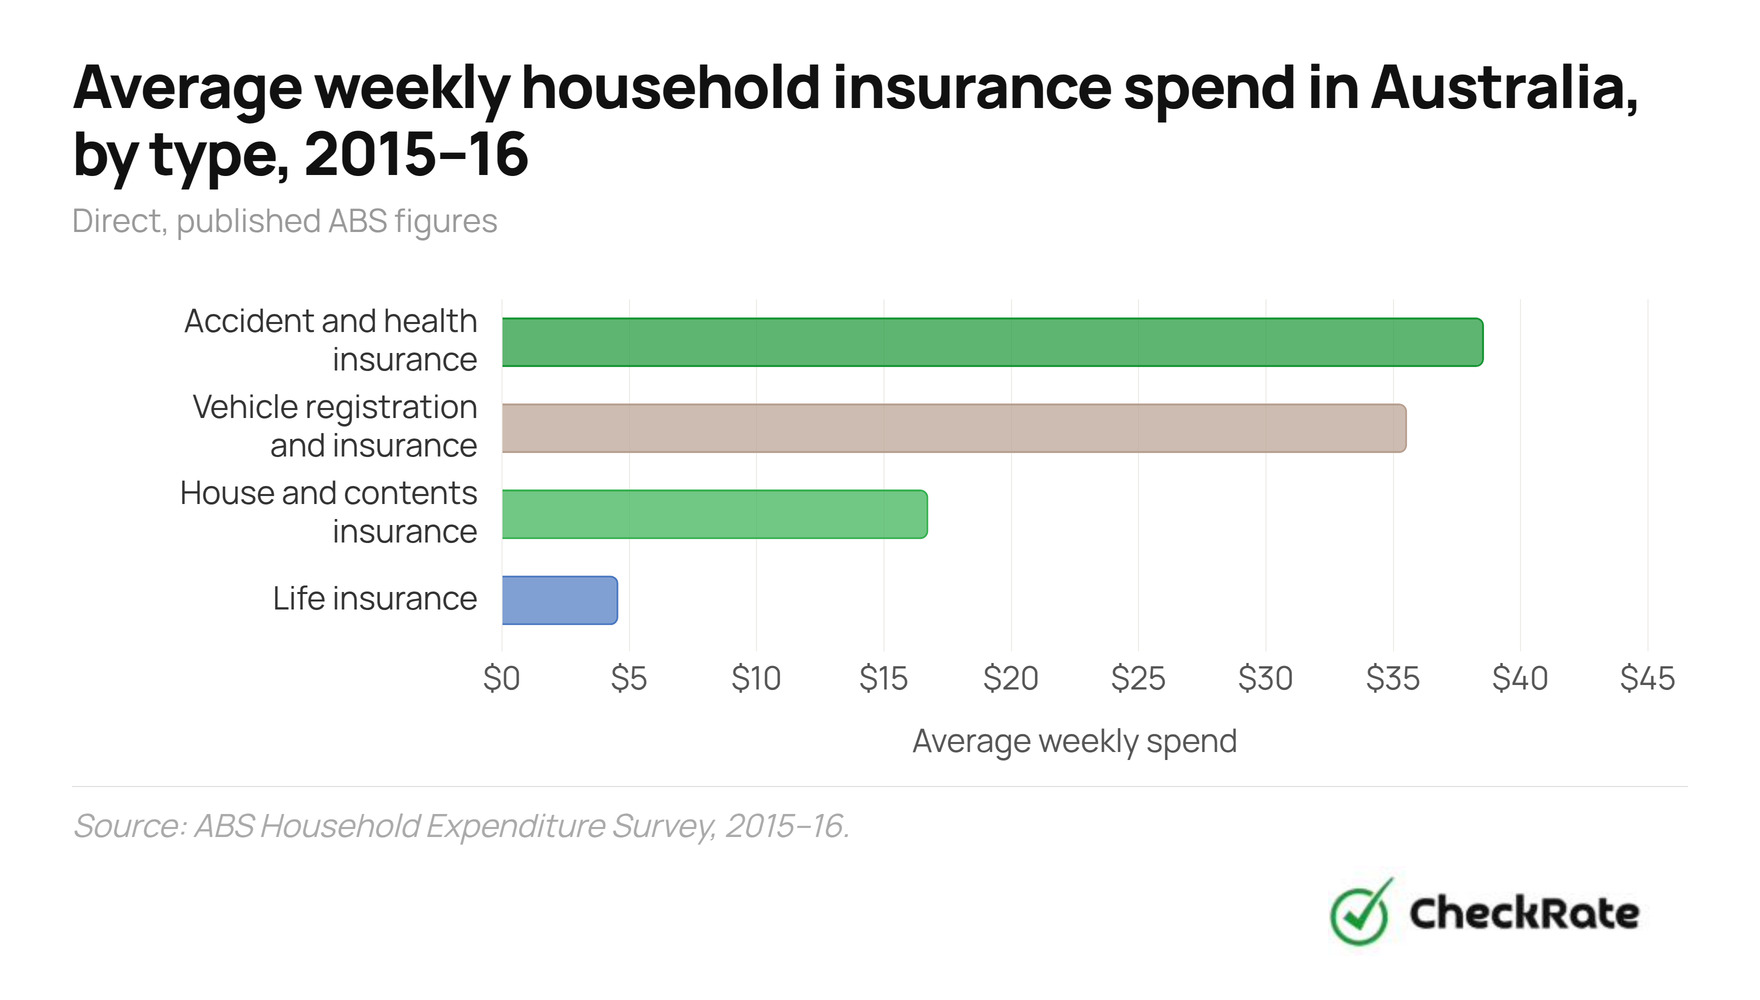
- House and contents insurance ($16.74 a week) sits inside current housing costs
- Accident and health insurance ($38.56 a week) is folded into medical care and health expenses
- Life insurance is grouped with superannuation under selected other payments
- Vehicle insurance is bundled with registration inside transport
| Insurance line item | Where the ABS places it |
|---|---|
| House and contents insurance | Current housing costs |
| Accident and health insurance | Medical care and health expenses |
| Hospital, medical and dental insurance | Within accident and health insurance |
| Vehicle registration and insurance | Transport (combined, not a pure premium line) |
| Life insurance | Selected other payments |
| Superannuation and annuities | Selected other payments |

Spending by insurance type in 2015–16
Ranked from largest to smallest, the published figures show an order: health cover first, then the vehicle line, then house and contents, with life, travel and personal belongings insurance a distant tail.
Why the vehicle insurance figure is not used as a current motor premium
The ABS vehicle line should not be treated as an average motor insurance premium. The published $35.54 weekly figure combines registration and insurance costs. It includes $18.72 for motor insurance, $11.36 for combined registration and insurance that cannot be split from the published tables, and $5.46 for registration only.
For this reason, this article does not use the ABS vehicle registration and insurance line as a current motor insurance estimate. Later sections also treat the ABS Insurance Consumer Price Index carefully because that index combines house, contents and motor vehicle insurance price changes.
Insurance spending forms part of broader household budget categories that have also grown over time. The table below shows how those wider categories, including current housing costs and medical care and health expenses, where house and contents and accident and health insurance sit, changed between 2003–04 and 2015–16.
| Category | 2003–04 | 2009–10 | 2015–16 | Change since 2009–10 |
|---|---|---|---|---|
| Current housing costs | $143.50 | $223.14 | $279.12 | +25.1% |
| Medical care and health expenses | $45.78 | $65.60 | $82.38 | +25.6% |
| Transport | $139.25 | $192.87 | $206.69 | +7.2% |
| Superannuation and life insurance | $22.71 | $73.73 | $77.14 | +4.6%* |
| Total goods and services expenditure | $892.83 | $1,236.28 | $1,425.03 | +15.3% |
Who pays more: income, tenure and household type
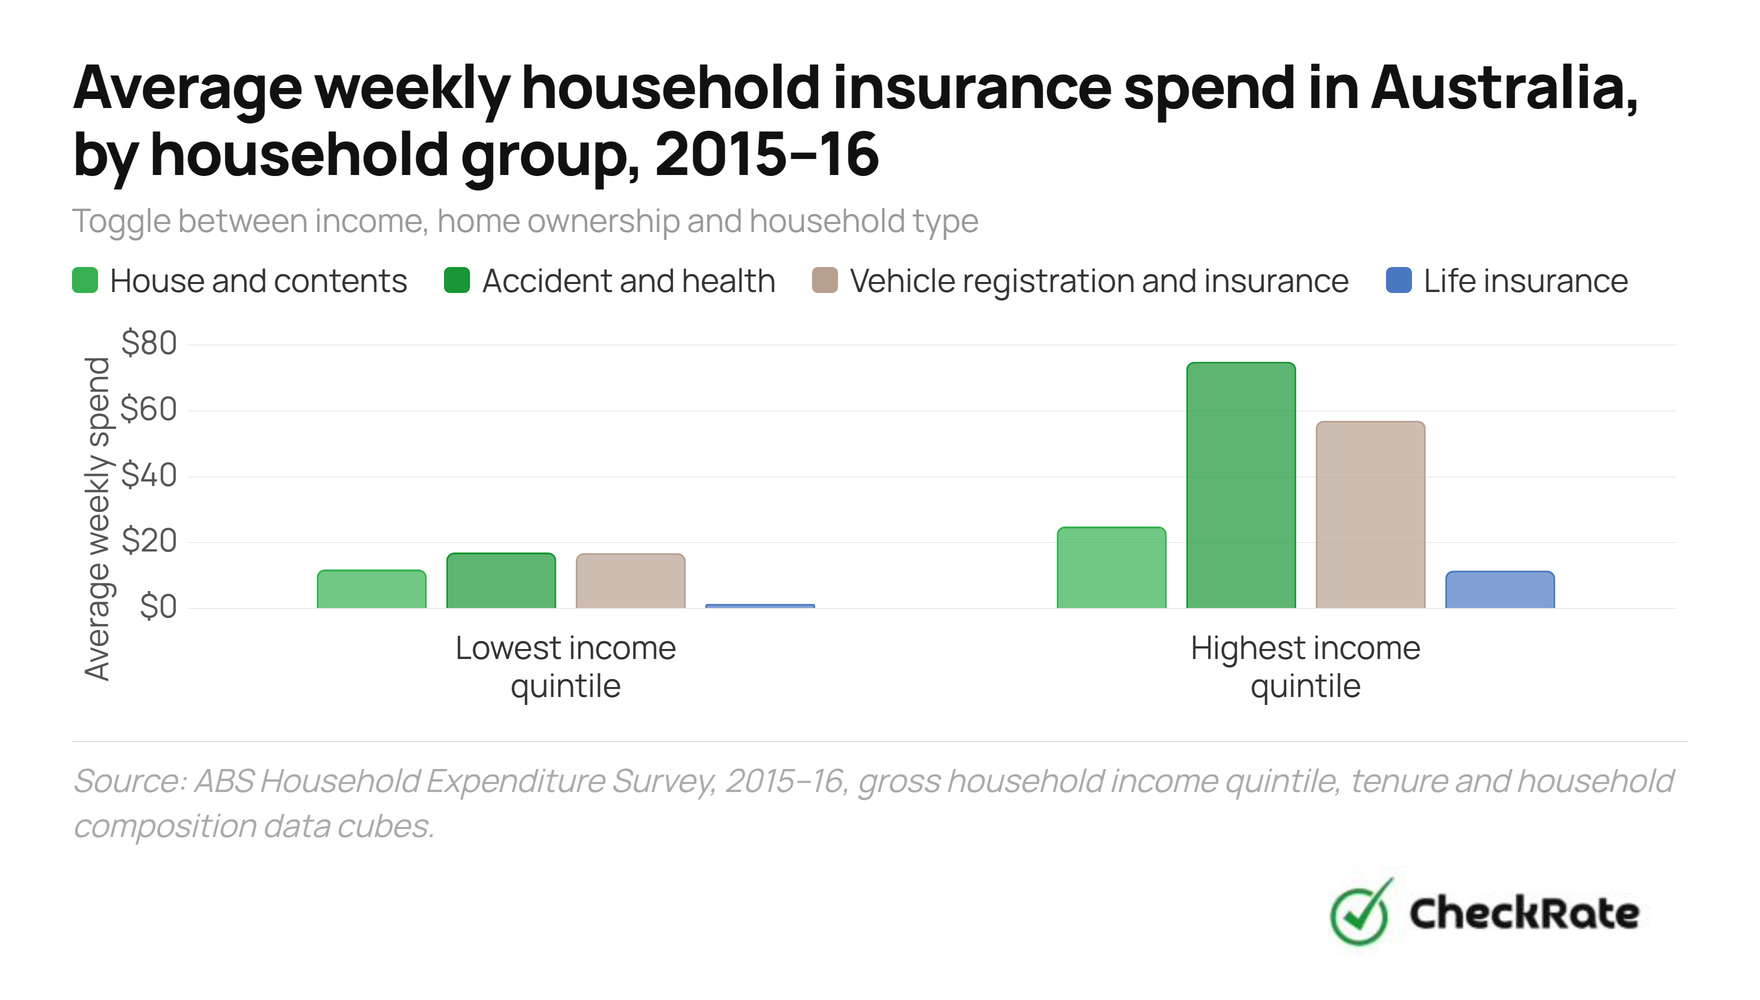
The gaps between different types of households are just as revealing as the totals. Higher-income households and homeowners consistently paid more in raw dollar terms – though as the budget-share note below shows, that's not the same as insurance being more affordable for everyone else.
- House and contents
- Accident and health
- Vehicle registration and insurance
- Life insurance
Couple families with dependent children spent almost double the house and contents insurance of one-parent families, $20.06 a week against $10.34. Life insurance spending by household type wasn't separately published in the data used here, which is why it appears as a gap in the chart above rather than as zero.
How much have insurance prices increased since 2016?
The ABS Insurance Consumer Price Index rose 16.4% in the year to March 2024, the fastest March-quarter annual rise in this series since 2001. Annual growth then eased to 7.6% in the year to March 2025 and 4.4% in the year to March 2026 — prices were still rising, just at a slower annual rate.
The Insurance CPI is the main official trend indicator for insurance price changes, since the ABS's 2015–16 Household Expenditure Survey remains the latest direct measure of household insurance spending. The CPI "Insurance" expenditure class tracks price changes for house, contents and motor vehicle insurance. It does not measure actual household spending, and it does not cover life insurance or private health insurance.
Measured by index levels, the ABS Insurance CPI increased by approximately 73% between March 2016 and March 2026. This should not be described as "adding up" annual percentage changes. It is a change in the index level over the decade.
The newer monthly CPI series shows the same category was still rising in the year to May 2026. ABS data shows Insurance increased by 5.5% over the twelve months to May 2026, while the broader Insurance and financial services group rose 3.2%. The ABS attributed the insurance increase to higher premiums for motor vehicle, house and home contents insurance.
Have insurance prices risen faster than wages in Australia?
Insurance prices have risen much faster than wages over the past decade. Comparing the ABS Insurance Consumer Price Index with the ABS Wage Price Index shows that insurance price growth has outpaced wage growth since 2016.
This is an index comparison, not a direct measure of household spending or household income. The Insurance CPI tracks price changes for house, contents and motor vehicle insurance. The Wage Price Index tracks changes in hourly wage rates, excluding bonuses, and is not the same as total household income.
- Insurance (CPI)
- Wage Price Index
Between March 2016 and March 2026, the ABS Insurance CPI increased by approximately 73%, while the Wage Price Index increased by approximately 30%. On this measure, insurance prices rose at more than twice the pace of wages over the decade.
This does not show how much households spent on insurance in 2026, or how insurance costs changed for every household. It does show that the official price index for insurance increased much faster than the official wage index over the same period.
How much is household insurance estimated to cost in Australia in 2026?
Selected household insurance costs are estimated at about $81 a week in 2026, based on official price and premium movements since the last ABS household spending benchmark.
This is a partial modelled estimate, not an official 2026 household spending figure. It includes house and contents insurance, plus the ABS accident and health insurance category. It excludes motor insurance, life insurance, travel insurance, pet insurance, landlord insurance and income protection insurance.
The estimate is included to show how selected insurance costs may have changed when later official data is applied to the older ABS benchmark. It should not be read as an average premium paid by policyholders.
- House and contents insurance: The 2015–16 ABS figure is increased using the ABS Insurance CPI from March 2016 to March 2026. This is a proxy because the ABS Insurance CPI covers house, contents and motor vehicle insurance together, rather than house and contents insurance alone.
- Accident and health insurance: The $33.42 hospital, medical and dental insurance sub-line is increased by approximately 40%, using compounded Australian Government approved industry-average private health insurance premium changes for the ten premium rounds from 1 April 2017 to 1 April 2026. 2017 is used as the starting point, rather than 2016, because the 2015–16 ABS survey period runs to 30 June 2016 and so already partly reflects the 1 April 2016 premium round. The remaining $5.14 in the ABS accident and health insurance category is held unchanged because no matching official price series is used for that residual amount.
- Life insurance: No 2026 estimate is supplied. Life insurance is not tracked by the ABS CPI, and this article does not use a proxy to update the 2015–16 ABS figure.
- Motor insurance: No separate 2026 estimate is supplied. The ABS vehicle registration and insurance line combines registration and insurance costs, while the ABS Insurance CPI combines motor vehicle insurance with house and contents insurance. Using either series as a stand-alone motor insurance estimate would overstate the precision of the calculation.
- Cover levels: Changes in the amount of cover households buy, such as higher sums insured for homes, contents or rebuilding costs, are not captured. The estimates apply price and premium movements to the older ABS spending benchmark; they do not use private-sector quote data or premium survey data.
How have insurance prices changed in Australia since 2000?
The longer ABS Insurance CPI series shows that insurance price growth has not followed a steady path. Since 2000, the sharpest increases have come in bursts, including 2000–01, 2009 and the recent 2023–24 surge.
The largest March-quarter annual increases in this period were 19.7% in 2000, 18.1% in 2001 and 16.4% in 2024. The 2024 increase was the fastest March-quarter annual rise in the ABS Insurance CPI since 2001.
Measured by index levels, the Insurance CPI rose from 26.45 in March 2000 to 103.32 in March 2026. That means the price level tracked by this index was about 3.9 times higher than it was in March 2000.
The recent increase is also visible in the index level. Between March 2024 and March 2026, the Insurance CPI rose from 91.99 to 103.32. That two-year increase accounted for about 15% of the total index-point rise between March 2000 and March 2026.
What does the data show about insurance affordability pressure?
Official data shows insurance prices have risen faster than wages, householders insurance remains under financial pressure despite rising premiums, and the cyclone reinsurance pool has reduced premiums only for some higher-risk policyholders. There is no single official affordability index covering every type of insurance — these are separate indicators rather than one combined measure.
Private health insurance costs also increased in 2026
The Australian Government approved an industry-average private health insurance premium increase of 4.41% from 1 April 2026. This was the largest approved average increase since 2017.
APRA's March 2026 private health insurance data also shows higher out-of-pocket costs. The average out-of-pocket payment for a hospital episode was $511.02 in the March 2026 quarter, up 8.9% from a year earlier. The average out-of-pocket payment for a general treatment ancillary service was $65.02, up 5.5% from a year earlier.
References
- 1ASIC Moneysmart: Insurance – Overview of common insurance types, including life, income protection, travel and pet insurance.
- 2ASIC Moneysmart: Choosing car insurance – Motor vehicle insurance types, including compulsory third-party, third-party property, fire and theft, and comprehensive cover.
- 3PrivateHealth.gov.au: What is covered by private health insurance? Hospital, general treatment, extras and ambulance cover.
- 4Smartraveller: Travel insurance – Australian Government travel insurance guidance.
- 5APRA: Our functions – APRA's prudential supervision role for general, life and private health insurers.
- 6ABS: Household Expenditure Survey, Australia: Summary of Results, 2015–16 – Latest official ABS household expenditure benchmark.
- 7ABS: Corporate Plan 2025–26, Forward Work Program – Includes the next Household Expenditure Survey scheduled for 2028–29.
- 8ABS: Consumer Price Index, Australia, March 2026 – Quarterly CPI data for the Insurance CPI to March 2026.
- 9ABS: Consumer Price Index, Australia, May 2026 – Monthly CPI release showing the annual rise in Insurance to May 2026.
- 10ABS: Consumer Price Index Concepts, Sources and Methods, 2025 – CPI coverage, classifications and methodology.
- 11ABS: Wage Price Index, Australia, March 2026 – Wage Price Index data used to compare insurance price growth with wage growth.
- 12Department of Health, Disability and Ageing: 2026 private health insurance premiums – 4.41% industry-average premium increase from 1 April 2026.
- 13Department of Health: Average annual price changes in private health insurance premiums – Annual industry-average premium changes 1997 to 2026.
- 14APRA: Quarterly private health insurance membership and benefits summary, March 2026 – Membership, benefits and out-of-pocket cost data.
- 15APRA: Quarterly general insurance performance statistics, September 2023 to March 2026 – Class-of-business statistics for householders insurance.
- 16ACCC: Insurance monitoring report 2026 – Fifth and final report on the cyclone reinsurance pool, published 25 June 2026.
Data Snapshots