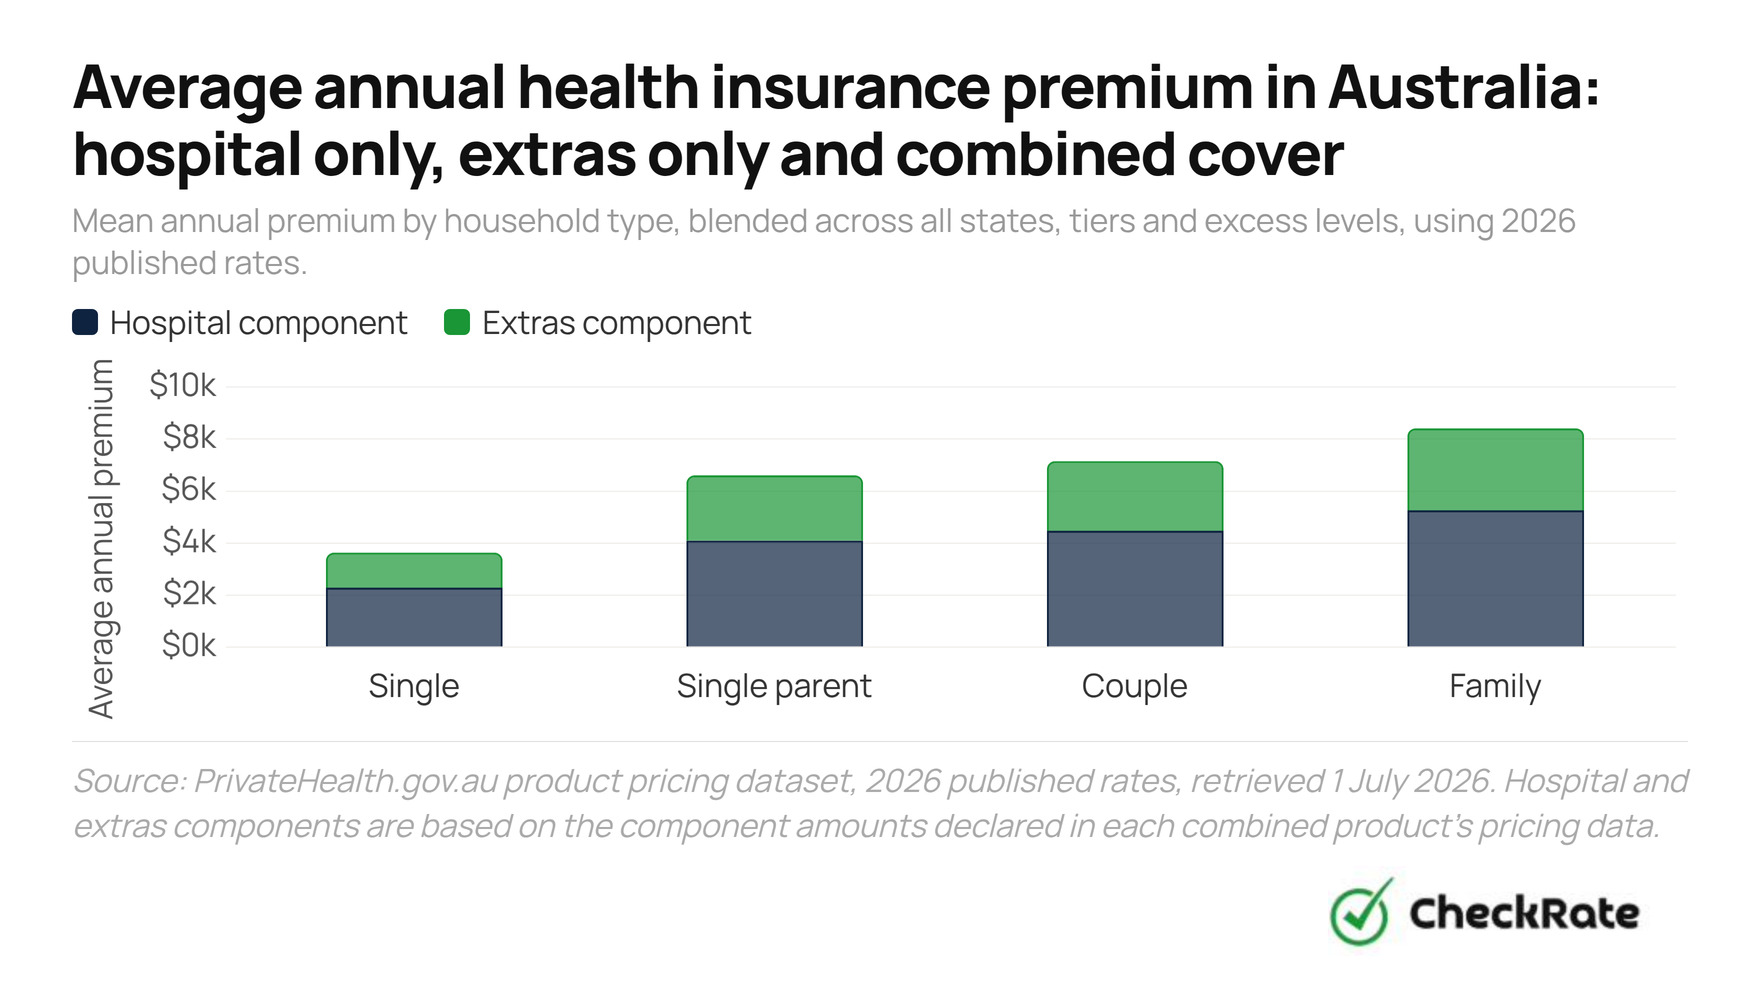
Combined hospital and extras cover for a single person averaged $3,632 a year in 2026, based on rates that took effect on 1 April 2026. Couples paid $7,154 on average, and families $8,415. Premiums rose 4.41% this round, the largest single increase since 2017, adding to a run of rises that has pushed average premiums up by roughly 40% over the past decade.
What is the average listed health insurance premium in Australia?
Combined hospital and extras cover for a single person had a mean listed premium of $3,632 a year, or $303 a month, in 2026. The equivalent mean listed premiums were $7,154 a year, or $596 a month, for a couple; $6,605 a year, or $550 a month, for a single-parent family; and $8,415 a year, or $701 a month, for a family covering two adults and dependants.
These figures are published list prices before the Australian Government Rebate and before any Lifetime Health Cover loading. They are not weighted by membership, state population, policy selection or the number of people who hold each product.
The averages are calculated across published prices for products open to new members in the PrivateHealth.gov.au pricing dataset. The dataset includes more than 70,000 product, state and excess combinations across hospital, extras and combined policies. Products no longer open to new members are excluded because they are not available to someone comparing new policies.
The mean sits above the median for both figures shown here, which indicates a smaller number of higher-priced policies pull the average upward. For single-person combined cover, the mean listed premium is $3,632 a year, and the median is $3,454, a difference of $178.
For hospital-only cover, the gap is wider. Across all household types, the mean listed premium is $4,496, and the median is $4,014. This reflects a broad spread of prices, from lower-cost Basic products for a single person to higher-priced Gold family policies.
| Household type | Hospital only | Extras only | Combined cover |
|---|---|---|---|
| Single | $2,536 | $1,016 | $3,632 |
| Couple | $4,831 | $1,952 | $7,154 |
| Single-parent family | $4,398 | $1,797 | $6,605 |
| Family (couple + dependants) | $5,581 | $2,439 | $8,415 |
Source: PrivateHealth.gov.au product pricing dataset, 2026 published rates, retrieved 1 July 2026.

Cost also depends on where a policy is bought. Hospital-only cover for a single person averages $1,804 a year in the Northern Territory, the cheapest jurisdiction, rising to $2,822 in Victoria, the most expensive. That is a gap of more than $1,000 a year. It is not a like-for-like comparison of identical policies, though, since the mix of funds, tiers and excess levels on offer varies from state to state.
How much do Basic, Bronze, Silver and Gold health insurance policies cost?
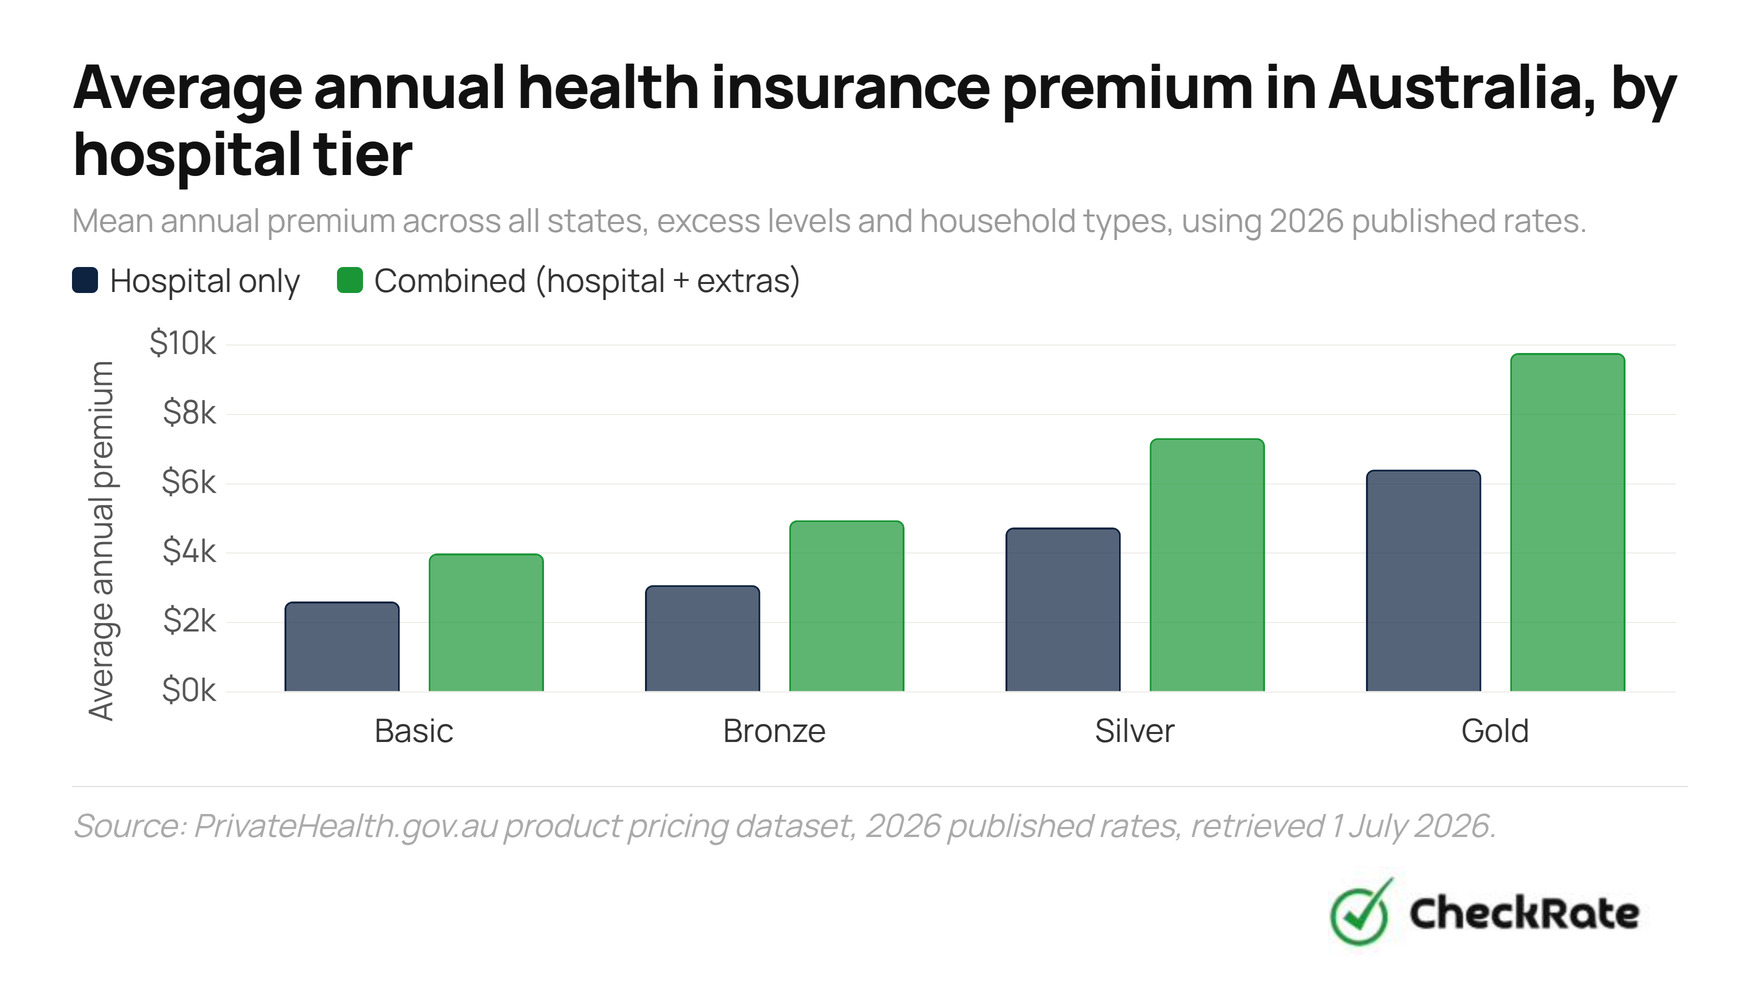
Hospital-only cover had a mean listed premium of $2,607 a year for Basic policies, $3,079 for Bronze, $4,739 for Silver and $6,409 for Gold, blended across household types, states and excess levels. Combined hospital and extras cover followed the same order at a higher price: $3,990 for Basic, $4,948 for Bronze, $7,319 for Silver and $9,774 for Gold.
Hospital cover is classified into four tiers: Basic, Bronze, Silver and Gold. These tiers are not marketing labels. Each tier is tied to minimum hospital-treatment categories that must be covered. A policy can only use a tier name if it meets the minimum requirements for that tier.
- Basic is the minimum hospital tier, with restricted or limited cover for a small number of hospital-treatment categories.
- Bronze includes more unrestricted hospital-treatment categories than Basic.
- Silver covers a wider set of hospital-treatment categories again, including many common procedures.
- Gold is the highest tier and is the only tier required to cover all 38 clinical categories without restriction, including pregnancy and birth, assisted reproductive services and joint replacements.
Funds can also offer "Plus" versions of Basic, Bronze or Silver that add extra categories beyond the tier minimum. This is why the market data blends standard and Plus products within each tier group.
| Tier | Hospital only | Combined | Typically covers |
|---|---|---|---|
| Basic | $2,607 | $3,990 | Minimum hospital-tier requirements, with limited or restricted cover for many clinical categories. |
| Bronze | $3,079 | $4,948 | Basic's categories plus around 18 further unrestricted treatments |
| Silver | $4,739 | $7,319 | Most common procedures, including joint reconstructions, hernias and gynaecology, but not pregnancy or joint replacements |
| Gold | $6,409 | $9,774 | All 38 clinical categories, unrestricted, including pregnancy and birth, IVF and joint replacements |
Source: PrivateHealth.gov.au product pricing dataset, 2026 published rates; tier requirements from PrivateHealth.gov.au, Product tiers.
Excess works in the opposite direction: a higher excess, the amount paid out of pocket before the fund contributes to a hospital admission, lowers the premium.
How much do hospital, extras and combined health insurance policies cost?
Hospital cover costs more than extras cover on its own. For a single person, hospital-only cover averages $2,536 a year, compared with $1,016 for extras-only cover, a ratio of about 2.5 to 1. Combined cover, which bundles both, averages $3,632, only about $80 more a year than buying hospital and extras separately at market-average prices.
Hospital cover and extras cover pay for different things.
- Hospital cover pays toward the cost of being admitted to hospital as a private patient: accommodation, theatre fees and the Medicare Benefits Schedule gap on the treating doctor's bill.
- Extras cover, also called general treatment, pays toward everyday services Medicare does not cover, such as dental, optical and physiotherapy.
- Combined policies bundle both under one premium.
These figures are calculated from different sets of products, so the $80 difference doesn't reflect a matched comparison of one insurer's hospital, extras and combined policies, and doesn't show whether individual insurers offer a bundle discount.
How health insurance costs vary by age and household type
The listed premium for a specific private health insurance policy generally does not change simply because the policyholder is older or younger. A 25-year-old and a 55-year-old usually pay the same listed price for the same product, household type, state and excess level.
What can change the final amount paid are government settings that sit on top of the listed premium. These include the Australian Government Rebate, the optional age-based discount for people who take out hospital cover before 30, and Lifetime Health Cover loading for people who first take out hospital cover later.
Household type has a more direct effect: a couple pays close to double the singles rate, and a family pays the most of any household type on average.
Moving from a single policy to a couple's policy roughly doubles the premium. Moving from a couple to a family adds a further 18% on average, reflecting the family pricing scale itself rather than a per-child charge; most funds do not charge separately for each dependent child.
The age-based discount for people under 30
Since 1 April 2019, insurers can offer people aged 18 to 29 a discount on the hospital component of their premium.
- The discount is 2% for every year a person is under 30 when they first take out eligible hospital cover, up to a maximum of 10% for people aged 18 to 25.
- It applies whether the person holds hospital cover alone or as part of a combined policy.
- It does not apply to extras-only cover, and does not apply to a young adult covered as a dependant on someone else's family or single-parent policy.
- Offering the discount is optional for insurers.
Example age-based discount on a single hospital-only policy
Illustrative saving based on the $2,536 mean listed premium for single hospital-only cover in this article. The example assumes the insurer offers the full age-based discount.
The discount is retained at the level first set until the policyholder turns 41. It then reduces by 2 percentage points each year until it reaches zero. On a couple or family policy, the discount is averaged across the adults covered by the policy.
Lifetime Health Cover loading, for people who join later
A separate setting works against people who delay hospital cover. Lifetime Health Cover (LHC) loading adds to the hospital premium for every year of age over 30 that a person is when they first take out hospital cover.
- The loading is 2% per year of age over 30, capped at 70%.
- It applies only to the hospital component of the premium.
- It is removed entirely after 10 years of continuous cover.
- It does not apply to extras-only cover.
Example Lifetime Health Cover loading on a single hospital-only policy
Illustrative extra cost based on the $2,536 mean listed premium for single hospital-only cover in this article. The example uses certified age of entry, not simply the person's birthday age when they buy a policy.
How much have health insurance premiums increased in Australia?
The Australian Government approved an average industry-wide private health insurance premium increase of 4.41% from 1 April 2026, up from 3.73% in 2025 and 3.03% in 2024. It was the largest approved annual increase since 2017, when premiums rose by 4.84%.
Approved average premiums have increased by about 40% over the past decade, based on compounded industry-average increases from 2017 to 2026. Over the past 20 premium rounds, from 2007 to 2026, they increased by about 141% on the same compounded basis.
Each year, health insurers submit proposed premium changes to the Australian Government for approval. The approved industry-average figure is weighted across policy subgroups and membership, so individual funds and individual policies can increase by more or less than the headline average.
The size of the increase varies widely by fund. For the 2026 round, the smallest approved rise was 1.98%, from GMHBA, a not-for-profit fund, and the largest was 5.98%, from AIA. Larger listed insurers, including Bupa, Medibank and NIB, also approved rises above the 4.41% industry average.
Compared with general prices, premium rises have outpaced inflation in some years and lagged behind it in others. Premium increases were consistently larger than headline CPI from 2016 to 2020.
That pattern reversed from 2021 to 2023, when broader inflation, including a CPI peak of 7.8% in 2022, ran ahead of premium growth, which stayed close to 2.7% to 2.9% through that period. Premiums moved back above CPI in 2024, then fell just behind it again in 2025.
How health insurance premiums compare with wages and rebates
Combined hospital and extras cover for a single person, at a mean listed premium of $3,632 a year or about $70 a week, is equivalent to about 3.4% of the $2,051.10 seasonally adjusted average weekly ordinary-time earnings for full-time adults in November 2025, before any government rebate.
This is a simple wage benchmark, not a measure of household affordability. It compares a mean listed premium with gross full-time adult earnings and does not account for income tax, part-time work, household income, policy selection, rebates or out-of-pocket medical costs.
After the Australian Government Rebate, the same mean listed premium falls to about $2,756 a year, or $53 a week, for a person under 65 who is eligible for the Base Tier rebate.
The Australian Government Rebate is an income-tested percentage applied to private health insurance premiums. It can apply to hospital, extras and combined policies. The rebate depends on income tier and the age of the oldest person covered by the policy.
- The rebate can apply to standalone extras cover, unlike the Medicare Levy Surcharge and Lifetime Health Cover loading, which relate to hospital cover.
- The rebate does not apply to the Lifetime Health Cover loading component of a premium.
- Rebate income thresholds changed from 1 July 2026, while the rebate percentages shown below apply from 1 April 2026 to 31 March 2027.
| Tier | Singles income | Family income | Rebate, under 65 | Rebate, 65-69 | Rebate, 70+ |
|---|---|---|---|---|---|
| Base Tier | ≤$105,000 | ≤$210,000 | 24.118% | 28.139% | 32.158% |
| Tier 1 | $105,001-$123,000 | $210,001-$246,000 | 16.079% | 20.098% | 24.118% |
| Tier 2 | $123,001-$164,000 | $246,001-$328,000 | 8.038% | 12.058% | 16.079% |
| Tier 3 | ≥$164,001 | ≥$328,001 | 0% | 0% | 0% |
Source: Australian Taxation Office, Income thresholds and rates for the private health insurance rebate, updated 26 February 2026.
The same Base Tier rebate applied to the average hospital-only policy for a single person brings the mean listed premium from $2,536 to about $1,924 a year, or $37 a week.
People without an appropriate level of hospital cover may also be liable for the Medicare Levy Surcharge if their income is above the relevant threshold. The surcharge ranges from 1% to 1.5% of income, depending on income tier.
Wage growth was lower than the approved 2026 premium increase. The Wage Price Index rose 3.3% over the year to the March 2026 quarter, compared with the approved 4.41% average private health insurance premium increase from 1 April 2026.
The ABS monthly Consumer Price Index showed that all-groups CPI rose 4.0% over the year to May 2026. The Health group rose 3.8%, while Medical and hospital services rose 5.0%. The ABS said Medical and hospital services was the main contributor to the Health group increase, due to higher medical fees and private health insurance premiums.
Premiums are not the only cost of holding private hospital cover. APRA reports additional out-of-pocket costs on top of the premium itself:
- The average out-of-pocket payment for a hospital episode was $511.02, up 8.9% from the March 2025 quarter.
- The average medical gap, where a medical gap was paid, was $245.08.
- Orthopaedic services had the highest average medical gap where a gap was paid, at $849.93.
Separately, the Department of Health, Disability and Ageing said the hospital benefits ratio, the share of premium revenue paid out as benefits, reached 85.9% in the 12 months to September 2025. It projected the ratio would rise to 87% for the 12 months from 1 April 2026.
References
- 1data.gov.au: PrivateHealth.gov.au dataset, July 2026 ZIP file, retrieved 1 July 2026: the underlying product-level data for Hospital, General Treatment (extras) and Combined policies open to new members, including premiums, excess levels, hospital tiers and household coverage, used to calculate the average premium figures in this piece.
- 2Department of Health, Disability and Ageing: Average annual price changes in private health insurance premiums, 1997 to 2026.
- 3Department of Health, Disability and Ageing: 2026 Private Health Insurance Premiums (17 February 2026): the approved 4.41% average 2026 increase, government rebate expenditure, and the hospital benefits ratio.
- 4APRA: Quarterly private health insurance membership and benefits summary, March 2026: average out-of-pocket (gap) payments.
- 5APRA: Quarterly private health insurance statistics, March 2026: hospital cover coverage rates, Lifetime Health Cover loading statistics.
- 6Australian Taxation Office: Income thresholds and rates for the private health insurance rebate, 2026-27.
- 7Australian Taxation Office: Appropriate level of private patient hospital cover.
- 8PrivateHealth.gov.au: Product tiers.
- 9PrivateHealth.gov.au: Lifetime Health Cover.
- 10PrivateHealth.gov.au: Age-based Discount.
- 11ABS: Average Weekly Earnings, Australia, November 2025.
- 12ABS: Wage Price Index, Australia, March 2026.
- 13ABS: Consumer Price Index, Australia, May 2026.
- 14ABS: Consumer Price Index, Australia, December 2025.
- 15ABS: Household Expenditure Survey, Australia: Summary of Results, 2015-16.
Premium averages are calculated from the PrivateHealth.gov.au July 2026 product pricing dataset, downloaded from data.gov.au and retrieved on 1 July 2026. The analysis includes hospital, extras and combined policies open to new members.
Figures are simple means across published product, state and excess combinations. They are not weighted by membership, state population, policy selection or actual premiums paid. Unless stated otherwise, figures are shown before the Australian Government Rebate, Lifetime Health Cover loading and age-based discounts.
The dataset is a published-price snapshot that largely reflects premiums effective from 1 April 2026. Premium history, membership, Lifetime Health Cover and out-of-pocket figures are from the Department of Health, Disability and Ageing and APRA. Rebate and Medicare Levy Surcharge settings are from the ATO. Wage, inflation and household spending figures are from the ABS.
Cumulative premium growth is calculated by compounding the approved annual industry-average premium increases published by the Department of Health, Disability and Ageing.
Data Snapshots