The ACCC's June 2026 insurance monitoring report puts the national average home contents insurance premium at $531 in 2024-25, up 20.1% since 2021-22, with premiums varying sharply by region and cyclone risk. Landlord insurance is measured differently: no official body publishes a national average premium, though the ATO's data-matching program tracks an estimated 1.6 million policies a year.
How much do contents and landlord insurance cost in Australia?
The Australian Competition and Consumer Commission (ACCC) reported the national average home contents insurance premium at $531 a year in 2024-25, the most recent year with published figures.
That number comes from the ACCC's fifth and final insurance monitoring report, released in June 2026. Combined home and contents cover averaged $2,360 in the same year, while home building cover averaged $1,852.
Landlord insurance is still represented in major official compliance datasets. The Australian Taxation Office (ATO) acquires landlord insurance policy and premium data directly from insurers under a dedicated data-matching program expected to cover approximately 1.6 million individuals in each financial year from 2021-22 to 2025-26. It separately reports that 2,335,540 individuals held an interest in a rental property in the 2023-24 income year, up from 2,261,080 the year before.
Landlord insurance premiums are among the rental property expenses that may be deductible when a property is rented or available to rent on commercial terms. Deductions may need to be apportioned where an expense also relates to private use.
What do contents and landlord insurance cover?
Contents insurance covers belongings inside a home, such as furniture, appliances and clothing, rather than the building itself. It can be bought on its own by renters and owners alike, or bundled with building cover.
Landlord insurance may cover risks specific to renting out a property, potentially extending beyond what a standard home or contents policy provides. Inclusions, exclusions and limits vary between policies and providers.
What is the average cost of contents insurance?
A national average of $531 does not mean every household pays that amount. The ACCC's data splits contents cover into two broad regions, and the gap between them is real: households in Northern Australia, broadly the tropical north of Queensland, the Northern Territory and parts of Western Australia, paid $626 on average in 2024-25, about 19% more than the $527 average across the rest of the country.
The ACCC defines Northern Australia as all of the Northern Territory and the parts of Queensland and Western Australia that intersect with or are north of the Tropic of Capricorn.
The ACCC also reports premiums relative to the amount of cover provided.
A household in a small unit and one in a large house might both hold contents insurance, but they may insure different values of belongings. Measured per $100,000 of sum insured, the national contents premium was $636 in 2024-25, up 12.0% since 2021-22, a smaller rise than the 20.1% increase in raw premiums over the same period. The smaller increase may partly reflect changes in sums insured, although the data does not quantify their precise contribution.
What is the average cost of landlord insurance?
Landlord insurance sits inside some of the largest compliance datasets the Australian Taxation Office (ATO) holds, even though no single official body publishes a national average premium for it.
The ATO acquires landlord insurance policy and premium data directly from insurers, expected to cover approximately 1.6 million individuals in each financial year from 2021-22 to 2025-26.
A separate ATO property management program is expected to cover approximately 2.3 million individuals a year. ATO figures also show that 2,335,540 individuals held an interest in a rental property in the 2023-24 income year, up from 2,261,080 the year before.
The ATO uses landlord insurance data to check the reporting of rental income, expenses and capital gains, but it does not publish average premiums. ABS housing surveys provide broader information about rental and property ownership, but they also do not report landlord insurance costs.
- ATO: landlord insurance policy, premium and claims data used for tax compliance matching.
- ACCC: average premiums for home, contents, combined home and contents, strata and selected small business insurance.
- APRA: home insurance affordability, insurer performance and the broader insurance protection gap.
- ABS: changes in insurance prices through a combined index covering motor vehicle, house and home contents insurance.
The national averages of $531 for contents insurance and $1,852 for home building insurance are not landlord insurance averages and cannot be combined to estimate one. Landlord policies may combine different types of cover depending on the policy and property type; what is included varies by provider.
How home and contents insurance premiums vary by region in Australia
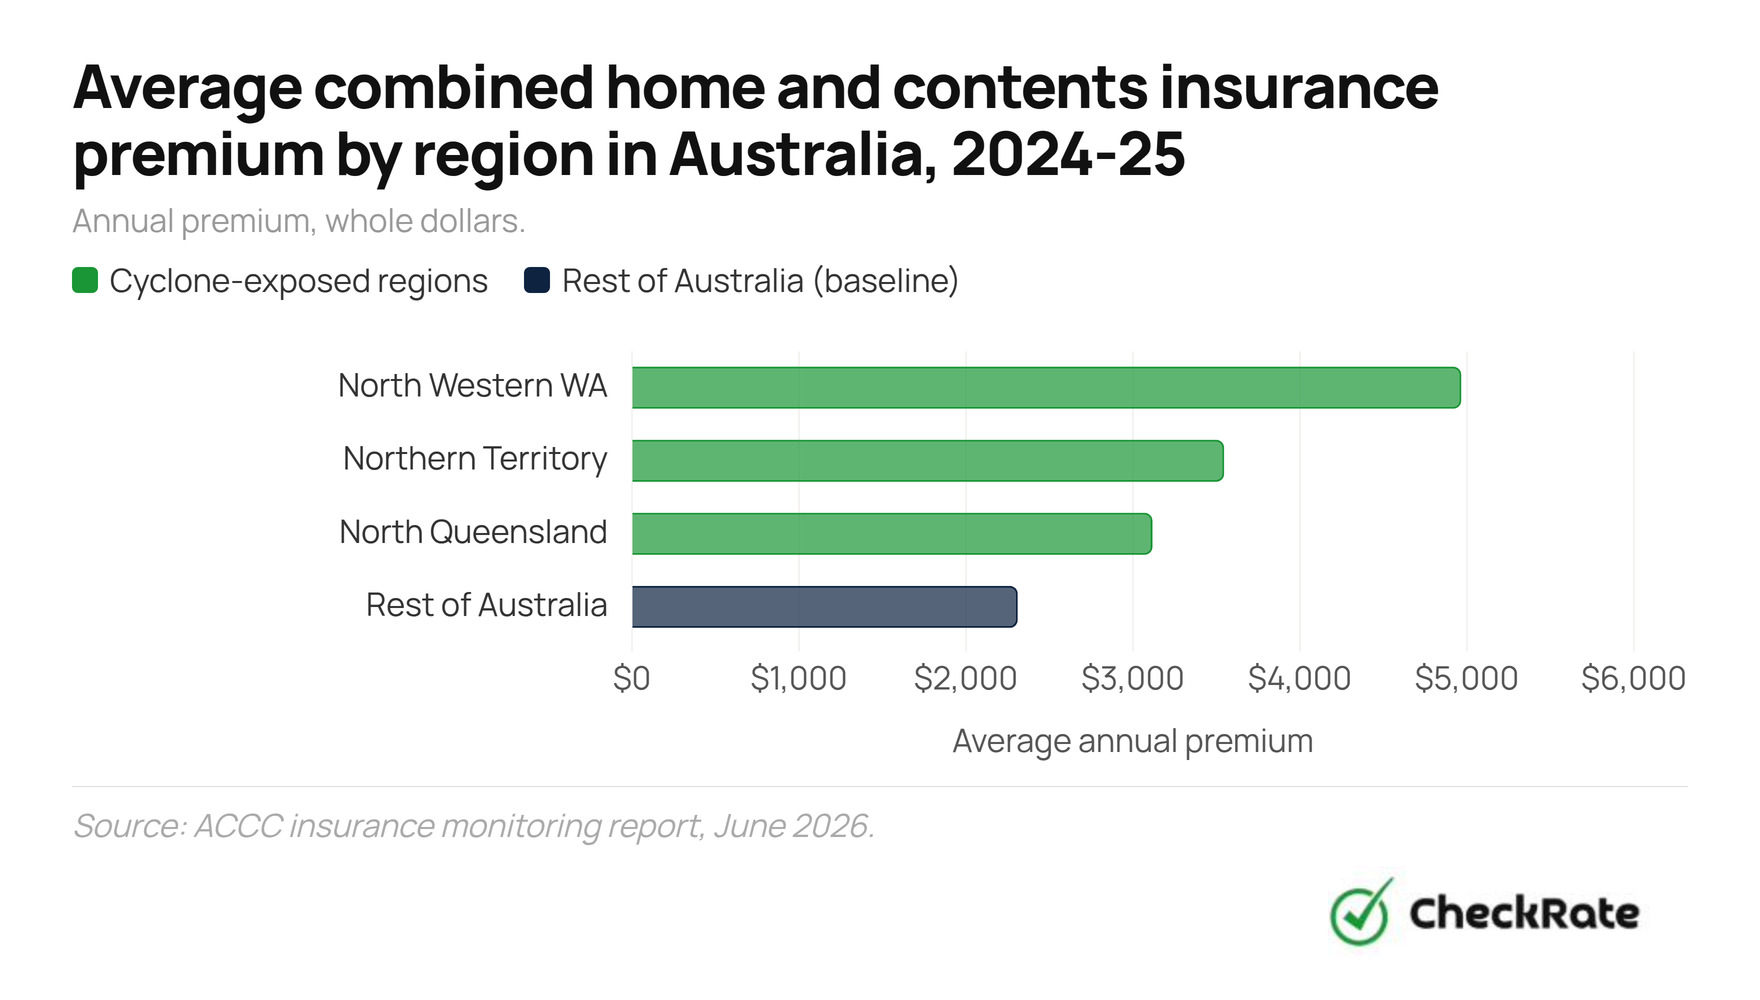
North Western Australia recorded the highest average combined home and contents insurance premium in 2024-25, at $4,966. This was more than double the $2,310 average across the rest of Australia. The Northern Territory averaged $3,546, while north Queensland averaged $3,117.
The ACCC reports these figures across four broad regions rather than all eight states and territories. The data covers combined home and contents insurance, not contents-only or landlord insurance.

The table below compares the four ACCC regions by average combined premium and against the rest-of-Australia average.
The ACCC separately reports insurers' average cost per policy across all home and contents products at $1,679 in Northern Australia and $1,252 in the rest of Australia. These are insurer costs, not consumer premiums, and the Northern Australia figure is not broken down across the three northern regions. Source: ACCC insurance monitoring report, June 2026.
North Western Australia's average was more than double the rest-of-Australia figure, and cyclone-exposed Northern Australia as a whole, the ACCC's broader grouping covering these three regions, averaged $3,233 for combined home and contents cover, about 40% higher than the $2,310 rest-of-Australia average.
The ACCC also found that the largest decreases in average premiums per $100,000 sum insured after insurers entered the cyclone reinsurance pool were concentrated in Northern Australia. Most of the largest increases occurred outside Northern Australia or in inland regions.
How insurance costs vary by property and cover type
Cover type has a major effect on the average premium, but the figures are not all directly comparable. Household policies cover an individual home or its contents, while strata insurance covers an entire complex and small business insurance applies to commercial premises.
| Product | Insured | Average premium |
|---|---|---|
| Home contents insurance | Household | $531 |
| Home building insurance | Household | $1,852 |
| Small business building and contents insurance | Small business | $2,064 |
| Combined home and contents insurance | Household | $2,360 |
| Strata insurance | Owners corporation | $8,780 |
The official premium data does not provide a dollar breakdown by occupancy. ASIC's Moneysmart service instead explains who is generally responsible for arranging building insurance and who may arrange contents cover.
| Occupancy | Building cover | Contents cover | Who usually arranges building cover |
|---|---|---|---|
| Owner-occupier (house) | Generally arranged by the owner | May be arranged by the owner | The owner |
| Renter | Generally the landlord's responsibility | May be arranged by the renter | The landlord |
| Landlord (freestanding property) | Generally arranged by the landlord | May apply to furnished items supplied with the property | The landlord |
| Owner in a strata scheme | Usually arranged by the owners corporation | May be arranged by the owner | The owners corporation |
For rental properties, building insurance is generally the landlord's responsibility, while contents insurance for a renter's belongings is separate. Moneysmart also notes that owners who bundle building and contents cover with the same insurer usually pay less than running two separate policies. A landlord's own building cover generally works similarly to an owner-occupier's.
How cyclone risk affects home insurance premiums
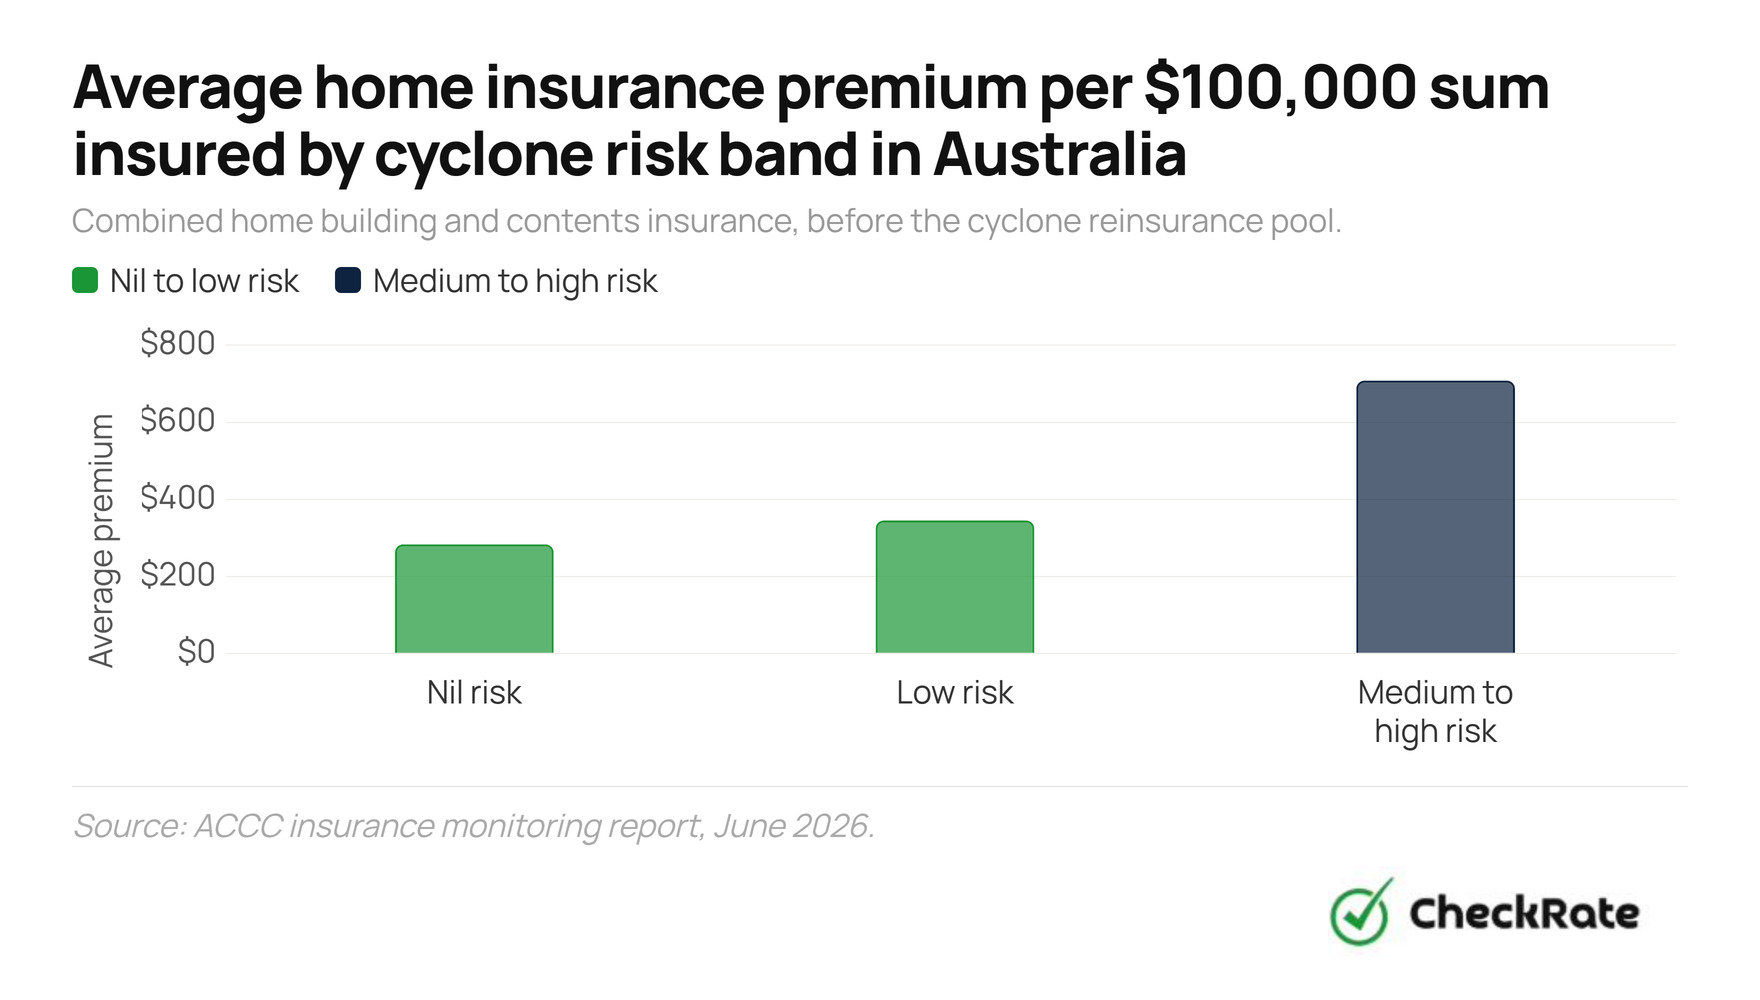
The ACCC's cyclone reinsurance pool data shows substantial differences in premiums by cyclone-risk level.
Measured per $100,000 of sum insured for combined home building and contents cover, premiums before the pool were $283 in areas with no cyclone risk, $345 in low-risk areas and $708 in medium to high-risk areas, roughly two and a half times the nil-risk figure.
After insurers joined the pool, average premiums in the highest-risk band fell to $628, an 11% drop, and were $606, or 14% below the pre-pool average, in the second year after entry. Over the same periods, premiums in nil-risk areas rose to $300 and then $306, up 6% and 8% respectively. The ACCC found that this pattern was consistent with the pool directing its largest benefits towards policyholders in higher cyclone-risk areas, while noting that other market factors also affect premiums.
The effect is visible at the city level too.
| City | Change since before the pool |
|---|---|
| Karratha, WA | down 15% |
| Mackay, Qld | down 14% |
| Cairns, Qld | down 12% |
| Townsville, Qld | down 3% |
How home insurance premiums have changed since 2021-22
Home building, combined home and contents, and strata insurance premiums have risen much faster than contents insurance since 2021-22. The national average contents premium rose 20.1% to $531 in 2024-25, while home building premiums rose 48.4%, combined home and contents cover rose 46.4%, and strata premiums rose 64.7%.
The ACCC's national premium series runs from 2021-22 to 2024-25 for home contents, home building, combined home and contents, and strata insurance. No comparable official landlord insurance premium series is published.
| Product | 2021-22 | 2022-23 | 2023-24 | 2024-25 | Change since 2021-22 |
|---|---|---|---|---|---|
| Home contents | $442 | $447 | $493 | $531 | +20.1% |
| Home building | $1,248 | $1,345 | $1,564 | $1,852 | +48.4% |
| Combined home & contents | $1,612 | $1,838 | $2,145 | $2,360 | +46.4% |
| Strata | $5,332 | $6,360 | $8,121 | $8,780 | +64.7% |
Contents insurance rose the least of the four, up 20.1% over three years. Combined home and contents cover rose 46.4%, while home building premiums rose 48.4% on its own. Strata premiums rose fastest in percentage terms, up 64.7%, although as noted above that figure covers an entire building rather than a single dwelling.
The most recent single-year movement was sharpest for building cover: home building premiums rose 18.4% between 2023-24 and 2024-25, more than double the 7.7% rise in contents premiums over the same year.
The ACCC's tabulated annual series only extends back to 2021-22. For a longer view, the ABS Consumer Price Index tracks a broader Insurance category covering house, contents and motor vehicle cover combined, which does not isolate contents insurance, but the index rose about 73% between the March quarter of 2016 and the March quarter of 2026, compared with a 30% rise in the original all-industries Wage Price Index over the same period. These percentages compare index movements, not dollar premiums or household expenditure.
This long-run comparison reflects percentage index movements rather than specific index values for the Insurance expenditure class. The original all-industries Wage Price Index increased from 123.2 to 160.3 over the same period. In the ABS May 2026 monthly CPI release, Insurance rose 5.5% over 12 months, reflecting increases in premiums for motor vehicle, house and home contents insurance.
What an insurance cost comparison includes
According to ASIC's Moneysmart service, price is only one part of comparing insurance policies. Its guidance covers:
- the premium and the excess
- exclusions and cover limits
- legal liability cover
- how a policy settles a claim, including replacement value compared with the item's current value
Moneysmart points to the Key Fact Sheet and Product Disclosure Statement as the basis for like-for-like comparisons. It also notes one trade-off in particular: a higher excess generally lowers the premium, but increases the amount paid out of pocket if a claim is made.
Moneysmart describes comparison websites as a useful starting point, but not a complete market view. It notes that comparison websites may not cover all options, and that some earn money through promoted listings or referral fees.
General information only
This article is based on published Australian insurance, tax and housing data from the ACCC, APRA, ABS, ATO and ASIC Moneysmart. It discusses average premiums, official datasets and market-wide trends. It does not provide financial, tax or insurance advice and does not take into account any individual's circumstances, property, location, policy terms or cover needs.
References
- 1.Australian Competition and Consumer Commission: Insurance monitoring report 2026, published 25 June 2026, including average premiums by product, region and cyclone-risk band.
- 2.Australian Competition and Consumer Commission: Cyclone reinsurance pool reduces premiums in high-risk areas but affordability pressures persist, media release, 25 June 2026.
- 3.Australian Prudential Regulation Authority: Mind the gap, an insurance climate vulnerability assessment, published 24 March 2026.
- 4.Australian Prudential Regulation Authority: Quarterly general insurance performance statistics, September 2023 to March 2026, released 29 May 2026.
- 5.Australian Bureau of Statistics: Consumer Price Index, Australia, May 2026 release, including the Insurance expenditure class.
- 6.Australian Bureau of Statistics: Wage Price Index, Australia, March quarter 2026 release, used for the insurance-versus-wages index comparison.
- 7.ASIC Moneysmart: Choosing home insurance, accessed July 2026.
- 8.ASIC Moneysmart: Contents insurance, accessed July 2026.
- 9.ASIC Moneysmart: Underinsurance, what it is and how to avoid it, accessed July 2026.
- 10.Australian Taxation Office: Landlord insurance 2021–22 to 2025–26 data-matching program protocol, last updated 9 June 2023.
- 11.Australian Taxation Office: Property management data-matching program protocol, 2018–19 to 2025–26 program, last updated 26 August 2024.
- 12.Australian Taxation Office: Individuals statistics for Taxation statistics 2023–24, Table 8, rental property interests, published 17 June 2026.
- 13.Australian Taxation Office: Common property expenses, rental property expenses guidance, last updated 21 May 2026.
- 14.Australian Bureau of Statistics: Survey of Income and Housing results will not be released, media statement, 17 July 2025.
Data Snapshots