Total national spending on pet insurance reached approximately $1.0 billion. Separately, the ABS price index for veterinary and other pet services rose by approximately 62% between the March quarters of 2015 and 2026, based on the weighted average of the eight capital cities.
How much do Australian households spend on pet insurance?
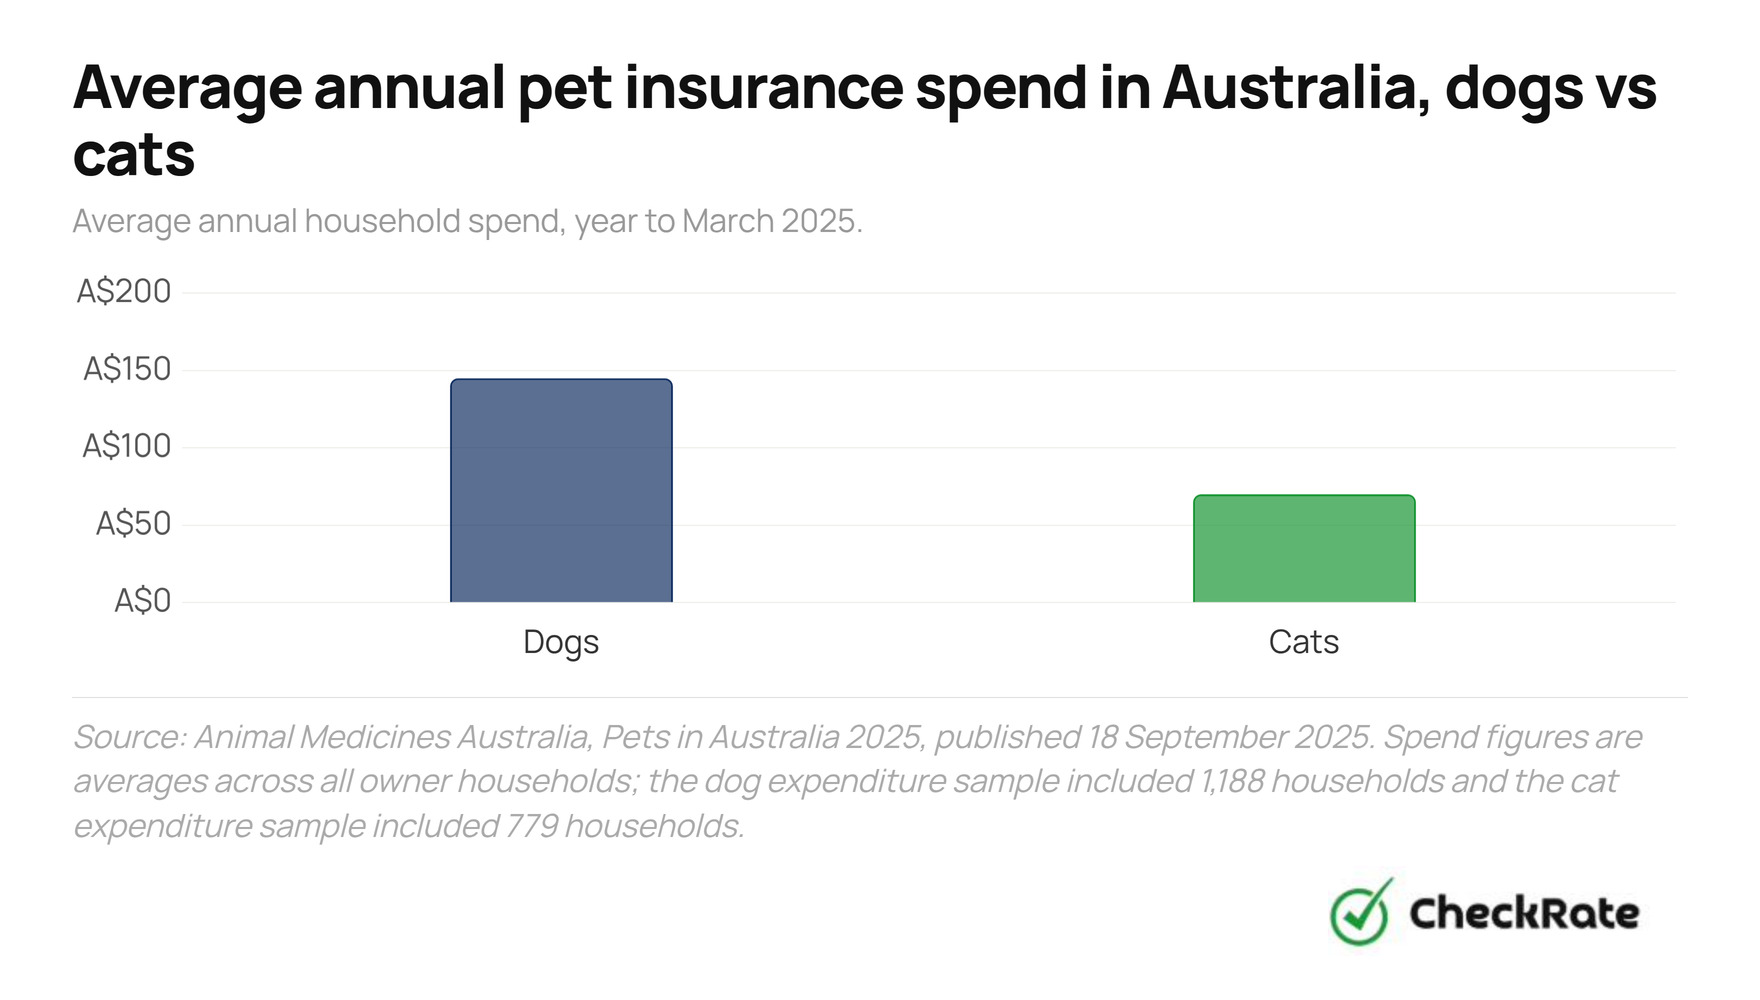
Average annual pet insurance spending was $145 per dog-owning household and $70 per cat-owning household in the year to March 2025. These are the most recent public national figures identified, from Animal Medicines Australia's Pets in Australia 2025, a national industry survey. Animal Medicines Australia is the peak body representing Australia's animal health industry.
This is the only public national estimate identified for this article. No public national dataset was found that breaks pet insurance premiums down by breed, age, city or cover level. Insurers price policies individually, and this detail is not captured in publicly available insurance-industry statistics.
These are household-spending averages, not policy premiums, and they include households that reported no insurance spending at all. An average covering insured households only would likely be higher, but the published data does not allow that difference to be measured directly.
Pet insurance accounted for about 5% of total pet spending
Australians spent an estimated $21.3 billion on their pets in the year to March 2025. Pet insurance accounted for about $1.0 billion of that total, equivalent to approximately 5%.
- Food: $9.8 billion
- Veterinary services: $1.9 billion
- Products and accessories: $1.4 billion
- Pet insurance: $1.0 billion
A dog-owning household reported average annual pet spending of approximately $2,520, while a cat-owning household reported approximately $1,656. Pet insurance represented one component of these totals, with most dog and cat owners reporting that they did not have insurance.
How does pet insurance spending compare for dogs and cats?
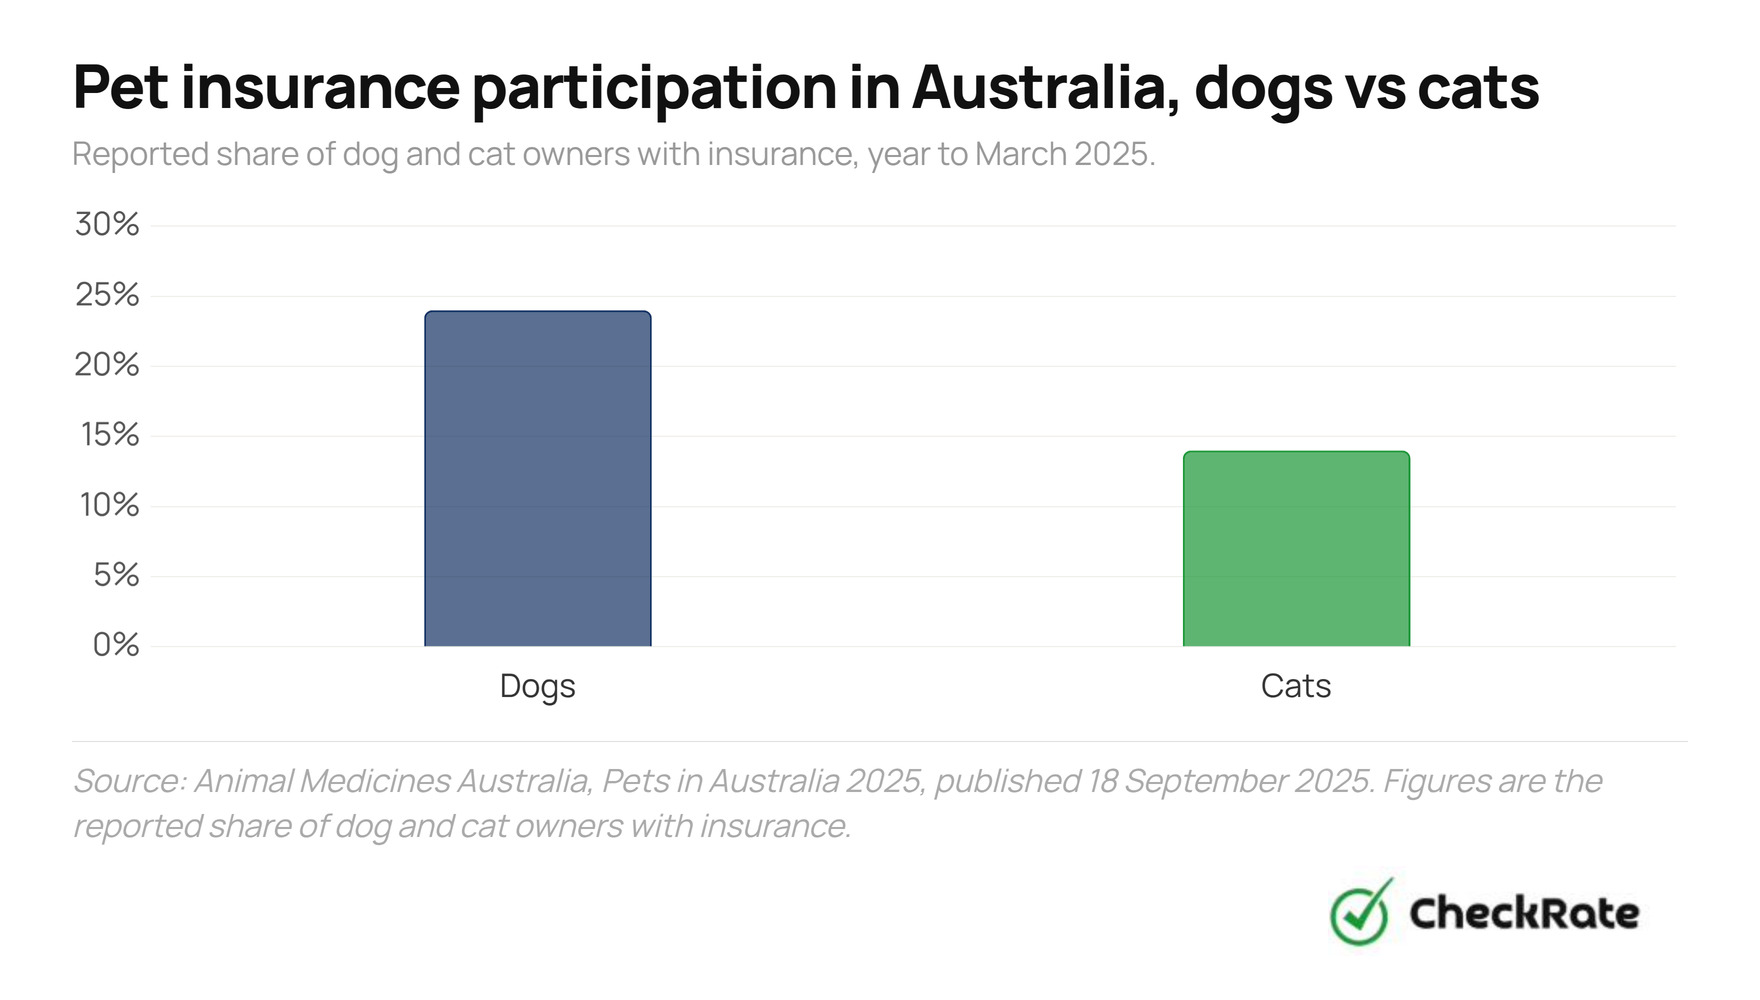
Dog-owning households reported roughly twice the average insurance spending of cat-owning households: $145 compared with $70. Part of that difference is likely explained by participation: 24% of dog owners reported holding insurance, compared with 14% of cat owners.
The survey does not publish the cross-tabulation needed to separate how much of the difference comes from participation and how much comes from spending among insured households. Because the household average blends both effects, the comparison below is a spending comparison, not a like-for-like premium comparison.

The national survey reports insurance spending only for dogs and cats. It does not publish insurance-spending figures for birds, fish, reptiles or small mammals, so it cannot support a national cost estimate for those pet types.
What types of pet insurance are available in Australia?
ASIC's Moneysmart groups stand-alone pet insurance into three broad categories: accident-only, accident and illness, and comprehensive cover. Some home and contents policies also offer pet cover as an optional extra. These are general consumer categories rather than a standardised classification used by every insurer.
The two pet insurance products reviewed for this article offered reimbursement rates of 70%, 80% or 90%, with annual benefit limits ranging from $10,000 to $30,000, depending on the cover selected. These figures are product examples, not national averages.
The table below sets out the Moneysmart categories alongside figures from the two Australian pet insurance products reviewed for this article. It is not a market survey, and no premiums are quoted.
| Cover type | General description | What this looks like in practice |
|---|---|---|
| Accident-only | Vet costs from specified accidental injuries only; excludes illness | Neither product reviewed offered stand-alone accident-only cover; both included illness cover as standard |
| Accident and illness | Accidental injury plus eligible illnesses, subject to limits and exclusions | Reimbursement rates of 70%, 80% or 90%; annual benefit limits between $10,000 and $30,000; excess options between $0 and $500, depending on the tier chosen |
| Comprehensive | Accidents, illness, preventative care and some routine veterinary checks, such as vaccinations and worming | Optional add-ons for dental care and specialised therapies, typically capped around $2,000 a year; some products also offer a separate, non-insurance benefit for routine items like vaccinations |
Source: ASIC Moneysmart, Pet insurance, updated 18 June 2026, and publicly available pet insurance product information reviewed 15 July 2026; see References.
How pet insurance costs vary by breed, age and cover level
Pet insurance premiums can vary according to the pet's species, breed and age, as well as the annual benefit limit, reimbursement rate, excess and optional benefits selected. Available sources identify these factors but do not quantify the average dollar effect of each one.
Factors that can influence a premium
Government guidance and the product examples reviewed for this article point to several relevant factors, from reimbursement rates as low as 70% and as high as 90%, to annual benefit limits as high as $30,000. The size of each effect varies between products and insurers:
- Species and breed: ASIC Moneysmart states that some breeds have health risks or characteristics that can make insurance more expensive or unavailable. Product terms and pricing may also differ between dogs and cats.
- Age: Insurers may charge different premiums according to a pet's age, and some policies restrict new cover or particular benefits beyond a specified age.
- Annual benefit limit: Some policies allow customers to choose from several annual benefit limits, which can affect the premium.
- Reimbursement percentage: the share of an eligible bill the insurer pays back. Some policies offer a choice of 70%, 80% or 90%. This article does not quantify the dollar effect of each option, since no standardised quotes were collected for comparison.
- Excess: some policies also let customers choose an annual excess, which can affect the premium too.
- Cover level and add-ons: some policies offer optional dental, specialised-therapy or routine-care benefits on top of base accident-and-illness cover. Depending on the product, routine-care benefits may be structured as a separate non-insurance benefit rather than part of the policy.
Several of these settings are selected by the policyholder rather than determined by the pet. Owners of pets with the same breed and age may therefore pay different premiums if they select different benefit limits, reimbursement rates, excesses or optional benefits. An average premium based only on breed or age would not account for these policy differences.
Why do Australian pet owners go without pet insurance?
Around half of uninsured dog and cat owners cited cost as a reason for going without cover, while around four in ten cited a lack of perceived value. These were the two most common reasons reported. Because respondents could choose more than one reason, this does not show what share cited at least one of the two.
The same survey reported that 24% of dog owners and 14% of cat owners had insurance. However, it does not establish how the reasons for remaining uninsured affected participation or household spending.
The survey also recorded other cost-related behaviours. About 14% of dog owners and 18% of cat owners reported at least one of the following healthcare-related actions to reduce spending:
- Making check-ups or vaccinations less frequent
- Reducing or stopping a pet's medication
- Giving a pet medication intended for humans
12% of pet owners reported needing financial assistance for veterinary care in the previous 12 months.
Why premiums differ between pets and policies
Lifetime pet insurance premiums can run into the thousands of dollars, government guidance notes. That guidance also points to waiting periods and pre-existing-condition exclusions as factors that affect when and whether treatment is covered.
For those who do insure, premiums differ for the reasons set out in Section 4: species, breed and age on the pet's side, and benefit limit, reimbursement percentage, excess and add-ons on the policy side.
How have veterinary prices and pet insurance participation changed?
The ABS price index for veterinary and other pet services, based on the weighted average of the eight capital cities, rose by approximately 62% between the March quarters of 2015 and 2026. On an annual-average basis, the index climbed from about 63 in 2015 to about 99 in 2025.
This tracks the cost of veterinary care, not the cost of pet insurance. No continuous official pet insurance premium series was identified for this article, so a trend line for the price of cover cannot be presented.
Veterinary price inflation is not pet insurance inflation
The ABS index measures changes in the price of veterinary and other pet services, not pet insurance premiums. The 62% increase therefore does not show that pet insurance premiums rose by the same amount. No continuous official pet insurance premium series was identified for this article.
Can pet insurance participation be compared over time?
The survey reports do not use a consistent pet insurance spending or premium measure from year to year. Depending on the survey year, published measures cover:
- All owners
- Insured owners only
- Household expenditure rather than a policy premium
The 2025 report recalculates overall 2022 pet expenditure using the same outlier-adjustment method used in 2025, but does not present a revised 2022 pet insurance category total. For that reason, the available figures cannot support a consistent trend in pet insurance premiums or category spending.
One measure appears broadly comparable across the two survey waves: reported insurance participation, subject to the source limitation below.
Reported insurance participation in 2022 and 2025
The reported share of dog owners with insurance was 17% in 2022 and 24% in 2025. For cat owners, the reported shares were 12% and 14%.
The 2025 estimate was seven percentage points higher for dogs and two percentage points higher for cats. The source does not report whether these differences are statistically significant, so the figures should be treated as comparisons between survey point estimates rather than evidence of a continuing trend.
Source limitation: The narrative in the 2022 report states that 12% of cat owners had insurance, while a table on the same page reports 21%. The underlying insured-cat sample was 72 respondents out of 649 cat owners, equivalent to approximately 11%. This article therefore uses the narrative figure of 12% and treats the 21% table entry as an apparent source error. The comparison with 2025 was calculated from the reported point estimates and is not presented as a time series by Animal Medicines Australia.
References
- 1Animal Medicines Australia, Pets in Australia: A national survey of pets and people 2025; September 2025.
- 2Animal Medicines Australia, Pets in Australia: A national survey of pets and people 2022; November 2022.
- 3ASIC Moneysmart, Pet insurance; updated June 2026.
- 4Australian Bureau of Statistics, Consumer Price Index, Australia, Table 18; March 2026.
- 5HCF, HCF Happy Tails Cover pet insurance; product information effective July 2026, and Bow Wow Meow Pet Insurance, Nose-to-Tail Cover; accessed July 2026 – used for illustrative cover-level examples. Not a representative market sample.
The Animal Medicines Australia spending figures are survey estimates for the year to March 2025. Annual-average values for the ABS veterinary and other pet services price index were calculated as the arithmetic mean of the four quarterly index values for each calendar year. The approximately 62% increase was calculated from the change in the index from 62.67 in the March quarter of 2015 to 101.56 in the March quarter of 2026. No standardised live premium quotes were collected for this article.
Data Snapshots