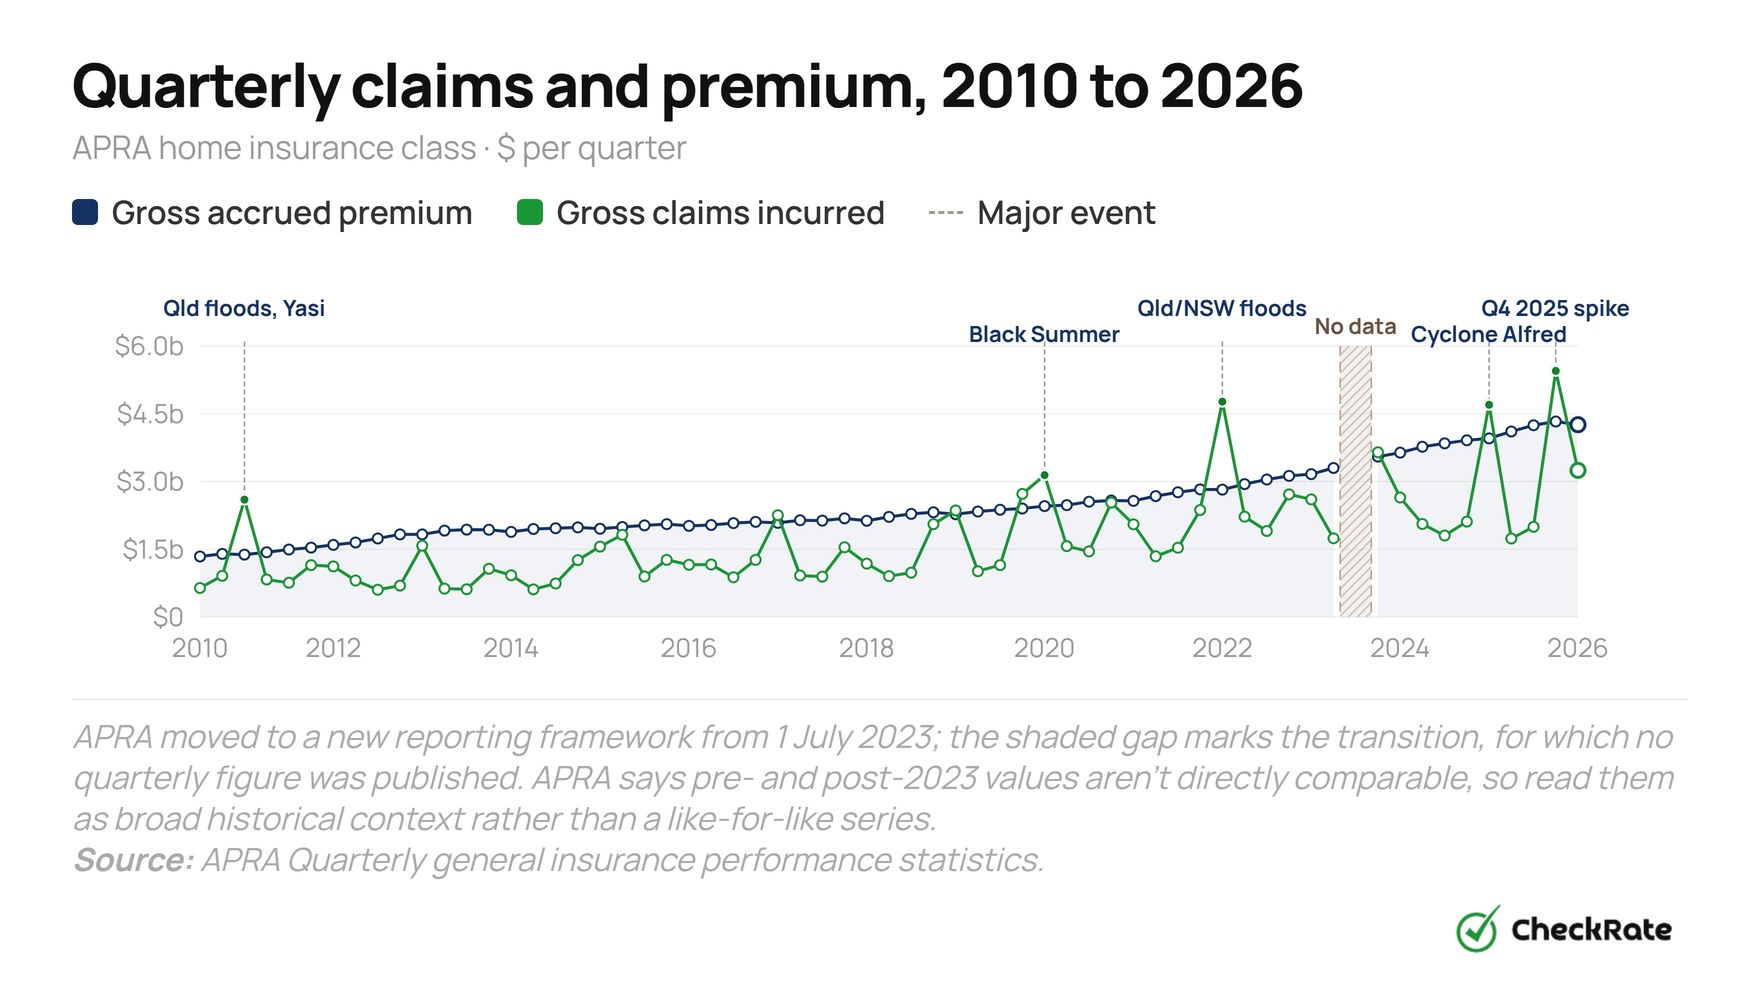
Claims outpaced premiums in the December quarter
The December 2025 quarter was the heaviest period for home insurance claims. Insurers incurred $5.45 billion in gross claims against $4.33 billion in gross accrued premium, meaning claims cost more than the premium collected during the quarter.
Reinsurance absorbed much of the impact. This is the cover insurers buy to protect themselves against large claim events. Australian insurers recovered $1.62 billion through reinsurance in the quarter, the second-largest quarterly recovery in the current APRA series, behind the $2.30 billion recovered in the March 2025 quarter, which coincided with ex-Tropical Cyclone Alfred.
Even after those recoveries, net claims still reached $3.60 billion. The pressure was not spread evenly across the country, with two regions accounting for most of the quarter’s claims.
The most recent quarter available, March 2026, points to a return to more typical conditions. Insurers incurred $3.25 billion in gross claims against $4.26 billion in gross accrued premium, a loss ratio of 76.3%, down from 125.9% in the December quarter.
Home insurance claims by state, December 2025
Claims were concentrated in Queensland and the Northern Territory in Q4 2025:
- Queensland: $3.47 billion in claims against $978 million in revenue (355%)
- Northern Territory: $101 million in claims against $29 million in revenue (348%)
- Western Australia: claims at 28% of revenue
- ACT: claims at 19% of revenue
Industry totals, 2024 vs 2025
| Metric | 2024 | 2025 | Change |
|---|---|---|---|
| Gross written premium | $15.85bn | $17.05bn | +7.5% |
| Gross accrued premium | $15.16bn | $16.64bn | +9.7% |
| Net accrued premium | $10.72bn | $11.80bn | +10.0% |
| Gross claims incurred | $8.62bn | $13.88bn | +61.0% |
| Reinsurance recoveries | $1.71bn | $4.30bn | +152.0% |
| Net claims incurred | $6.56bn | $8.94bn | +36.2% |
Source: APRA Quarterly general insurance performance statistics.
Two quarters accounted for most of the rise in home insurance claims. In the March 2025 quarter, ex-Tropical Cyclone Alfred crossed the south-east Queensland coast and caused widespread flooding, wind damage and coastal erosion across Queensland and northern NSW, contributing to claims for the quarter reaching $4.70 billion.
The December 2025 quarter was even higher in dollar terms, with claims reaching $5.45 billion. Queensland accounted for $3.47 billion of that total. APRA’s data does not identify the specific events behind individual quarters, but the state split points to claims being concentrated in Queensland and the Northern Territory.
Higher claims in 2025 may place upward pressure on premiums, but insurers do not price policies based on one year alone. They also consider reinsurance costs, capital requirements, long-term weather data and competition from other insurers. Net claims remained below net accrued premium for the year ($8.94 billion versus $11.80 billion), although underwriting profitability should be assessed using APRA’s broader insurance service result measures, not this comparison alone.
The first 2026 data is now available. In the March 2026 quarter, gross written premium reached $4.25 billion, up 6.1% on the March 2025 quarter, and gross accrued premium rose 7.7% over the same period. At the same time, claims eased sharply from the December 2025 peak, with the loss ratio falling to 76.3% from 125.9%. Together, this suggests premiums kept rising into 2026 even as the acute pressure from 2025’s claims began to ease, which is consistent with insurers pricing off a longer run of claims experience rather than reacting to a single quarter.
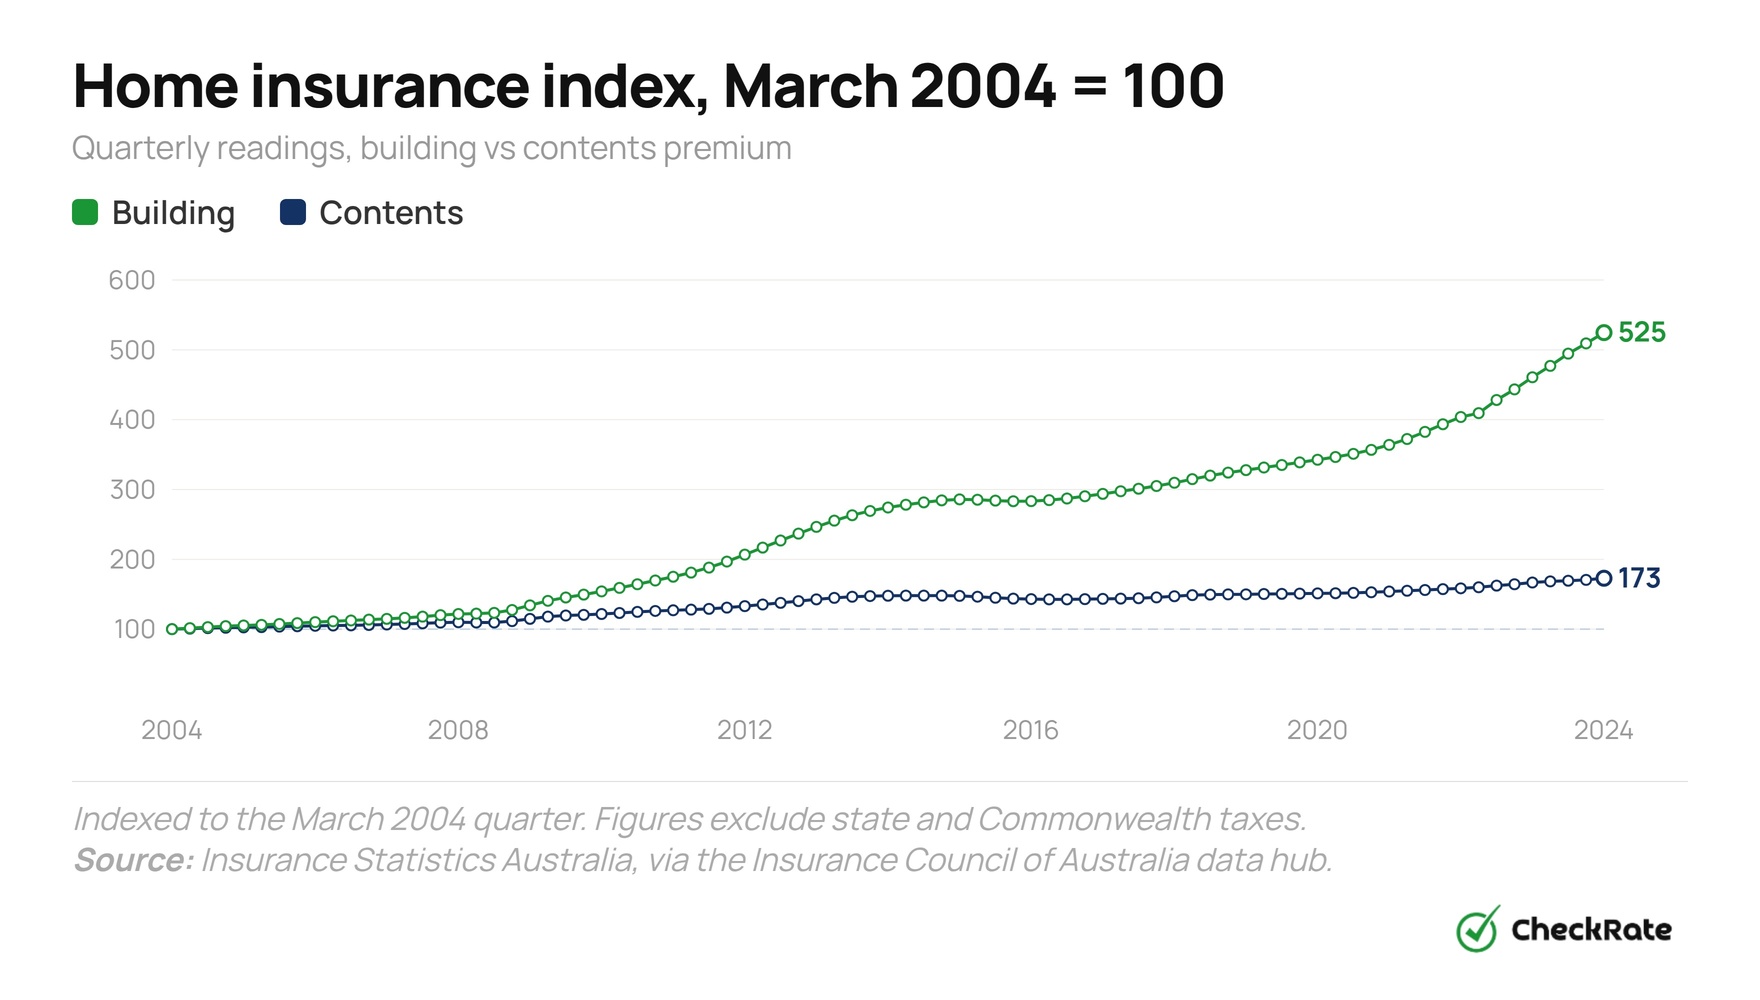
Home insurance has risen faster than contents cover
Insurance Statistics Australia publishes a quarterly domestic buildings and contents insurance index for participating members, via the Insurance Council of Australia’s data hub. Using March 2004 as the baseline, with the index set at 100, this is how prices had changed by March 2024:
- Home building cover: 100 to 524.6, more than 5 times higher
- Home contents cover: 100 to 172.9, about 1.7 times higher
For reference, ABS CPI rose by a broadly similar order of magnitude over the period. This means contents premiums roughly tracked inflation, while building insurance premiums rose much faster.
Why building cover increased faster
The cost of repairing and rebuilding homes has increased much faster than the cost of replacing household contents. Between 2004 and 2024, the average building claim cost rose from 95.6 to 1,079.8 on the index, making it more than 11 times higher.
This helps explain why building insurance premiums have moved well ahead of contents premiums. Building claims are tied to labour, materials, compliance, demolition, access and rebuilding costs, which can rise sharply even when general consumer prices move more slowly.
On the Insurance Statistics Australia index, where March 2004 = 100, building cover reached 524.6 by March 2024. That means building premiums were about 5.2 times higher than they were in 2004.
Contents cover rose more slowly, reaching 172.9 by March 2024, or about 1.7 times higher. CPI rose by roughly the same amount over the period, which means contents premiums broadly tracked inflation, while building premiums rose much faster.
Building premiums rise faster because the cost of repairing and rebuilding homes has increased much more sharply than the cost of replacing contents. Between March 2004 and March 2024, average building claim costs rose more than 11 times on the index, compared with 3.2 times for contents.
Rebuilding work also depends on specialist trades, materials, demolition, access and compliance costs. In higher-risk areas, stricter building standards for bushfire and cyclone exposure can add further cost. Contents are usually simpler and cheaper to replace.
Why do home and contents insurance premiums cost more in some areas?
Combined home and contents insurance premiums vary by location because insurers assess risk at a local level. The Australian Competition and Consumer Commission maps combined home and contents premiums across 330 SA3 areas in Australia as part of its cyclone reinsurance pool monitoring.
Its 2026 insurance monitoring report, covering 2025 premiums, groups the mapped SA3s into bands from $1,250 upward: $1,250 to under $2,500, $2,500 to under $3,750, $3,750 to under $5,000, $5,000 to under $6,250, and $6,250 or above.
Where are combined home and contents premiums highest?
Only one SA3 nationally reaches the top band of $6,250 or more: West Pilbara in Western Australia. The next band down, $5,000 to under $6,250, includes other remote WA regions exposed to cyclones — Kimberley, East Pilbara and Gascoyne — along with Darwin City and East Arnhem in the Northern Territory.
That same band also includes four of the country’s priciest metropolitan and coastal pockets: Dural-Wisemans Ferry and Eastern Suburbs-North in Sydney, Stonnington-West in inner Melbourne, and Surfers Paradise on the Gold Coast, which are not part of the north WA and NT cluster that the ACCC highlights among the highest-premium cyclone-exposed regions. Higher sums insured may be one factor behind the Sydney and Melbourne pockets’ premiums, but the ACCC data does not attribute a cause to individual SA3 premiums. Either way, a high band shouldn’t be read as a pure risk ranking.
Most of North Queensland sits one band lower, at $2,500 to under $3,750, including Cairns, Innisfail, Port Douglas and Mackay. Townsville and the Whitsundays reach the $3,750 to under $5,000 band. In New South Wales, the Blue Mountains and Richmond-Windsor sit at $2,500 to under $3,750, while Hawkesbury reaches $3,750 to under $5,000.
Where are combined home and contents premiums lowest?
The lowest premium band is $1,250 to under $2,500. These areas are mainly clustered in outer metropolitan suburbs and some regional areas, including:
- Outer Adelaide: Playford, Salisbury, Tea Tree Gully
- Outer Melbourne: Dandenong, Casey-South, Wyndham, Brimbank, Melton
- Outer Perth: Wanneroo, Kwinana, Canning, Gosnells
- Rural areas: parts of SA, WA, Victoria and Tasmania
Home insurance is more expensive in northern Australia because insurers price cover around the likelihood and cost of future claims. The tropical north is exposed to cyclones, monsoons and severe storms, which can lead to costly property damage. Major events such as Cyclone Yasi in 2011, Cyclone Debbie in 2017 and ex-Tropical Cyclone Alfred in 2025 show how large these claim events can become.
This shows up in the ACCC’s regional data, but not as a uniform “north equals most expensive” pattern. In its 2026 report, the Northern Territory’s SA3s mostly sit at $2,500 to under $3,750, with Darwin City and East Arnhem the priciest at $5,000 to under $6,250 — no NT area reaches the very top band. The single most expensive SA3 nationally is instead West Pilbara in Western Australia, at $6,250 or above, alongside other remote, cyclone-exposed WA regions.
The cheapest home insurance areas are mostly in outer metropolitan suburbs and some regional areas. SA3 areas in the $1,250 to under $2,500 band include outer Adelaide suburbs such as Playford, Salisbury and Tea Tree Gully; outer Melbourne areas such as Dandenong, Casey-South, Wyndham, Melton and Brimbank; and outer Perth areas such as Wanneroo, Kwinana and Canning.
Several rural parts of South Australia, Western Australia and Tasmania also fall into the lowest band. This likely reflects a mix of factors, including sums insured, local claims experience, insurer pricing and local hazard profiles. Tasmania has the highest share of any state in this band, at 87% of its mapped SA3s.
Home insurance costs by state and territory
Home insurance costs can look different depending on the dataset used. APRA claims data shows the pressure on insurers, while ACCC regional premium bands show how combined home and contents premiums vary within each state.
The state comparison below brings together two datasets for each state or territory:
- APRA (Q1 2026): industry claims versus revenue
- ACCC (2025): typical combined home and contents premium band at SA3 level
They use different methods and reference dates, so they are best read together.
The ACCC’s SA3 analysis is the most detailed public data available for local combined home and contents premium comparisons. It maps 330 regions across Australia into five premium bands and is published with the ACCC’s insurance monitoring reports. Insurers price policies at the property-address level, so building age, construction type, location risk and sum insured can affect premiums within the same SA3. The ACCC’s bands are useful for comparison, but they should be treated as regional benchmarks rather than quotes.
How many Australians are underinsured?
In 2025, The Australia Institute surveyed 2,009 Australians about their home insurance. Among people who owned their home outright or had a mortgage, the survey found clear gaps in both building and contents cover.
Among homeowners surveyed:
- Home building: 78% fully insured, 15% underinsured, 4% uninsured
- Home contents: 68% fully insured, 19% underinsured, 10% uninsured
That means 19% of homeowners had insufficient building cover, while 29% had a gap in contents cover.
Why the gap matters
Underinsurance often builds up over time without the homeowner noticing. A sum insured that was accurate five years ago may no longer cover the full cost of rebuilding today.
This matters because a claim payout is usually limited by the insured amount, not the actual cost of repairing or replacing the home. If the cover has not kept pace with current costs, the homeowner may have to pay the shortfall themselves.
Source: The Australia Institute, 2025 survey of 2,009 Australians who own outright or have a mortgage. Don’t-know responses not shown.
The Australia Institute’s 2025 survey found that 15% of homeowners described their home building cover as underinsured, while 4% were uninsured. Together, that puts 19% of homeowners in the gap for building cover. Contents cover was less complete. 19% of homeowners said they were underinsured for contents, while 10% were uninsured. That means 29% were in the gap for contents cover.
The true level of underinsurance may be higher because the survey relies on self-reporting. Many homeowners may not know whether their sum insured still matches the current cost to rebuild.
Uninsured means there is no policy in place. If the home is damaged, the owner has to pay the full cost themselves.
Underinsured means there is a policy, but the sum insured is too low to cover the full cost of rebuilding or replacement. Some policies may also reduce partial claim payouts if the sum insured is too low.
Both leave the owner exposed, but underinsurance is usually less obvious because it can build up quietly over time.
References
- APRA: Quarterly general insurance performance statistics, March 2026, released 29 May 2026.
- ACCC: Insurance monitoring report 2026, SA3-level combined home and contents premium bands using 2025 data.
- ACCC: Insurance monitoring report 2026 supplementary data, Figure 6.1 SA3 premium-band spreadsheet.
- The Australia Institute: Polling, Home & contents insurance, March 2025 survey of 2,009 Australians.
- Insurance Council of Australia: Data hub, Insurance Statistics Australia domestic buildings and contents index, CheckRate analysis of ISA member extract.
- Insurance Statistics Australia: Domestic Syndicate, quarterly domestic buildings and contents insurance data for syndicate members.
- ABS: Statistical Area Level 3, SA3 geography definitions.
- Bureau of Meteorology: Severe Tropical Cyclone Alfred, 2025 event summary.
- Bureau of Meteorology: Tropical cyclone databases, historical cyclone records.
Data Snapshots