Key figures
$106,657
Average full-time salary per year (base pay only), Nov 2025
$74,672
Median salary per year for all employees, $9,100 below the mean
11.5%
Full-time gender pay gap: women earn $247/week less than men in base pay
−1.3%
Real wage change in 2026: wages grew 3.3% but inflation ran at 4.6%, so purchasing power fell
Section 01Full-time salary
What is the average full-time salary in Australia in 2026?
The average full-time adult worker in Australia earned $2,051.10 per week in base pay, known as ordinary time earnings, as at November 2025. That is equal to $106,657 per year. This is the most widely used benchmark for full-time earnings in Australia.
Base pay only covers standard contracted hours. It excludes overtime, penalty rates, bonuses and allowances. When those extra payments are included, the average rises to $2,129.00 per week, or $110,708 per year.
The gap between the two figures is relatively small, at about $78 per week. This suggests most full-time workers are not heavily reliant on overtime or bonus pay.
Base pay — full-time adults
$2,051
Per week · Nov 2025 · $106,657/yr
Total earnings (incl. overtime & extras)
$2,129
Per week · Nov 2025 · $110,708/yr
Year-on-year growth
+3.8%
Nov 2024 to Nov 2025
There are some important limits to this figure. It is an average, not a median, so higher earners can pull the number up. It also only covers full-time workers, which means it leaves out many Australians working part-time or casual jobs.
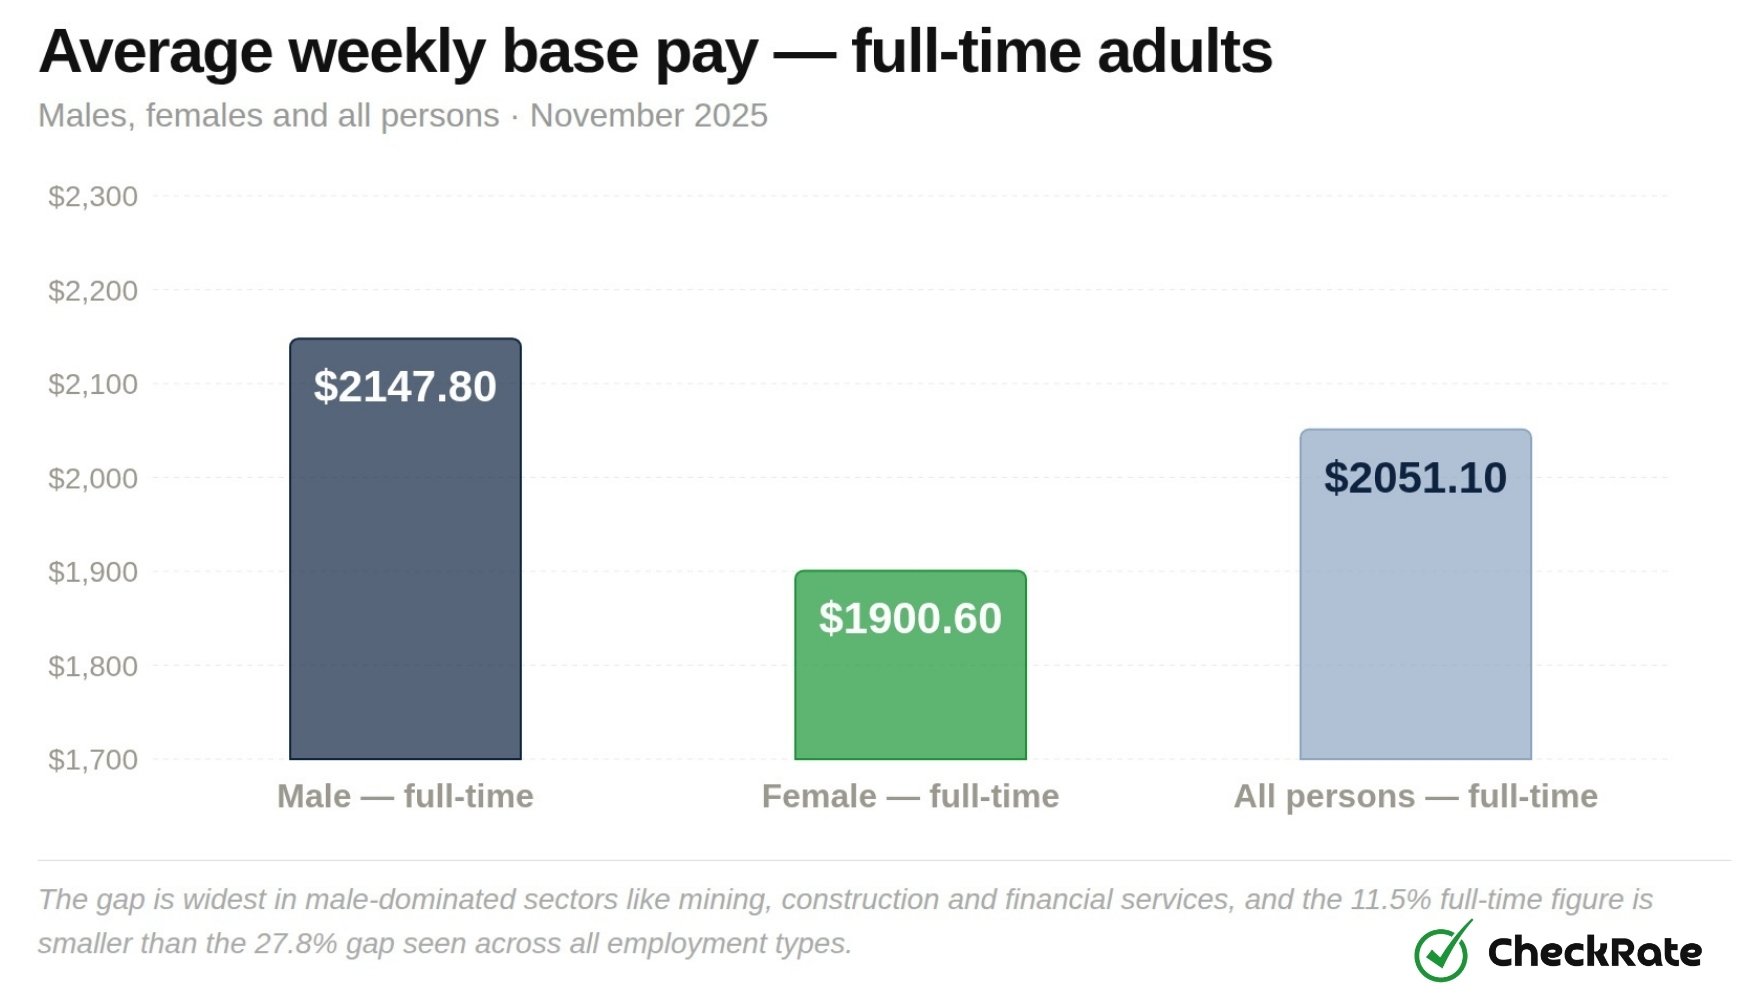
Gender pay gap in full-time earnings
Male full-time workers averaged $2,147.80 per week in base pay, while female full-time workers averaged $1,900.60, a gap of $247.20 per week or $12,854 per year, representing an 11.5% difference.
Average weekly base pay — full-time adults
Males, females and all persons, November 2025
The gap is widest in male-dominated sectors like mining, construction and financial services, and the 11.5% full-time figure is smaller than the 27.8% gap seen across all employment types.
Source: ABS Average Weekly Earnings, Australia (Cat. No. 6302.0), Table 3, November 2025.
The full-time gender pay gap partly reflects differences in job type and industry rather than unequal pay for the same work. Men are more heavily represented in mining, construction and financial services, all sectors with higher average earnings, while women make up a larger share of employment in health, education and social assistance.
Differences in occupational mix and workforce composition contribute to the gap in average earnings between men and women.
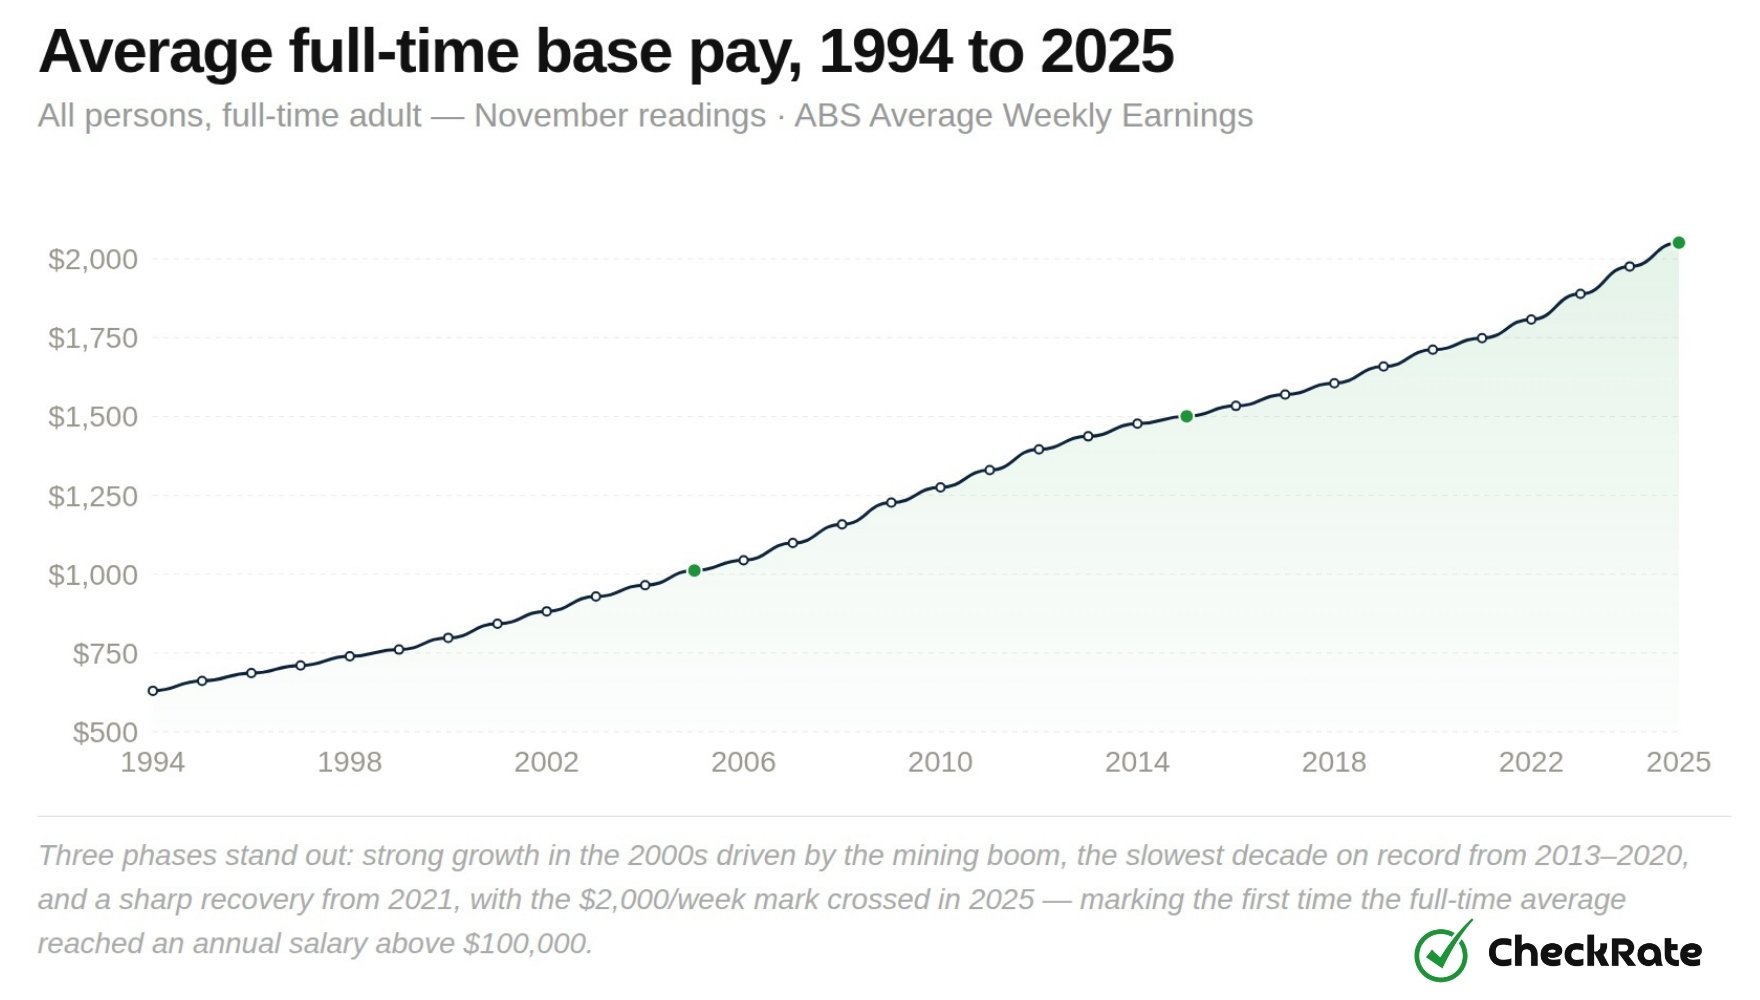
Historical trend in average full-time salary in Australia
The average full-time salary has more than tripled in dollar terms since 1994.
Full-time adult workers earned $630 per week, or $32,765 per year, in November 1994. By November 2025, that figure had reached $2,051 per week or $106,657 a year, a 225% increase over 31 years, at an average rate of around 3.8% per year.
1994 — series baseline
$630
Per week · $32,765/yr
2005 — crossed $1,000/wk
$1,012
Per week · $52,614/yr
2015 — crossed $1,500/wk
$1,501
Per week · $78,026/yr
2025 — current
$2,051
Per week · $106,657/yr
Average full-time base pay, 1994 to 2025
All persons, full-time adult — November readings, ABS Average Weekly Earnings
Three phases stand out: strong growth in the 2000s driven by the mining boom, the slowest decade on record from 2013–2020, and a sharp recovery from 2021, with the $2,000/week mark crossed in 2025, marking the first time the full-time average reached an annual salary above $100,000.
Source: ABS Average Weekly Earnings, Australia (Cat. No. 6302.0), Table 3, November readings 1994–2025.
The long-term rise in earnings was not steady. Growth was stronger in the first two decades, before slowing after 2014:
- 1994 to 2004: earnings grew by 53%
- 2004 to 2014: earnings rose by another 53%, partly driven by the mining investment boom
- 2014 to 2024: growth slowed to 34%, reflecting weaker wage growth from about 2013 to 2020, when pay rises were below historical averages and, in some years, below inflation
Is $100,000 a good salary in Australia?+
A salary of $100,000 is slightly below the full-time mean of $106,657, but above the all-employee median of $74,672. This means a worker earning $100,000 is earning more than most Australian workers, once part-time and casual employees are included.
What is a good salary in Australia in 2026?+
In May 2025, the top 25% of all-employee earnings started at $2,122 per week, or $110,344 per year. For full-time workers, the threshold was higher at $2,560 per week, or $133,120 per year. These figures change over time as average wages grow. They are best used as relative benchmarks, rather than fixed salary targets.
What is the average salary in Australia after tax in 2026?+
Tax in Australia is calculated progressively by the ATO. The average full-time salary of $106,657 falls within the 30 cents-in-the-dollar tax bracket, which applies to income from $45,001 to $135,000 in 2025–26. After the low-income tax offset and Medicare levy, the effective tax rate is approximately 25–27%. This leaves an estimated take-home pay of around $78,000 to $80,000 per year. For the median salary of $74,672, estimated take-home pay is around $58,000 to $60,000 per year. These figures are approximate, and individual outcomes will vary.
How has the average full-time salary in Australia changed over time?+
Full-time base pay earnings have grown by an average of around 3.8% per year since 1994. The fastest growth period was roughly 2003 to 2012, during the mining boom. Growth then slowed to about 1.5–2.5% per year from 2013 to 2020, before picking up again from 2021. The full-time average crossed $1,000 per week in 2005, $1,500 per week in 2015 and $2,000 per week in 2025.
Section 02Mean vs median
Short answer
For most pay comparisons, the median is the more useful figure. The mean salary, $106,657 per year for full-time adults, is pulled up by high earners and can overstate what the typical worker takes home. The median salary for all employees is $74,672 per year. Because the median shows the midpoint of the earnings distribution, it is less affected by very high incomes and gives a clearer indication of typical worker pay.
The mean and median tell different stories. The mean for all employees is $1,611 per week, while the median is $1,436 per week. That leaves a gap of $175, mainly because higher earners pull the average upward.
The median shows the midpoint of the workforce. Half of the workers earn more, and half earn less. This makes it less affected by very high incomes than the mean.
Why does the mean overstate most workers' pay?
The mean can be pushed upward by a small number of high earners. For example, if nine workers earn between $800 and $1,600 per week, and one earns $6,000, the average will sit well above what most people in the group earn. Australian earnings data follows a similar pattern. The mean sits above the median, which means a worker earning exactly the mean is already earning more than most workers. This is why the median is often the better benchmark for comparing pay, living costs and borrowing capacity.
For most Australians comparing their pay to national figures, the median is the more useful reference point.
Mean (average) weekly earnings — all employees
$1,611
May 2025 survey · $83,772/yr
Median weekly earnings — all employees
$1,436
May 2025 survey · $74,672/yr
Weekly earnings distribution — full-time, part-time and all employees
First quartile, median and third quartile, May 2025
First quartile (bottom 25%)
Median
Third quartile (top 25%)
Full-time workers span a $1,136 weekly range — from below $1,424 in the bottom quarter to above $2,560 at the top — while part-time workers show a narrower spread driven by fewer hours worked rather than lower hourly rates.
Source: ABS Employee Earnings and Hours, Australia (Cat. No. 6306.0), Table 1, May 2025.
Qualifications and age both affect where workers sit in the earnings range. Employees with postgraduate qualifications earn a median of around $2,000 per week, while those without post-school qualifications are closer to $1,000 per week.
Earnings also follow a clear arc across a working life, typically peaking in the 45–54 age group before tapering toward retirement. The average age of full-time employees is 41.3 years, compared with 37.8 years for part-time workers.
What salary puts a worker in the top 25% of earners in Australia?+
In May 2025, a worker needed to earn at least $2,122 per week, or around $110,344 per year, to be in the top 25% of all employees. For full-time workers, the threshold was higher at $2,560 per week, or $133,120 per year. This reflects the higher hours usually worked in full-time roles.
Why is the median salary lower than the average salary?+
The average, or mean, is calculated by adding up all earnings and dividing the total by the number of workers. A small number of very high earners can pull this figure upward. The median is the middle point in the earnings range. Half of the workers earn more, and half earn less. This means it is less affected by very high or very low earners. In May 2025, the mean for all employees was $1,611 per week, while the median was $1,436 per week. That left a gap of $175 per week.
How do qualifications affect average salary in Australia?+
Higher qualifications make a substantial difference to earnings. Workers with postgraduate qualifications earn a median of around $2,000 per week. By comparison, workers without post-school qualifications earn around $1,000 per week. That means postgraduate-qualified workers earn roughly double the median earnings of workers without post-school qualifications.
Section 03Weekly earnings: full-time vs part-time
Average weekly earnings: full-time vs part-time workers
The average weekly earnings figure for all employees is $1,562.40 per week. This covers 13.16 million workers with very different working patterns, including 7.73 million full-time workers and 5.44 million part-time workers.
Because the all-employee figure includes people working shorter hours, it sits well below the full-time average of $2,051 per week.
The difference is mainly about hours worked, not hourly pay rates.
Average weekly earnings by employment category
ABS Average Weekly Earnings, November 2025
| Category |
Base pay ($/wk) |
Total earnings ($/wk) |
Yearly total |
| Males — full-time adult |
$2,147.80 |
$2,257.30 |
$117,380 |
| Females — full-time adult |
$1,900.60 |
$1,929.40 |
$100,329 |
| All persons — full-time adult |
$2,051.10 |
$2,129.00 |
$110,708 |
| Males — all employees |
— |
$1,820.50 |
$94,666 |
| Females — all employees |
— |
$1,314.30 |
$68,344 |
| All persons — all employees |
— |
$1,562.40 |
$81,245 |
| Base pay (ordinary time) figures are not published for all employees due to the wide range of hours worked by part-time and casual staff. Yearly total = weekly earnings × 52. |
Source: ABS Average Weekly Earnings, Australia (Cat. No. 6302.0), Table 3, November 2025.
When all employment types are included, the gender earnings gap is larger than it first appears.
Male employees averaged $1,820.50 per week across all employment types, while female employees averaged $1,314.30, a difference of $506.20 per week or $26,322 per year.
The wider gap reflects higher rates of part-time employment among women, alongside the occupational and industry factors discussed above.
How pay agreements affect average earnings
How a worker's pay is set can make a large difference to what they earn. Full-time workers covered by an enterprise agreement averaged $2,268 per week in May 2025.
That was 52% higher than the $1,495 per week earned by workers paid at the minimum award rate.
This makes the pay-setting method one of the clearest wage divides in the earnings data.
Average weekly earnings by method of pay-setting — full-time persons
Average weekly total cash earnings, May 2025
Workers on formal workplace agreements earn $773/week more than those on award-only pay, with the 911,600 workers on the award rate representing the minimum level of pay in the system.
Source: ABS Employee Earnings and Hours, Australia (Cat. No. 6306.0), Table 1, May 2025.
What is the average weekly wage in Australia?+
The average weekly pay across all employees in Australia was $1,562.40 per week as at November 2025. That equals around $81,245 per year. For full-time adult workers, the average weekly base pay was higher at $2,051.10 per week, or $106,657 per year. The all-employee figure is lower because it includes part-time and casual workers, who usually work fewer hours each week.
How large is the gender pay gap in Australia?+
For full-time adult workers, male employees averaged $2,147.80 per week in base pay as at November 2025. Female employees averaged $1,900.60 per week. That leaves a gap of $247.20 per week, or 11.5%. Across all employment types, the gap is wider. Males averaged $1,820.50 per week, compared with $1,314.30 per week for females. That is a difference of $506.20 per week, or $26,322 per year.
Does an enterprise agreement affect how much a worker earns?+
Yes. Full-time workers covered by a formal workplace agreement averaged $2,268 per week in May 2025. That compares with $1,495 per week for workers on award-only pay. The gap was $773 per week, or 52%. Workers on individual contracts also earned well above the award rate, at $2,192 per week.
Section 04Industry earnings: highest average weekly pay
Which industries have the highest average weekly pay?
Average weekly earnings vary widely across Australia's 18 industries. Mining workers had the highest average, at $3,186 per week as at November 2025.
Accommodation and food services had the lowest average, at $743 per week. That was less than a quarter of the mining figure.
Highest paying industry
Mining
$3,186
average per week · Nov 2025
Lowest paying industry
Accommodation & food services
$743
average per week · Nov 2025
Average weekly earnings by industry — all persons
Total earnings, sorted highest to lowest, November 2025
Above national average ($1,562)
Below national average
Mining's high average reflects overtime-heavy, full-time roles, while the accommodation and food services sector sits at the bottom largely because most workers are part-time or casual - these are weekly figures, so they reflect hours worked as much as hourly rates.
Source: ABS Average Weekly Earnings, Australia (Cat. No. 6302.0), Table 10I, November 2025. National all-industries average: $1,562.40/week.
Several industries sat above the national all-employee average of $1,562 per week, while many large service industries remained below it.
Industries above the national average ($1,562/week):
- Electricity, gas, water and waste services: $2,628
- Information media and telecommunications: $2,329
- Financial and insurance services: $2,089
- Professional, scientific and technical services: $2,053
- Public administration and safety: $1,945
- Construction: $1,729
- Transport, postal and warehousing: $1,682
Industries below the national average:
- Health care and social assistance: $1,420
- Administrative and support services: $1,345
- Retail trade: $956
- Arts and recreation: $953
- Accommodation and food services: $743
Which industry pays the highest average salary in Australia?+
Mining is the highest-paying industry in Australia by average weekly earnings. Mining workers averaged $3,186 per week ($165,672/yr) as of November 2025, more than double the national average of $1,562 per week. This reflects a workforce concentrated in full-time, well-paid roles with substantial overtime, remote-area allowances and higher pay for specialised trades and engineering skills.
Which industry pays the lowest average salary in Australia?+
Accommodation and food services recorded the lowest average weekly earnings in November 2025, at $743 per week, or $38,636 per year. That was less than a quarter of the mining average. The low figure reflects the high share of part-time and casual workers in lower-paid food service roles.
Which industries pay above the national average in Australia?+
Industries above $1,562/week include: mining ($3,186), electricity, gas, water and waste services ($2,628), information media and telecommunications ($2,329), financial and insurance services ($2,089), professional, scientific and technical services ($2,053), public administration and safety ($1,945), construction ($1,729), and transport, postal and warehousing ($1,682).
Section 05Wage trends 2020–2025
How average wages have changed from 2020 to 2025
Average weekly pay across all employees rose from $1,280 per week in November 2020 to $1,562 per week in November 2025. That was an increase of 22% in dollar terms over five years.
Growth picked up from around 2022, during a period of tighter labour market conditions and skills shortages across many sectors.
Average weekly earnings — all employees, 2020 to 2025
Total earnings, all persons — biannual ABS survey results
The 2020 reading is slightly elevated by a pandemic effect, as lower-paid sectors shed workers and pushed the average up. The 22% rise over five years is in dollar terms only; in real terms after inflation, the gain is considerably smaller.
Source: ABS Average Weekly Earnings, Australia (Cat. No. 6302.0), Table 3, May 2020 to November 2025.
Nov 2020 — all employees
$1,280
Average weekly total earnings
Nov 2025 — all employees
$1,562
Average weekly total earnings
5-year growth (dollar terms)
+22%
In dollar terms, Nov 2020 to Nov 2025
Year-on-year (2025)
+3.4%
Nov 2024 to Nov 2025
The fastest single-year increase was between November 2023 and November 2024, when average weekly pay rose by 5.5%. Growth then slowed to 3.4% in the year to November 2025 as labour market pressures eased.
These figures are in dollar terms and have not been adjusted for inflation.
How much have wages grown in Australia since 2020?+
Average weekly pay for all employees rose from $1,280 per week in November 2020 to $1,562 per week in November 2025. That was an increase of 22% over five years in dollar terms. However, inflation also rose substantially over this period. This means the real value of those pay rises was smaller, and in some years, workers went backwards in purchasing-power terms.
When did wage growth accelerate in Australia?+
Wage growth was low from roughly 2013 to 2021, running at around 1.5–2.5% per year. Growth began picking up from late 2021 as job vacancies increased. The strongest single-year increase was from November 2023 to November 2024, when average weekly pay grew by 5.5%. Growth slowed to 3.4% in the year to November 2025.
Have Australian wages kept up with inflation since 2020?+
Not fully. Wages grew 22% in dollar terms from 2020 to 2025, but inflation also rose sharply. Inflation peaked at 7.0% in 2023, producing two consecutive years of real wage losses. The combined real wage loss from 2022 to 2023 was around 6%. There was a partial recovery in 2024 and 2025. However, in the March quarter of 2026, annual inflation was 4.6%, compared with annual wage growth of 3.3%, meaning real wages were falling again at that point.
Section 06Employment type earnings
Full-time vs part-time vs casual earnings in Australia
Short answer
Full-time workers earned a median of $1,887 per week in May 2025, compared with $769 per week for part-time workers. The gap mainly reflects hours worked. Casual workers usually receive a 25% loading, but variable hours mean this does not always lead to higher annual income.
Employment type is one of the biggest factors shaping weekly pay. Full-time workers earned a median of $1,887 per week in May 2025, compared with $769 per week for part-time workers.
That $1,118 gap mainly reflects hours worked, rather than hourly rates. Even so, the difference has a major effect on annual income, leave entitlements and financial stability.
Median weekly earnings by employment type and gender
First quartile, median and third quartile, May 2025
| Employment type |
First quartile |
Median |
Third quartile |
| Full-time — males |
$1,472 |
$1,994 |
$2,741 |
| Full-time — females |
$1,370 |
$1,758 |
$2,353 |
| Full-time — all persons |
$1,424 |
$1,887 |
$2,560 |
| Part-time — males |
$350 |
$710 |
$1,120 |
| Part-time — females |
$420 |
$796 |
$1,193 |
| Part-time — all persons |
$393 |
$769 |
$1,169 |
| All employees — males |
$1,100 |
$1,674 |
$2,436 |
| All employees — females |
$718 |
$1,250 |
$1,826 |
| All employees — all persons |
$878 |
$1,436 |
$2,122 |
| All figures are weekly earnings from the main job. Part-time = fewer than 35 hours per week. Quartile figures show the range within which the middle 50% of earners sit. |
Source: ABS Employee Earnings and Hours, Australia (Cat. No. 6306.0), Table 1, May 2025. Female part-time workers record a slightly higher median than male part-time workers ($796 vs $710).
Casual workers sit outside both categories. They work without a guaranteed number of hours, do not have guaranteed ongoing shifts, and receive no paid leave. In exchange, they receive a casual loading of typically 25% above the applicable award or base rate, intended to compensate for the absence of annual leave, personal leave and redundancy pay.
Does casual loading increase annual earnings?
A 25% loading means casual workers get a higher hourly rate than a permanent worker in the same role. But casual hours are often variable or unpredictable. Nationally, 17% of all employees have no guaranteed minimum hours per week, and 22.3% report that their pay varies from week to week. Most casual workers end up working fewer hours per year than permanent workers, so the higher hourly rate often does not translate into higher annual income.
The leave entitlement divide
Around 1 in 5 Australian workers, or 20.3%, had no paid leave entitlements as at August 2025. Access to paid leave was not evenly spread across the workforce. Higher-paid workers were much more likely to have paid leave than those in the lowest-paid quarter.
94%
of workers earning at or above the median have paid leave
Access to both annual leave and paid sick leave
46%
of workers in the lowest-paid quarter have paid leave
More than half of Australia's lowest-paid workers have no leave entitlements
Not all casual workers want a different arrangement. Around 53% say they prefer casual work because of the flexibility it offers. Among those who would prefer a change, the most common reasons were access to paid leave, at 27%, and regular, predictable hours, at 19%.
Women are also more likely to be in casual work than men, at 21.2% compared with 17.7%.
How much less do part-time workers earn than full-time workers?+
The gap is large. Full-time workers earned a median of $1,887 per week in May 2025 while part-time workers earned a median of $769 per week, a difference of $1,118 per week. Over a full year, that adds up to roughly $58,000 less for the average part-time worker. The gap reflects hours worked rather than differences in hourly pay; part-time workers are typically paid comparable hourly rates within their industry and role.
Do casual workers earn more per hour than permanent employees?+
Casual workers typically receive a 25% loading on top of the applicable base pay rate. This gives them a higher hourly rate than a permanent worker in the same role. However, casual workers do not receive paid annual leave, carer's leave or redundancy pay. Whether the loading leads to higher annual income depends on how many hours the worker gets. Since 17% of all employees have no guaranteed minimum hours, variable hours can often offset the loading advantage.
What percentage of Australian employees have no paid leave entitlements?+
Around 1 in 5 Australian workers, or 20.3%, had no paid leave entitlements as at August 2025. Most of these workers are casual employees. More than half of workers in the lowest-paid quarter have no leave entitlements. By comparison, 94% of workers at or above the median have access to both annual leave and personal leave.
Section 07Public vs private sector salaries
Public sector vs private sector salaries in Australia
On average, public sector workers earn more. Full-time public sector workers averaged $2,215.90 per week in base pay as at November 2025, compared with $2,006.00 for private sector workers. That was a difference of $209.90 per week, or around $10,915 per year.
However, the gap mainly reflects the mix of jobs in each sector. It does not necessarily mean public sector workers are paid more than private sector workers in equivalent roles.
Public sector — base pay (full-time)
$2,216
Per week · $115,227/yr
Private sector — base pay (full-time)
$2,006
Per week · $104,312/yr
Public — all employees
$1,880
Total earnings per week · $97,760/yr
Private — all employees
$1,490
Total earnings per week · $77,454/yr
Public vs private sector average weekly earnings
Full-time base pay, full-time total, and all-employee total — November 2025
Public sector
Private sector
The gap widens from $210/week at the full-time level to $390/week across all employees, because the private sector has a far higher share of part-time and casual workers whose inclusion pulls its average down.
Source: ABS Average Weekly Earnings, Australia (Cat. No. 6302.0), Tables 6 and 9, November 2025.
The public sector is concentrated in roles that require advanced qualifications like teachers, nurses, police officers and administrators. There are far fewer entry-level and lower-wage positions than in the private sector, and that raises the public sector average significantly.
18.6%
Union members have higher median earnings
Trade union members earn a median of $1,600 per week, compared with $1,349 for non-union employees, a gap of 18.6%. This reflects higher coverage of formal workplace agreements among union members and their concentration in public sector and professional roles with structured pay scales.
At the top end of the private sector, earnings can comfortably exceed public sector equivalents. Bonuses, commissions and profit-sharing in financial services, resources, technology and corporate roles can add to total pay for some workers. These kinds of variable payments are largely absent in the public sector, which operates under formal pay scales.
Do public sector workers earn more than private sector workers in Australia?+
On average, yes. Full-time public sector workers averaged $2,215.90 per week in base pay as at November 2025, compared with $2,006.00 in the private sector. That was a gap of $209.90 per week, or $10,915 per year. The gap is larger when all employees are included: $1,879.80 per week vs $1,489.50 per week. This reflects sector composition. The public sector has more qualified, professional roles and fewer entry-level, part-time and casual positions.
Does being in a union affect how much a worker earns in Australia?+
There is a significant union pay advantage. Trade union members earned a median of $1,600 per week in August 2025, compared with $1,349 per week for non-union employees, an 18.6% gap. This partly reflects union members' higher concentration in public sector roles and greater coverage under formal workplace agreements.
Can private sector workers earn more than public sector workers?+
Yes, particularly at the higher end of the private sector. While public sector workers have higher average and median earnings overall, top private sector earners can earn more through bonuses, commissions, profit-sharing and company shares. These types of extra pay are common in financial services, mining, technology and senior corporate roles.
Section 08Wages vs inflation
How Australian wages compare to inflation
In 2026, wages grew by 3.3%, while inflation rose to 4.6%. This means real wages, which measure wages after inflation, fell by an estimated 1.3%.
Workers received a pay rise in dollar terms, but prices rose faster, so their money bought less.
This has been the pattern for much of the period since 2020. Inflation rose well above wage growth in 2022 and 2023. A recovery in 2024 and 2025 helped restore some lost ground. The renewed inflation pressure in 2026 means real wages are falling again.
Wage growth vs inflation, 2020 to 2026
Wage growth vs inflation rate, year-ended March quarter
Inflation peaked at 3.3 percentage points above wage growth in 2023, and wages were slow to catch up because most workers are locked into annual pay reviews or multi-year agreements they cannot immediately renegotiate.
Source: ABS Wage Price Index (Cat. No. 6345.0) and ABS Consumer Price Index (Cat. No. 6401.0), March quarter 2026.
Real wage change, 2020 to 2026
Annual change in purchasing power: wage growth minus inflation, year-ended March quarter
Positive bars show years when purchasing power grew; the back-to-back negatives in 2022 and 2023 add up to a combined real loss of around 6%, and the 2026 bar confirms real wages are falling again after two years of recovery.
Source: ABS Wage Price Index (Cat. No. 6345.0) and ABS Consumer Price Index (Cat. No. 6401.0). Real wage change = annual wage growth minus annual inflation rate.
Why real wages fell again in 2026
Wages grew by 3.3% in 2026, but inflation rose to 4.6%. This means prices increased faster than pay, reducing workers' purchasing power. The increase was largely linked to higher transport costs, with fuel prices playing a major role. Because fuel and transport costs affect many household budgets, the pressure can be felt more sharply by lower- and middle-income earners. Official wage measures also tend to respond slowly to sudden price increases. Many workers are still waiting for their next annual pay review when a price shock occurs.
−6%
Combined real wage loss, 2022–2023
In 2022, wages grew by 2.4%, while inflation ran at 5.1%. In 2023, wages grew by 3.7%, while inflation peaked at 7.0%. Together, those two years reduced household purchasing power by roughly 6%, one of the larger real-wage falls in recent decades. The recovery in 2024 and 2025 restored some of that ground. Renewed price growth in 2026 means average real incomes are falling again.
Are real wages falling in Australia in 2026?+
Yes. Real wages declined by an estimated 1.3% in 2026, as wage growth reached 3.3% while inflation rose to 4.6%. Australian workers received a pay rise in dollar terms, but the cost of goods and services rose faster, so their money bought less. The decline follows two years of real wage recovery in 2024 and 2025, when wage growth outpaced inflation for the first time since 2021.
What is the difference between dollar wage growth and real wage growth?+
Dollar wage growth measures how much pay has increased before inflation is taken into account. A 3.3% rise means pay cheques are 3.3% higher than a year earlier. Real wage growth adjusts that figure for inflation. It shows whether workers can buy more or less with their pay. If wages grow by 3.3% but prices rise by 4.6%, the real change is approximately −1.3%. In simple terms, workers are earning more dollars, but those dollars buy less.
When did Australian workers last see sustained real wage growth?+
The most recent years of positive real wage growth were 2024 and 2025, when wages outpaced inflation for two consecutive years. This was the first such stretch since 2021. Before that, the 2022–2023 period produced one of the sharpest real wage falls in recent decades. Wages lagged inflation by 2.7 percentage points in 2022 and 3.3 percentage points in 2023.
Why did inflation rise faster than wages in 2022 and 2023?+
The inflation surge was driven mainly by factors outside Australia, including rising global energy prices, pandemic-related supply chain disruptions and strong consumer spending after restrictions lifted. Wages tend to respond more slowly because many workers are covered by annual pay reviews or multi-year agreements. As a result, there can be a delay between an inflation spike and wages starting to catch up.
General information only
This article is based on publicly available data from the ABS. It is general information and does not constitute financial, legal or tax advice. Average and median earnings figures reflect population-level data at a specific point in time and may not represent individual circumstances. Earnings vary significantly depending on industry, occupation, employment type, location, qualifications, experience and employer. Before making financial decisions based on earnings data, consider seeking independent professional advice.
References
- ABS. Average Weekly Earnings, Australia (Cat. No. 6302.0), November 2025. Average weekly ordinary time earnings, total earnings, full-time adult earnings, sector breakdowns and industry earnings.
- ABS. Employee Earnings and Hours, Australia (Cat. No. 6306.0), May 2025. Median and quartile earnings by employment type, gender, method of setting pay, sector, industry and employer size.
- ABS. Wage Price Index, Australia (Cat. No. 6345.0), March Quarter 2026. Nominal wage growth trends used to compare wage increases over time.
- ABS. Consumer Price Index, Australia (Cat. No. 6401.0), March Quarter 2026. CPI inflation data used for real wage calculations and wage growth versus inflation comparisons.
- ABS. Characteristics of Employment, Australia (Cat. No. 4125.0), August 2025. Casual employment, paid leave entitlements, trade union membership, job flexibility, job security and casual employment preferences.