


Updated
- $353k
- Estimated national deposit gap, December quarter 2025
- $150k
- 20% deposit on the 2025 national house price benchmark
- +96.7%
- Increase in the estimated national deposit gap since 2015
- $33k
- Typical implied First Home Guarantee couple deposit, 2024–25
 How long does it take to save a house deposit in Australia?In the March 2026 quarter, Australia’s mean dwelling price reached $1,111,100, up from $677,475 in 2017. A 20% deposit on the national mean home is now $222,220.
 Australian Savings Statistics 2025Australia's saving rate shifted over the past decade. Before the pandemic, it sat between 4.5% and 7.4%. When COVID lockdowns limited people's spending, savings increased. By FY2021, the saving rate h…
 How much do Australians spend on bills each month?The average Australian household spent $674 a month on essential bills in 2025, covering electricity and gas, water, phone and internet, and home and contents insurance. That was 51% higher than in 20…
Section 01 · The average deposit
How much is the average house deposit in Australia?
The estimated average deposit gap in Australia was about $352,500 at the end of 2025, equal to roughly 32.4% of the average property price. That figure has risen by about 96.7% since 2015.
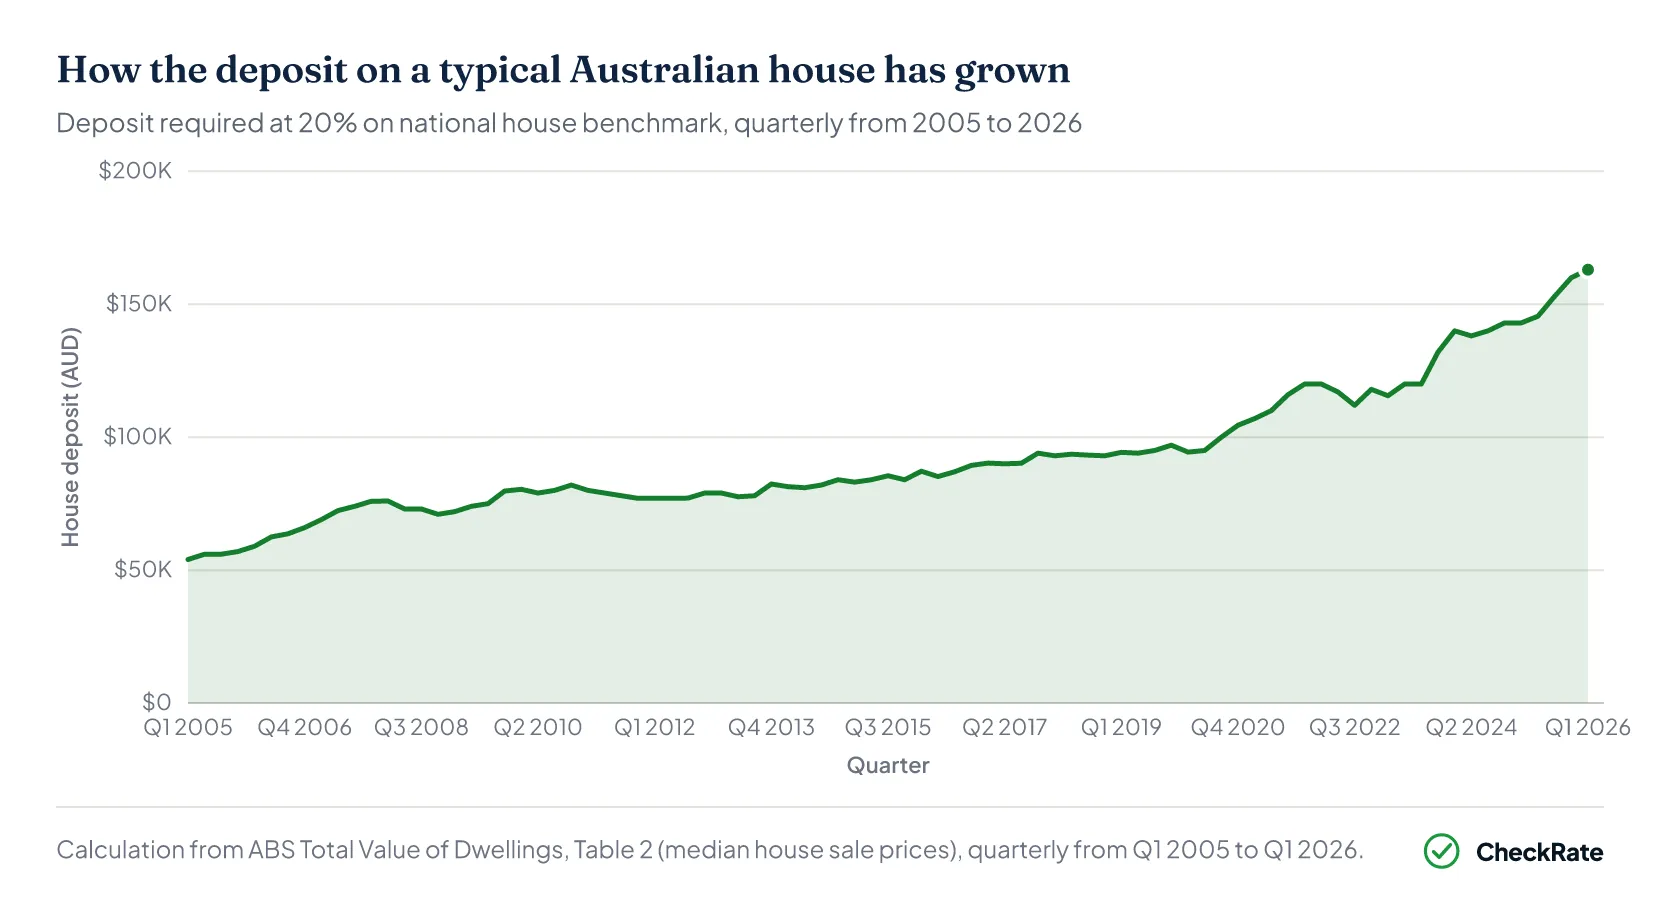
Benchmark deposits on the 2025 national house price benchmark are lower: $150,375 at 20%, $75,188 at 10% and $37,594 at 5%. First-home buyers using a government guarantee had an implied deposit of around $31,000 to $33,000, based on 2024–25 scheme-user data.
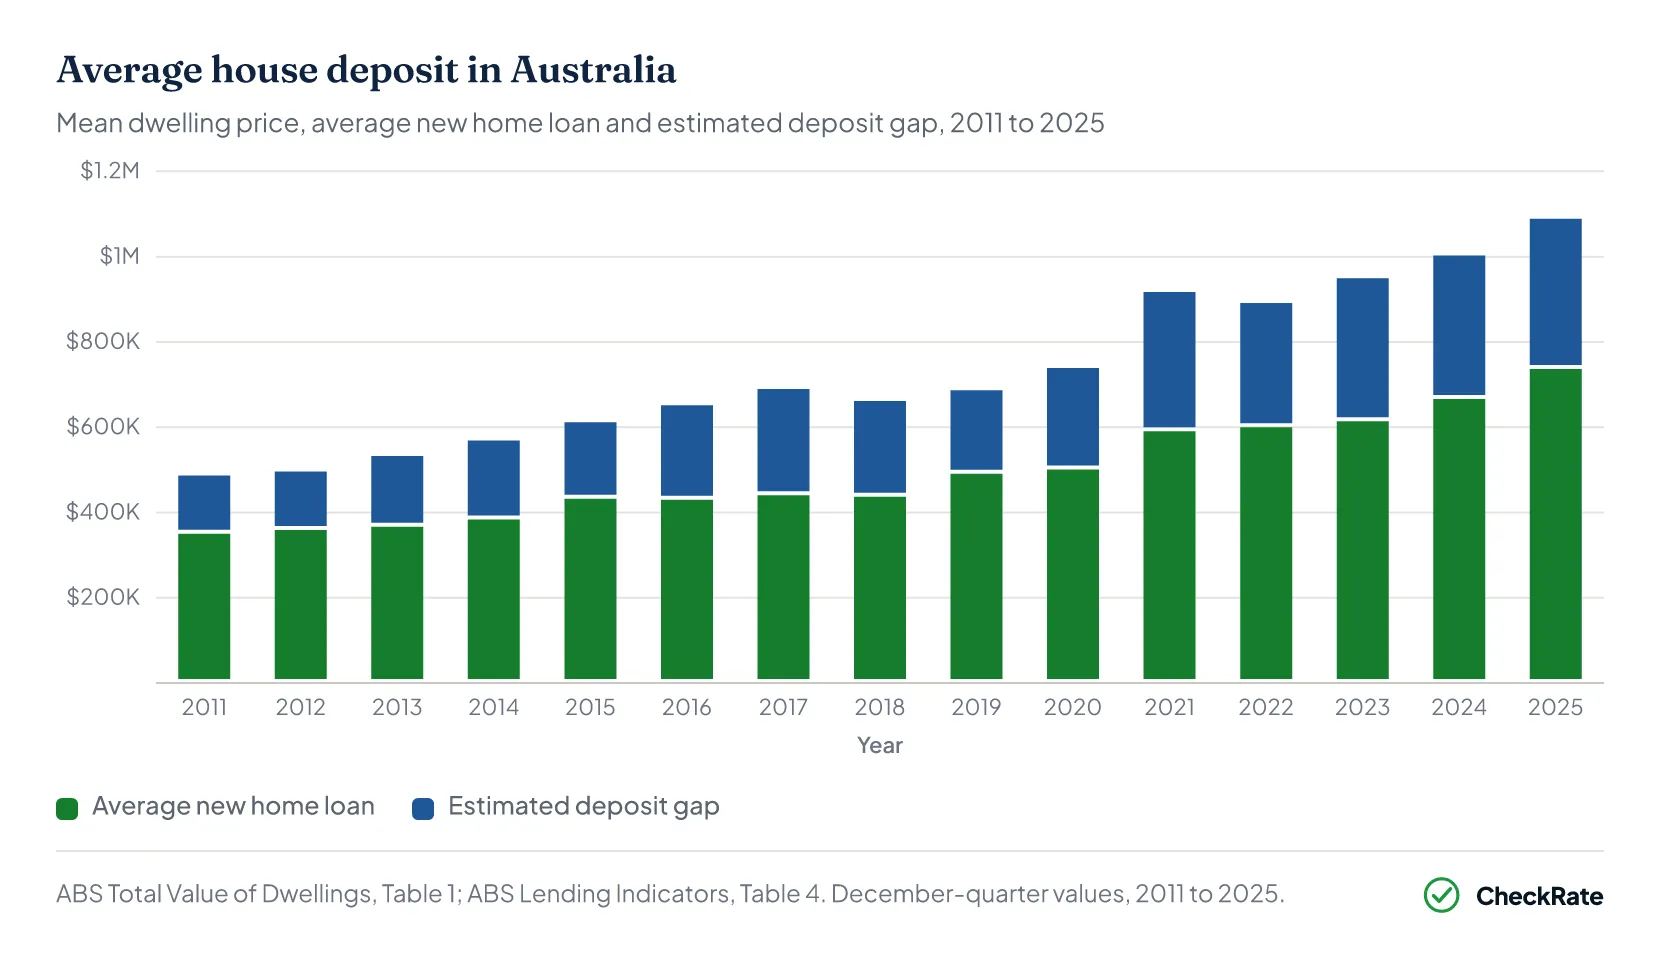
Two patterns stand out. The average property price has more than doubled since 2011, from about $486,900 to $1.09 million by December 2025. At the same time, the estimated deposit gap as a share of price has held in a fairly narrow band of 28% to 36%.
In simple terms, the deposit gap looks much larger today because the average property price underneath it has grown. As a share of the property price, the gap has been more stable.
How does the deposit change at 5%, 10% and 20%?
Using the 2025 national house price estimate of $751,875, the cash amount varies by tens of thousands of dollars depending on the deposit percentage. Fixed-percentage deposits show the cash required at 5%, 10% and 20%, while the estimated average deposit gap shows the difference between mean dwelling prices and average new loan sizes across the market.
5%
- Deposit required
$37,594
- Lenders mortgage insurance
LMI may apply
5% of the $751,875 national house price estimate. LMI is more likely at this level unless a government guarantee applies.
10%
- Deposit required
$75,188
- Lenders mortgage insurance
LMI may apply
10% of the $751,875 national house price estimate. LMI may still apply, although premiums are usually lower than at 5%.
20%
- Deposit required
$150,375
- Lenders mortgage insurance
LMI typically not required
20% of the $751,875 national house price estimate. This is the common benchmark at which LMI is usually not required.
The gap between 5% and 20% on the same house is more than $112,000. For a unit at the 2025 median of $603,500, those benchmarks drop to $30,175 at 5% and $120,700 at 20%.
Dwelling type and deposit percentage together make a larger difference to the cash benchmark than any single national average.
Section 02 · By state
Which states need the largest house deposits?
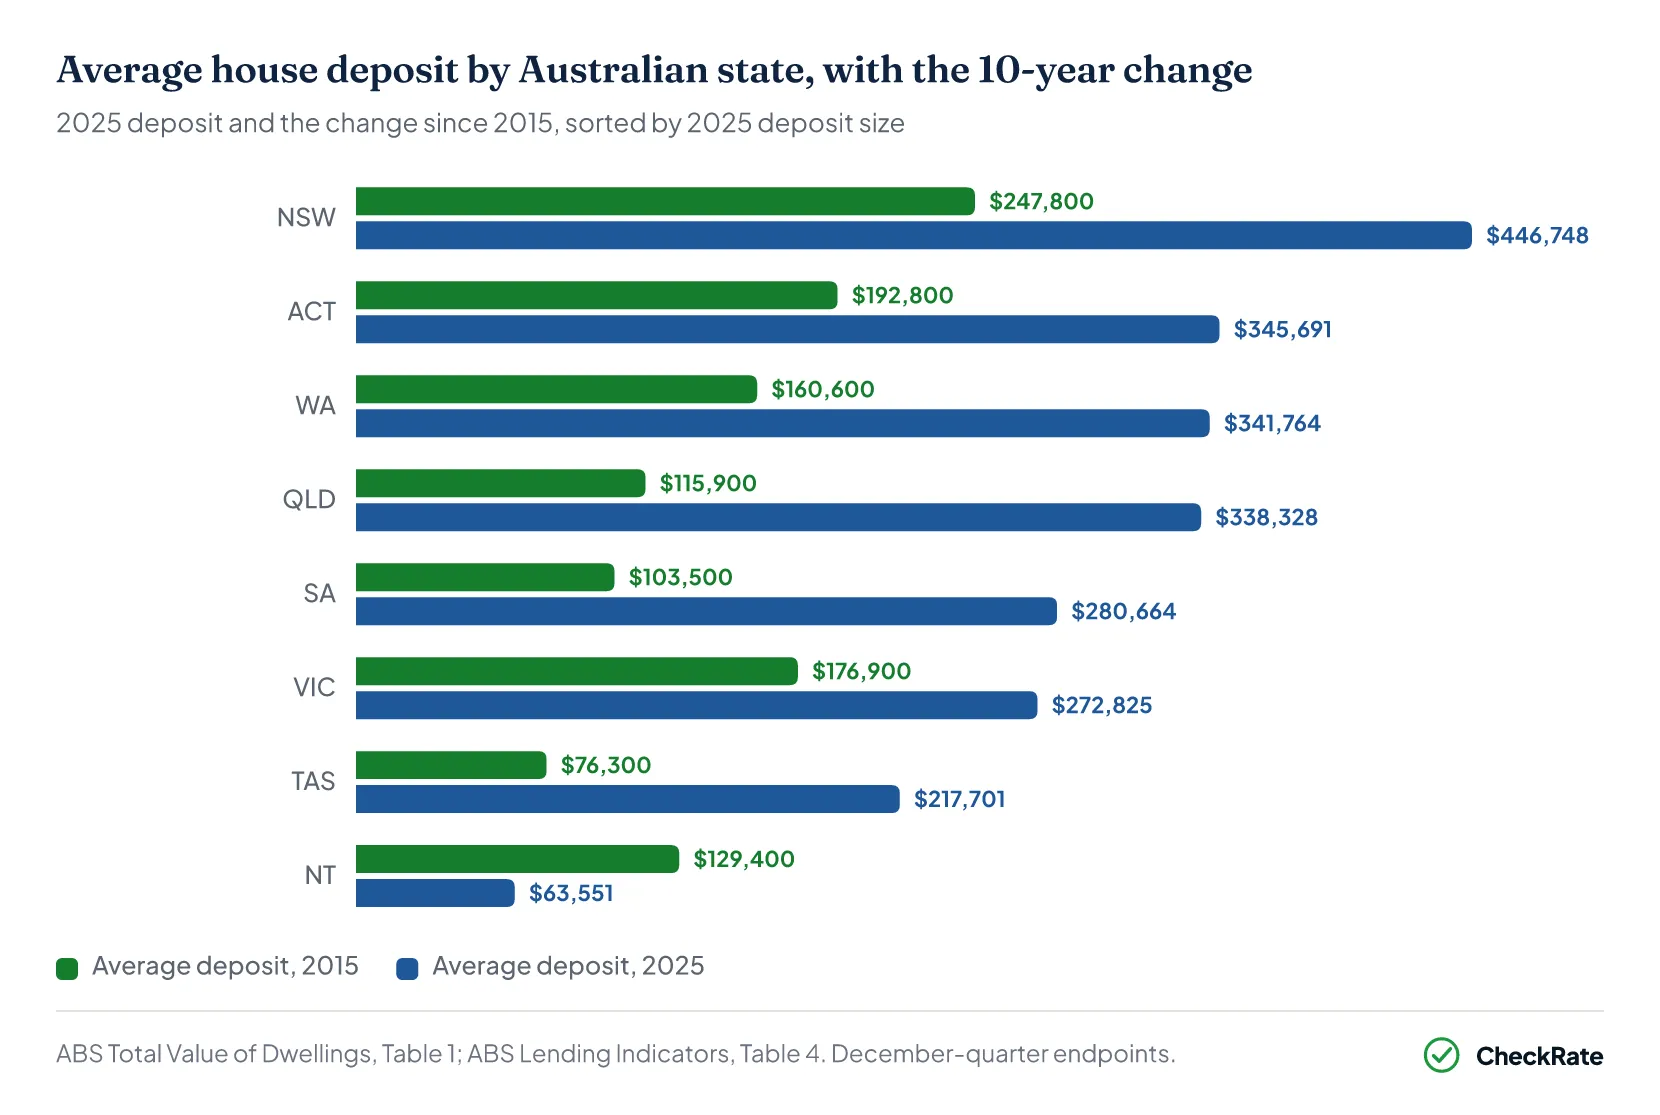
In December 2025, the estimated average deposit gap was about $446,700 in New South Wales and $63,600 in the Northern Territory, a gap of about $383,100 between the highest and lowest jurisdictions. Geography is one of the largest drivers of the estimated deposit gap.
- Average deposit estimate (2025)
- $446,748
- Share of average dwelling price
- 33.9%
- Decade change (2015 to 2025)
- 80.3%
- National rank by deposit size
- 1 of 8
- Mean dwelling price, 2025
- $1.32M
- Average new owner-occupier loan, 2025 annual
- $830,900
- Average deposit estimate (2025)
- $272,825
- Share of average dwelling price
- 28.7%
- Decade change (2015 to 2025)
- 54.2%
- National rank by deposit size
- 6 of 8
- Mean dwelling price, 2025
- $949,500
- Average new owner-occupier loan, 2025 annual
- $649,100
- Average deposit estimate (2025)
- $338,328
- Share of average dwelling price
- 31.5%
- Decade change (2015 to 2025)
- 191.9%
- National rank by deposit size
- 4 of 8
- Mean dwelling price, 2025
- $1.07M
- Average new owner-occupier loan, 2025 annual
- $684,100
- Average deposit estimate (2025)
- $280,664
- Share of average dwelling price
- 29.9%
- Decade change (2015 to 2025)
- 171.1%
- National rank by deposit size
- 5 of 8
- Mean dwelling price, 2025
- $938,700
- Average new owner-occupier loan, 2025 annual
- $617,300
- Average deposit estimate (2025)
- $341,764
- Share of average dwelling price
- 33.2%
- Decade change (2015 to 2025)
- 112.8%
- National rank by deposit size
- 3 of 8
- Mean dwelling price, 2025
- $1.03M
- Average new owner-occupier loan, 2025 annual
- $634,700
- Average deposit estimate (2025)
- $217,701
- Share of average dwelling price
- 30.1%
- Decade change (2015 to 2025)
- 185.2%
- National rank by deposit size
- 7 of 8
- Mean dwelling price, 2025
- $722,100
- Average new owner-occupier loan, 2025 annual
- $489,500
- Average deposit estimate (2025)
- $63,551
- Share of average dwelling price
- 11%
- Decade change (2015 to 2025)
- -50.9%
- National rank by deposit size
- 8 of 8
- Mean dwelling price, 2025
- $578,800
- Average new owner-occupier loan, 2025 annual
- $492,800
- Average deposit estimate (2025)
- $345,691
- Share of average dwelling price
- 34.4%
- Decade change (2015 to 2025)
- 79.3%
- National rank by deposit size
- 2 of 8
- Mean dwelling price, 2025
- $1M
- Average new owner-occupier loan, 2025 annual
- $636,600
Where has the estimated deposit gap grown fastest?
Queensland's estimated average deposit gap rose about 191.9% from 2015 to 2025, the biggest increase of any state. Tasmania followed at +185.2% and South Australia at +171.1%. All three started from a relatively low base in 2015 and have closed much of the gap to NSW. Victoria recorded the smallest mainland increase at +54.2%, and the Northern Territory was the only state where the estimated deposit gap fell, down about 50.9%.
Section 03 · Over time
How have Australia’s house deposits changed over time?
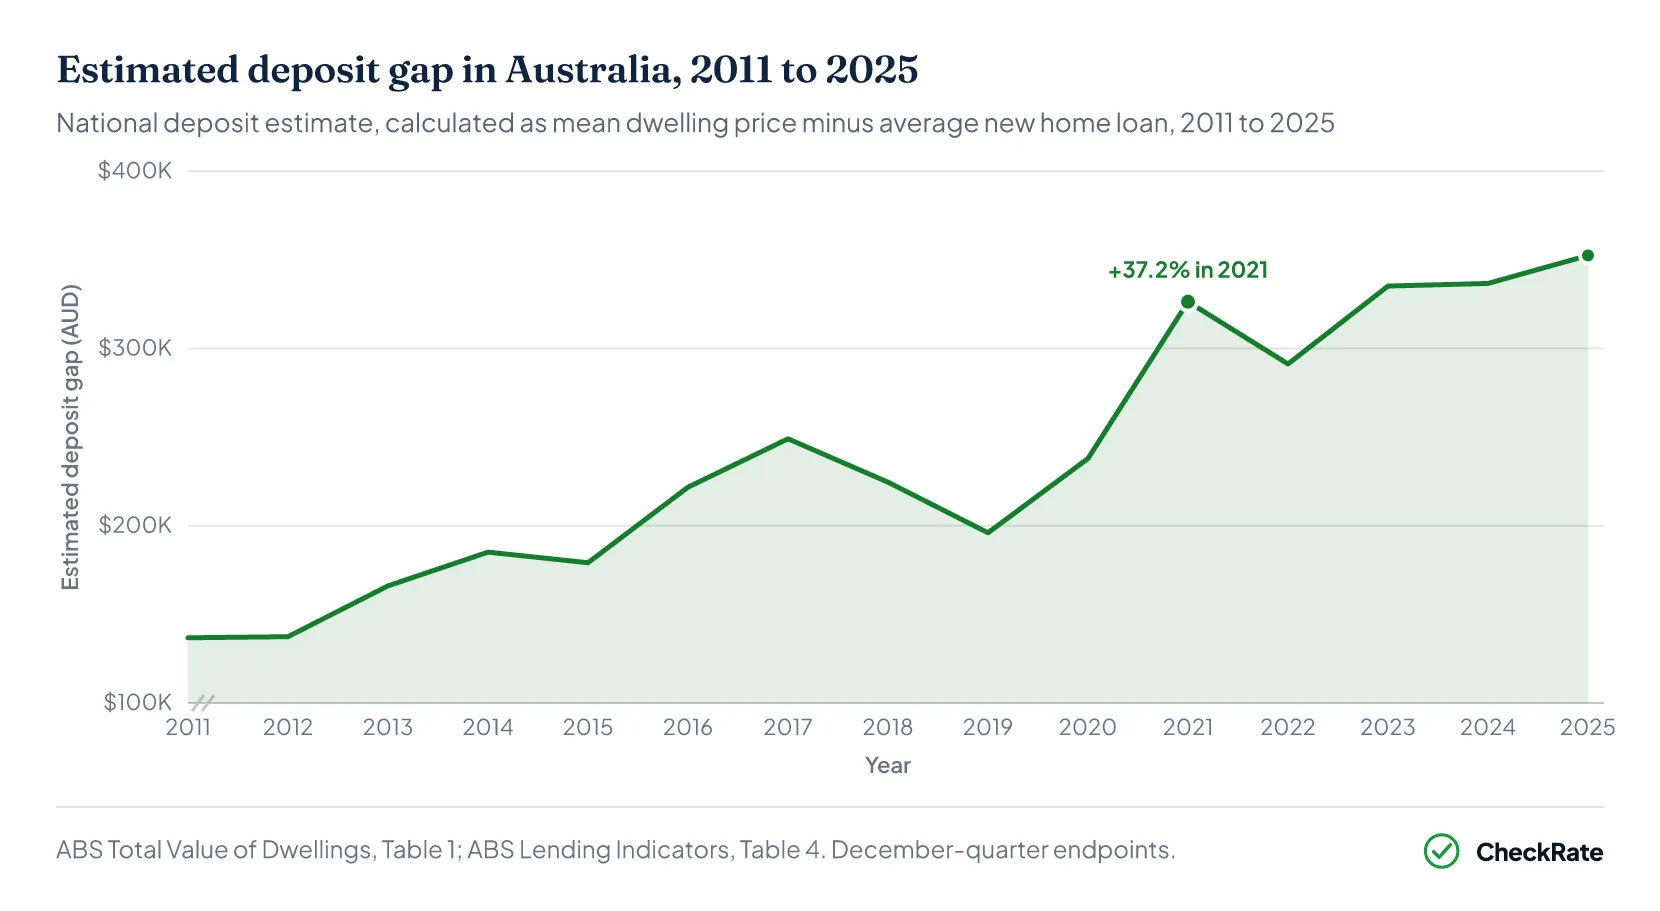
The national deposit estimate rose from $136,800 at the end of 2011 to $352,500 at the end of 2025, an increase of about 157.7% over 14 years.
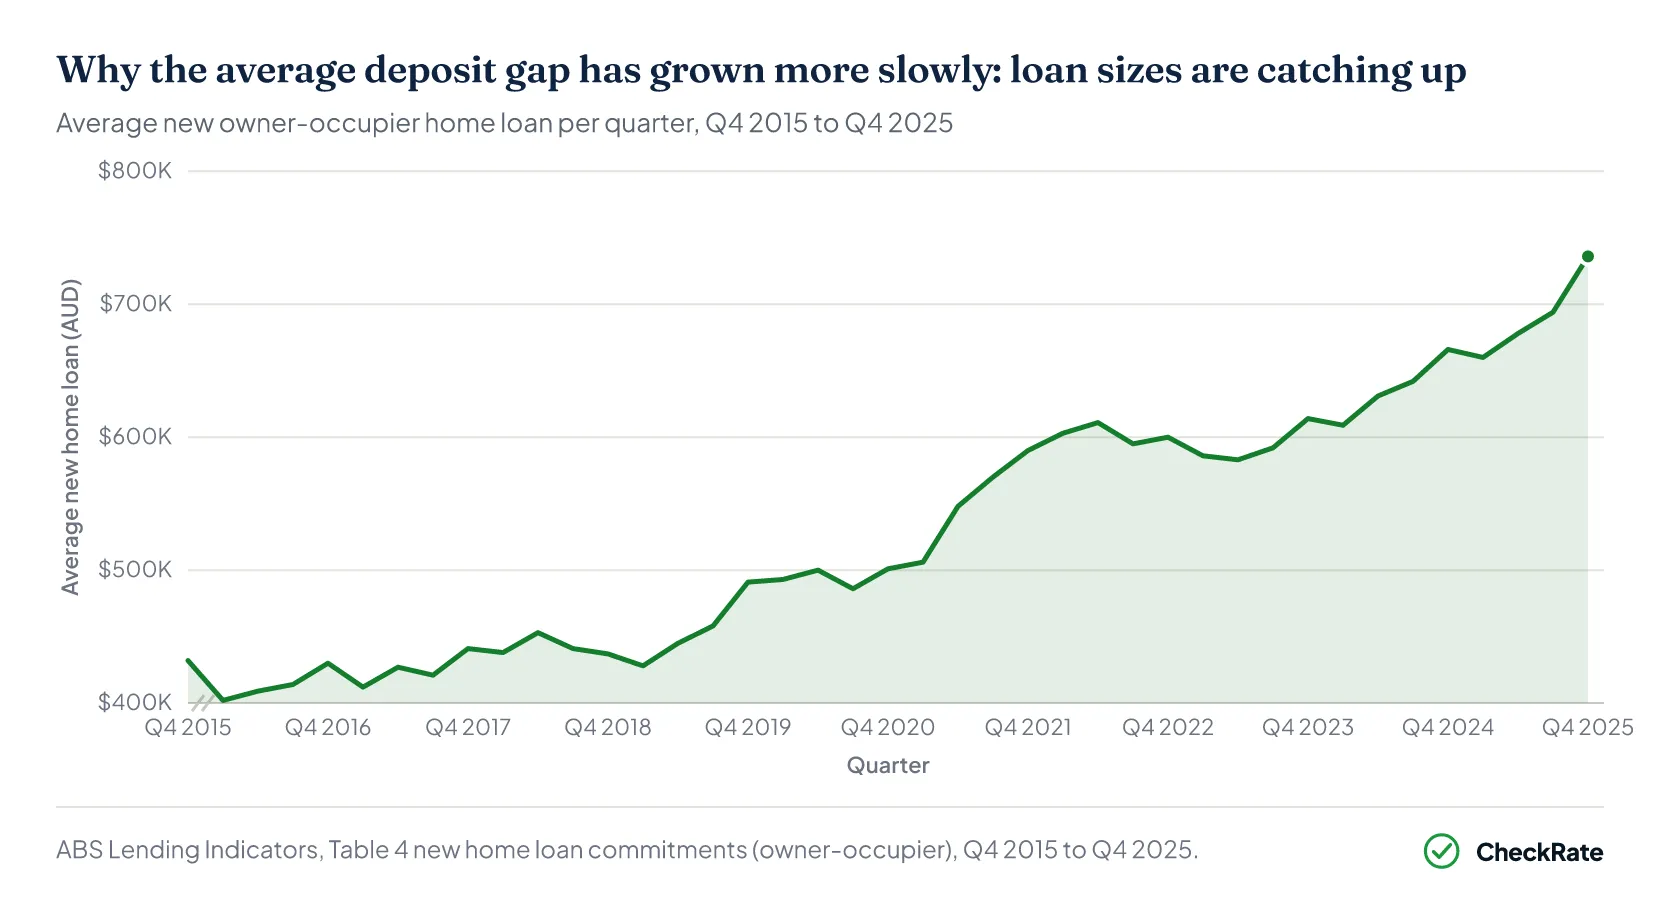
The estimate was little changed from 2023 to 2024, edging up from about $335,300 to $336,800, before rising to $352,500 in December 2025 as prices grew faster than loan sizes over the year.
How have rising loan sizes changed the deposit gap?
The national deposit estimate rose about 4.7% across 2025, as property prices grew slightly faster than average loan sizes. Average loan sizes grew from about $638,600 across 2024 to $694,400 across 2025 on a calendar-year average basis.
When average loan sizes rise closer to dwelling prices, the calculated deposit gap can stay flatter even as prices increase.
Section 04 · 2026 update
How much is the average house deposit in 2026?
Nationally, the mean dwelling price rose from $1,088,800 to $1,111,100 between December 2025 and March 2026, while the average new owner-occupier loan size was little changed, easing slightly from $736,257 to $734,881. Because loan sizes did not keep pace with mean dwelling prices, the estimated deposit gap widened faster in this one quarter than it did across all of 2025.
| Estimated deposit gap by state, December 2025 vs March 2026 | |||
|---|---|---|---|
| State | Dec 2025 gap | Mar 2026 gap | Quarter change |
| New South Wales | $446,700 | $464,400 | +4.0% |
| Western Australia | $341,800 | $400,800 | +17.3% |
| Queensland | $338,300 | $382,600 | +13.1% |
| Australian Capital Territory | $345,700 | $352,800 | +2.0% |
| South Australia | $280,700 | $309,100 | +10.1% |
| Victoria | $272,800 | $272,500 | −0.1% |
| Tasmania | $217,700 | $229,300 | +5.3% |
| Northern Territory | $63,600 | $61,100 | −3.9% |
| Australia | $352,500 | $376,200 | +6.7% |
Source · Calculation from ABS Total Value of Dwellings, Table 1, and ABS Lending Indicators, Table 4. March Quarter 2026 compared with the December Quarter 2025 figures used elsewhere in this article.
State patterns varied widely in the first quarter of 2026. Western Australia recorded the largest increase, with its estimated deposit gap rising 17.3% in the quarter to about $400,800. That moved Western Australia ahead of Queensland and the ACT to become the second-largest estimated gap in the country.
Queensland rose 13.1%, and South Australia rose 10.1%. The Northern Territory was the only jurisdiction where the gap fell, down 3.9%, while Victoria was little changed, down 0.1%.
Section 05 · Houses
How much is a 20% house deposit by capital city?
A 20% deposit on the 2025 Sydney median house price of $1.51 million is $302,525, the highest of any Australian capital. Canberra is second at $203,675.
At the other end, Darwin's 20% benchmark is $130,110, less than half of Sydney's.
| How much deposit do you need for a house in each Australian capital city? | ||||
|---|---|---|---|---|
| Capital city | Median price | 5% deposit | 10% deposit | 20% deposit |
| Sydney | $1,512,625 | $75,631 | $151,262 | $302,525 |
| Canberra | $1,018,375 | $50,919 | $101,838 | $203,675 |
| Brisbane | $1,012,250 | $50,612 | $101,225 | $202,450 |
| Adelaide | $894,125 | $44,706 | $89,412 | $178,825 |
| Perth | $875,625 | $43,781 | $87,562 | $175,125 |
| Melbourne | $853,075 | $42,654 | $85,308 | $170,615 |
| Hobart | $725,000 | $36,250 | $72,500 | $145,000 |
| Darwin | $650,550 | $32,528 | $65,055 | $130,110 |
| Australia | $751,875 | $37,594 | $75,188 | $150,375 |
Source · ABS Total Value of Dwellings, Table 2, for capital-city median transfer prices.
How much has a 20% house deposit increased in Australia?
A 20% deposit on the national house benchmark was $84,150 in 2015 and $150,375 in 2025, an increase of $66,225, or 78.7%, in a decade. The national house benchmark price rose from $420,750 in 2015 to $751,875 in 2025.
Regional vs capital city house deposits
A 20% deposit in the rest of South Australia is $105,475, about $73,000 less than the Adelaide equivalent of $178,825.
The 2025 medians outside the capitals are $527,375 for the rest of South Australia, $750,625 for the rest of Queensland and $780,500 for the rest of NSW.
Regional median prices can therefore produce lower 20% benchmark deposits than capital-city medians, although the size of the gap varies by state.
Section 06 · Units
How much is a 20% unit deposit in Australia?
The largest dollar difference is in Sydney: a 20% deposit on the unit median of $840,575 is $168,115, which is $134,410 less than the Sydney house deposit.
Perth sits between Darwin and Melbourne, with a $49,975 gap between its house and unit 20% deposit figures. Units cost less than houses in every capital, so the 20% deposit is also lower.
| Capital city | Median price | 5% deposit | 10% deposit | 20% deposit |
|---|---|---|---|---|
| Sydney | $1,512,625 | $75,631 | $151,263 | $302,525 |
| Canberra | $1,018,375 | $50,919 | $101,838 | $203,675 |
| Brisbane | $1,012,250 | $50,613 | $101,225 | $202,450 |
| Adelaide | $894,125 | $44,706 | $89,413 | $178,825 |
| Perth | $875,625 | $43,781 | $87,563 | $175,125 |
| Melbourne | $853,075 | $42,654 | $85,308 | $170,615 |
| Hobart | $725,000 | $36,250 | $72,500 | $145,000 |
| Darwin | $650,550 | $32,528 | $65,055 | $130,110 |
| Australia | $751,875 | $37,594 | $75,188 | $150,375 |
How has the deposit gap between houses and units changed?
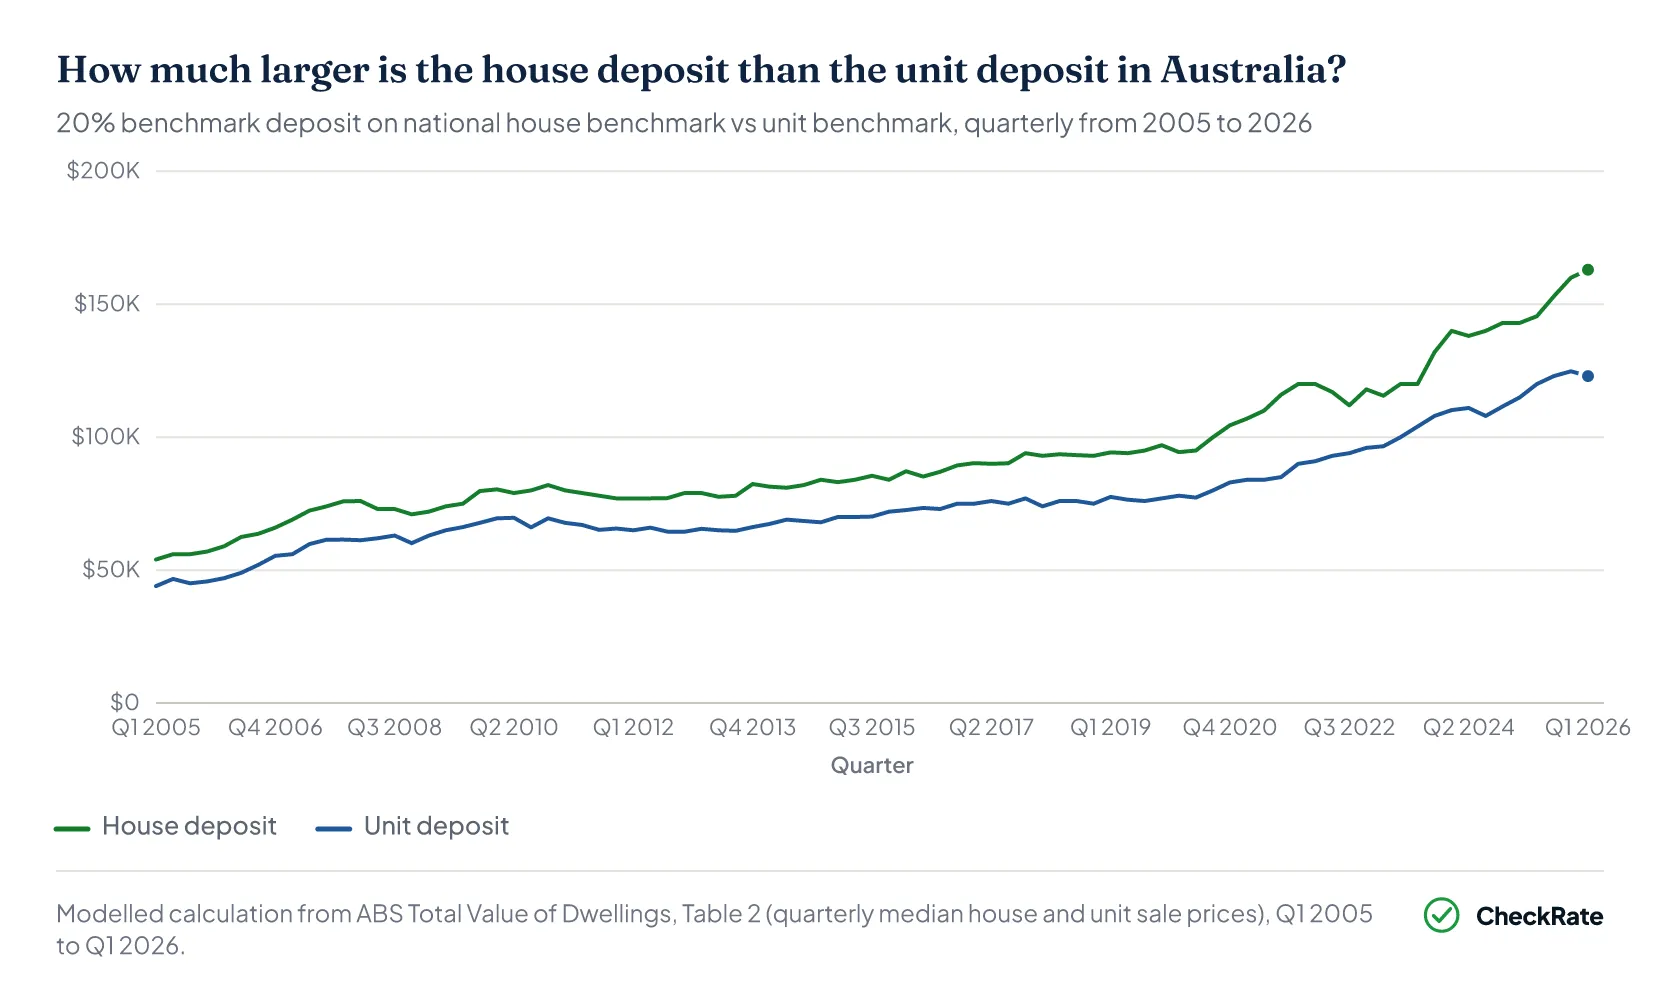
The deposit gap between houses and units has grown from $10,370 in 2005 to $29,675 in 2025, nearly tripling over two decades.
In 2005, a 20% benchmark deposit on the median house was about $55,750, compared with $45,380 for a unit. House prices have risen faster than unit prices, particularly since 2020.
Section 07 · First-home buyers
What is the average first-home buyer deposit in Australia?
Couples using the First Home Guarantee had an implied deposit of about $33,000 in 2024–25, based on a median purchase price of $660,000 and a 95% loan-to-value ratio.
Single borrowers had an implied deposit of about $31,000, based on a median purchase price of $521,000 and a 94% loan-to-value ratio.
First-home-buyer deposits vs the broader market
The median first-home-buyer deposit across the broader market was about $68,200 in the three years to 2019–20, measured in 2022–23 prices.
Among non-scheme first-home buyers from January 2020 to May 2022, the average deposit was $122,000, compared with about $34,000 for scheme participants.
The gap reflects that scheme borrowers typically purchased at lower price points and used higher loan-to-value ratios.
How much are first-home buyers borrowing?
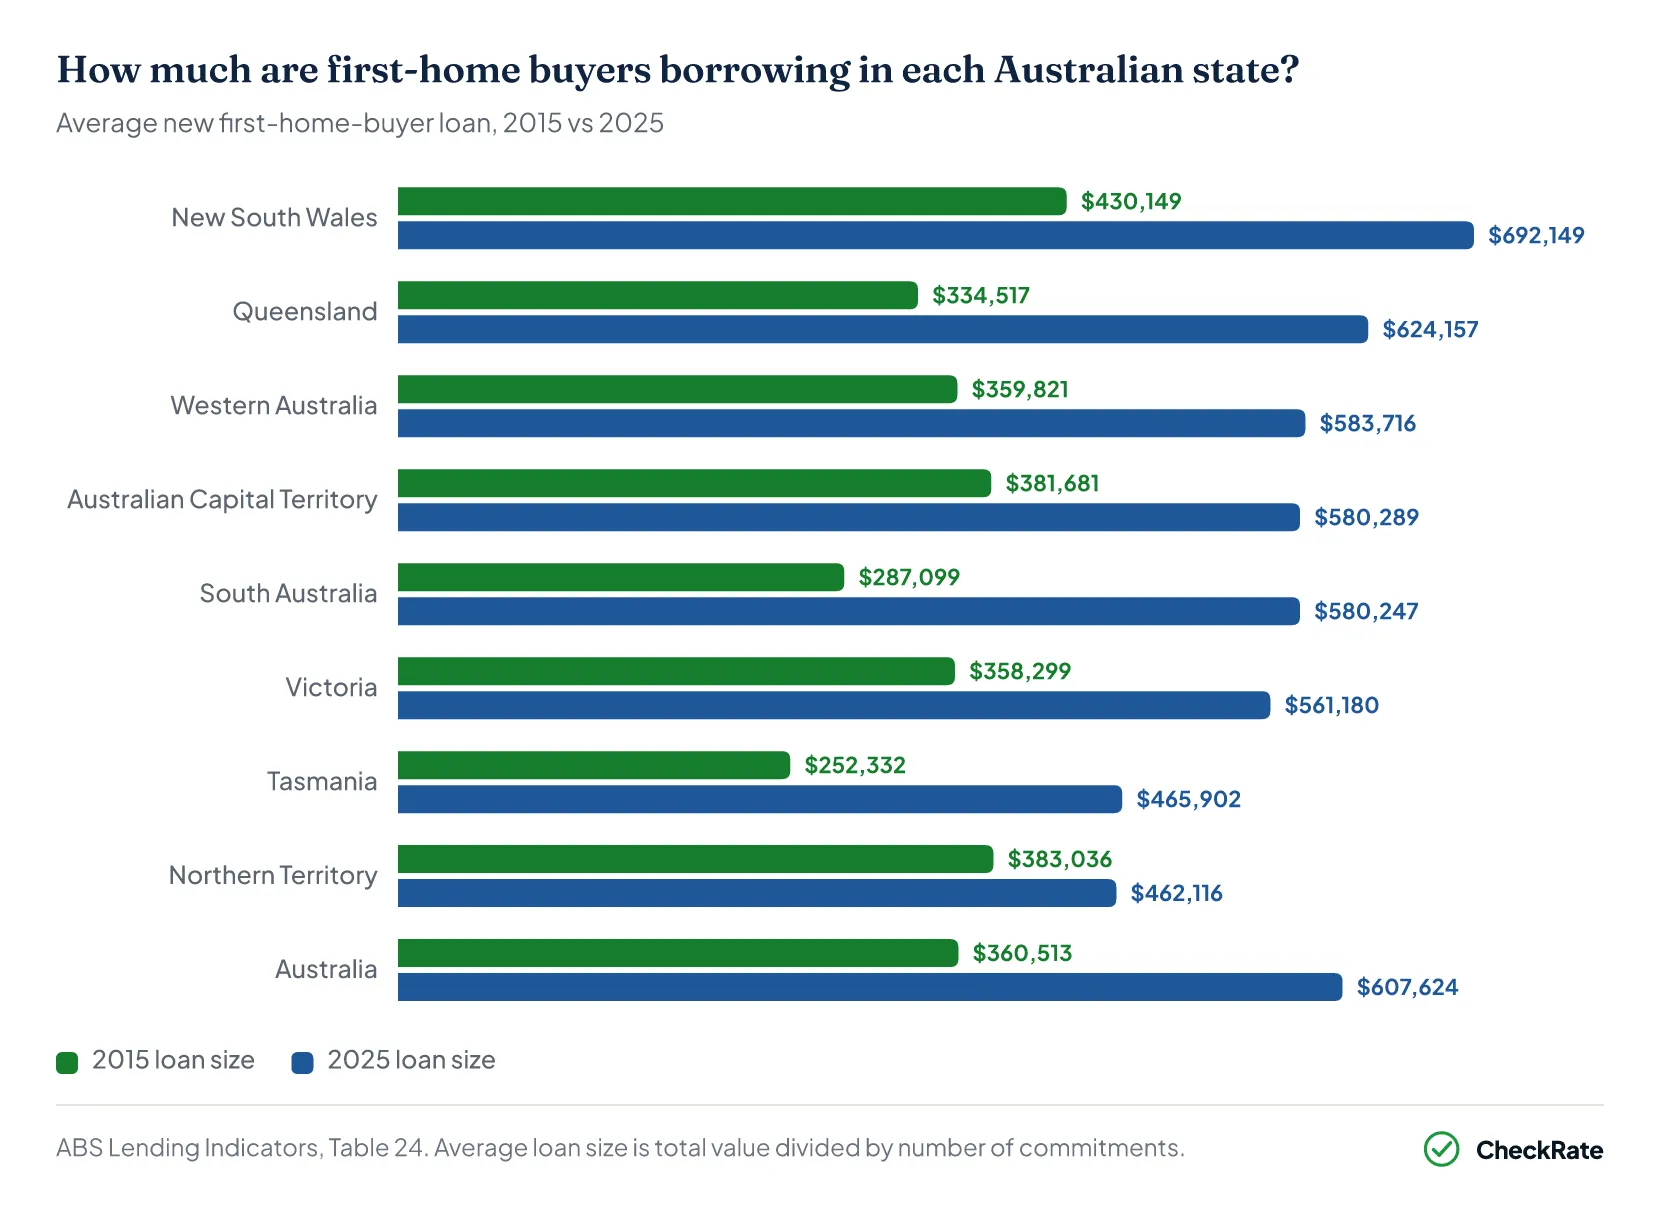
The national average new first-home-buyer loan rose from $360,500 in 2015 to $607,600 in 2025, up 68.5% in a decade.
South Australia, Queensland and Tasmania recorded the biggest decade increases. A higher loan does not always mean a higher deposit, because many first-home buyers use a 5% to 10% deposit and borrow the rest.
Repayments on a loan of this size vary by interest rate, loan term, repayment type, lender and borrower profile.
Section 08 · Calculator
House deposit calculator
Using the article’s 2025 national house price estimate of $751,875, a 20% deposit is $150,375.
The worked example also includes a simplified upfront-cost allowance of $22,556, based on 3% of the property price. The example uses the national house price estimate; deposit and upfront-cost estimates change with the property price, state and buyer status.
House deposit calculator
Work out the deposit, the loan and the cash you need upfront for a house or unit at your city’s median price — or any price you enter.
References
- ABS Total Value of Dwellings, March quarter 2026 · Australian Bureau of Statistics
- Lending Indicators, June Quarter 2026, Table 24, cat. 5601.0 · Australian Bureau of Statistics
- Reserve Bank of Australia: Super for Housing, 2025 · Reserve Bank of Australia
- Housing Australia, Home Guarantee Scheme Trends and Insights Report 2024–25 · housingaustralia.gov.au
- Housing Australia / NHFIC: First home buyer insights, 2022 · housingaustralia.gov.au