


Published 18 May 2026 · Updated 2 July 2026
- 119,464
- First-home buyer loan commitments in 2025, up 43% from 2015
- $67.9B
- Borrowed by first-home buyers in 2025, a 132% rise over ten years
- 35.3%
- Of owner-occupier loans went to first-home buyers in 2025
- $569k
- Average first-home buyer loan, up 62% from $351k in 2015
 Australian mortgage statistics 2026Australia had about 9.3 million occupied private dwellings at the 2021 Census. Of these, around 3.24 million (35.0%) were owned with a mortgage, 2.87 million (31.0%) were owned outright, and 2.84 mill…
 Stamp duty by state: how much do home buyers pay in Australia?For most home buyers, stamp duty is the single biggest upfront cost after the deposit, adding between $28,949 and $54,151 at average state dwelling prices in March quarter 2026. It is a state governme…
 Most affordable states for first-home buyers in 2026Tasmania had a mean dwelling price of $750,300 in the March quarter 2026, the lowest of any state and 32.5% below the national average of $1,111,100. Victoria was next at $947,100, followed by South A…
Section 01 · Annual volume
First-home buyer activity rebounds after the 2021 peak
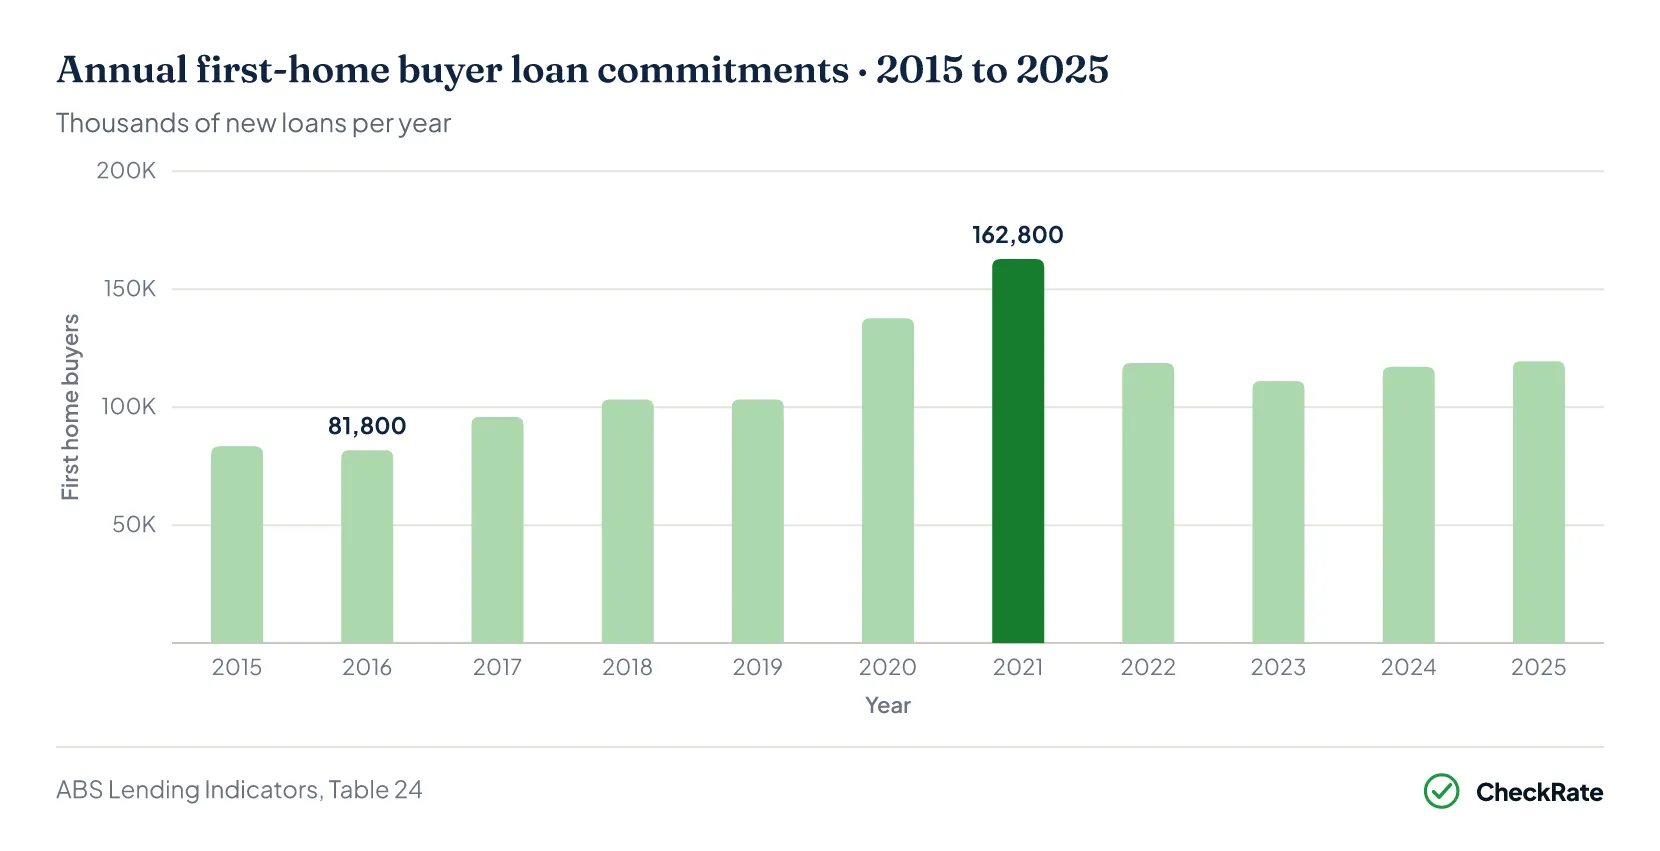
More than 119,000 Australians took out their first home loan in 2025, up from 83,441 a decade earlier. The high point for the decade was 162,808 loans in 2021, when low interest rates and expanded government programs lifted activity to its highest level on record.
Annual first-home buyer loan numbers have moved with interest rates and government support. The Reserve Bank's run of rate rises pulled numbers back to 111,094 in 2023, the lowest point since 2016. Activity has lifted modestly since, reaching 119,464 in 2025.
The December 2025 quarter alone recorded 34,013 new commitments, the highest quarterly total since early 2022. Combined with the October 2025 expansion of the Home Guarantee Scheme, 2026 is likely to keep the recovery going.
Section 02 · Value of lending
Value of first-home buyer lending over the decade
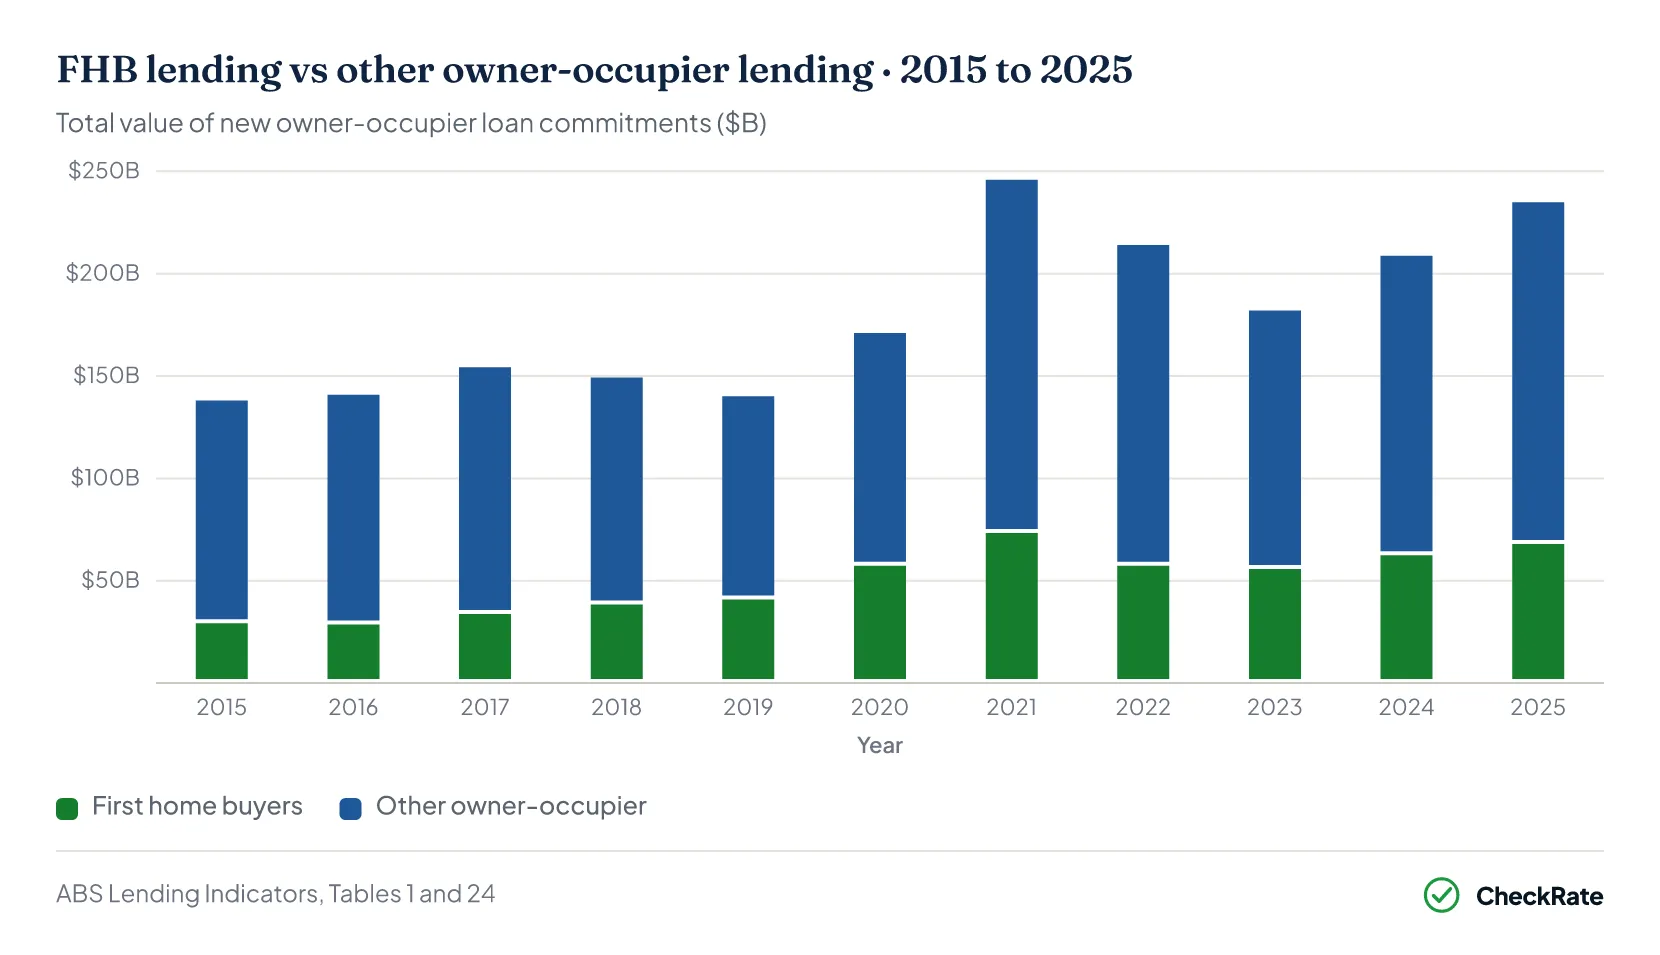
First-home buyers collectively put $67.9 billion into Australian property in 2025, more than double the $29.3 billion recorded in 2015. The all-time high of $73.3 billion was set in 2021 and has not yet been reclaimed.
The dollar value of first-home buyer lending has grown far faster than the number of buyers. While loan counts rose 43% over the decade, the total value of commitments more than doubled, driven almost entirely by rising property prices pushing loan sizes higher.
$73.3B
First-home buyer lending hit a record in 2021 Despite the recent recovery, the 2021 peak of $73.3 billion has not yet been reclaimed. The 2025 total of $67.9 billion sits about 7% below that mark, even though average loans are now larger. The difference is volume: 2021 had roughly 43,000 more first-home buyer loans than 2025.
Section 03 · Market share
First-home buyers now make up one in three home loans
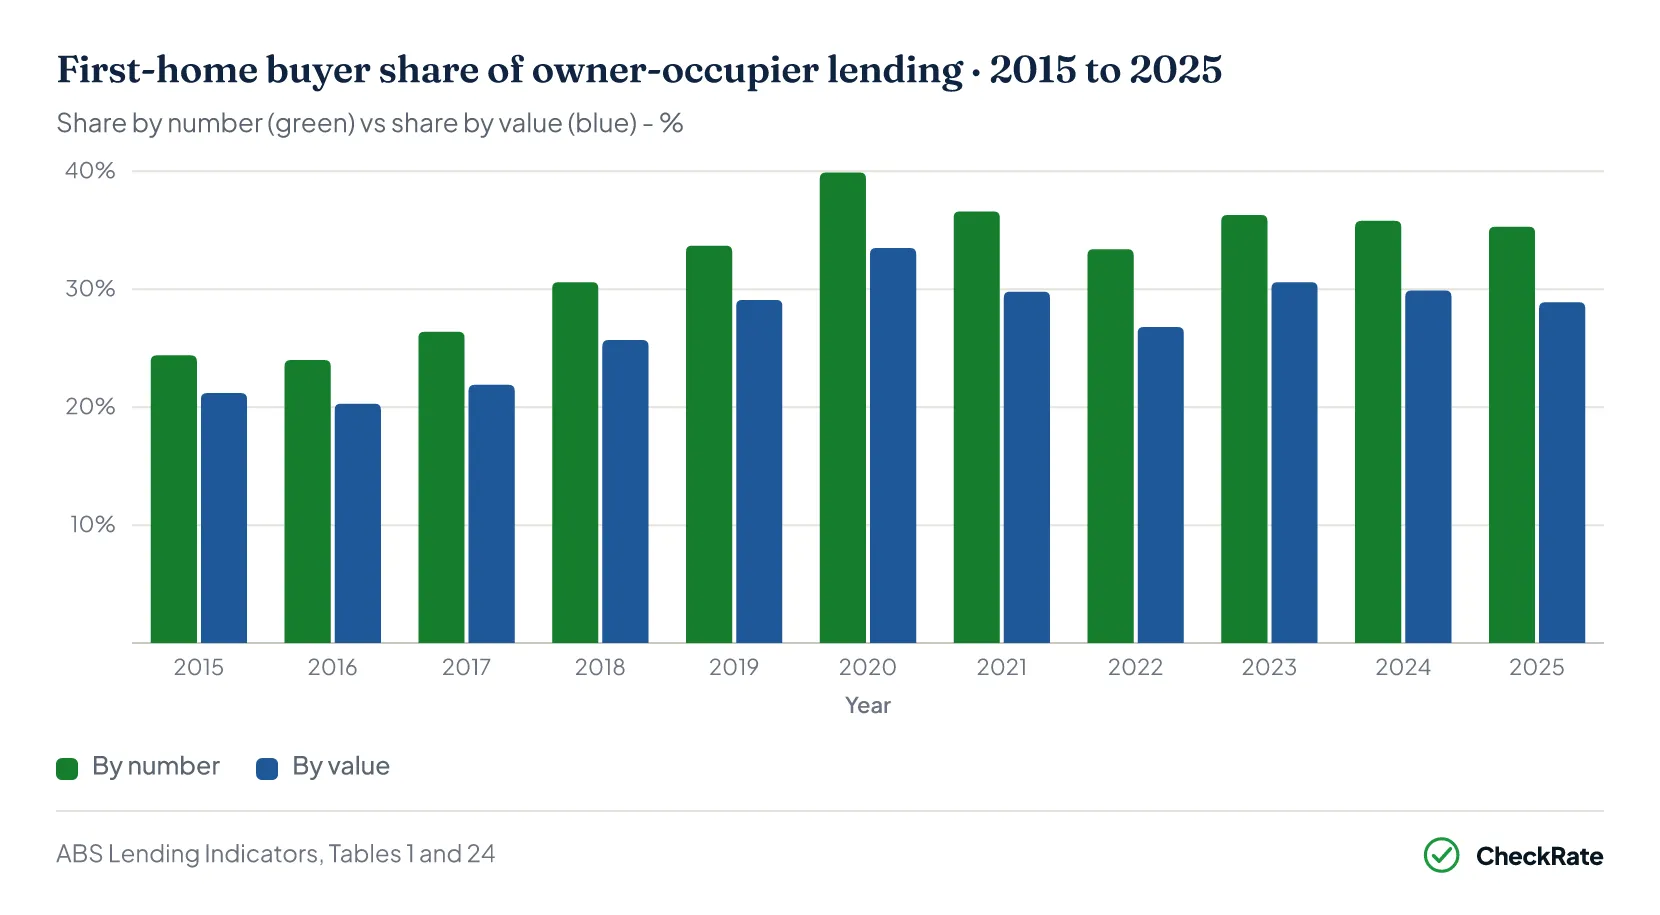
Roughly one in three owner-occupier home loans now goes to a first-home buyer. That share stood at 35.3% by number and 28.9% by value in 2025, both holding steady after peaking during the 2020 government support period.
Both measures peaked in 2020, when first-home buyers took 39.9% of loans by number and 33.5% by value. Both shares have settled in the mid-30s by number and high-20s by value since 2023.
Section 04 · Loan size
Average first-home buyer loan size: how much are buyers borrowing?
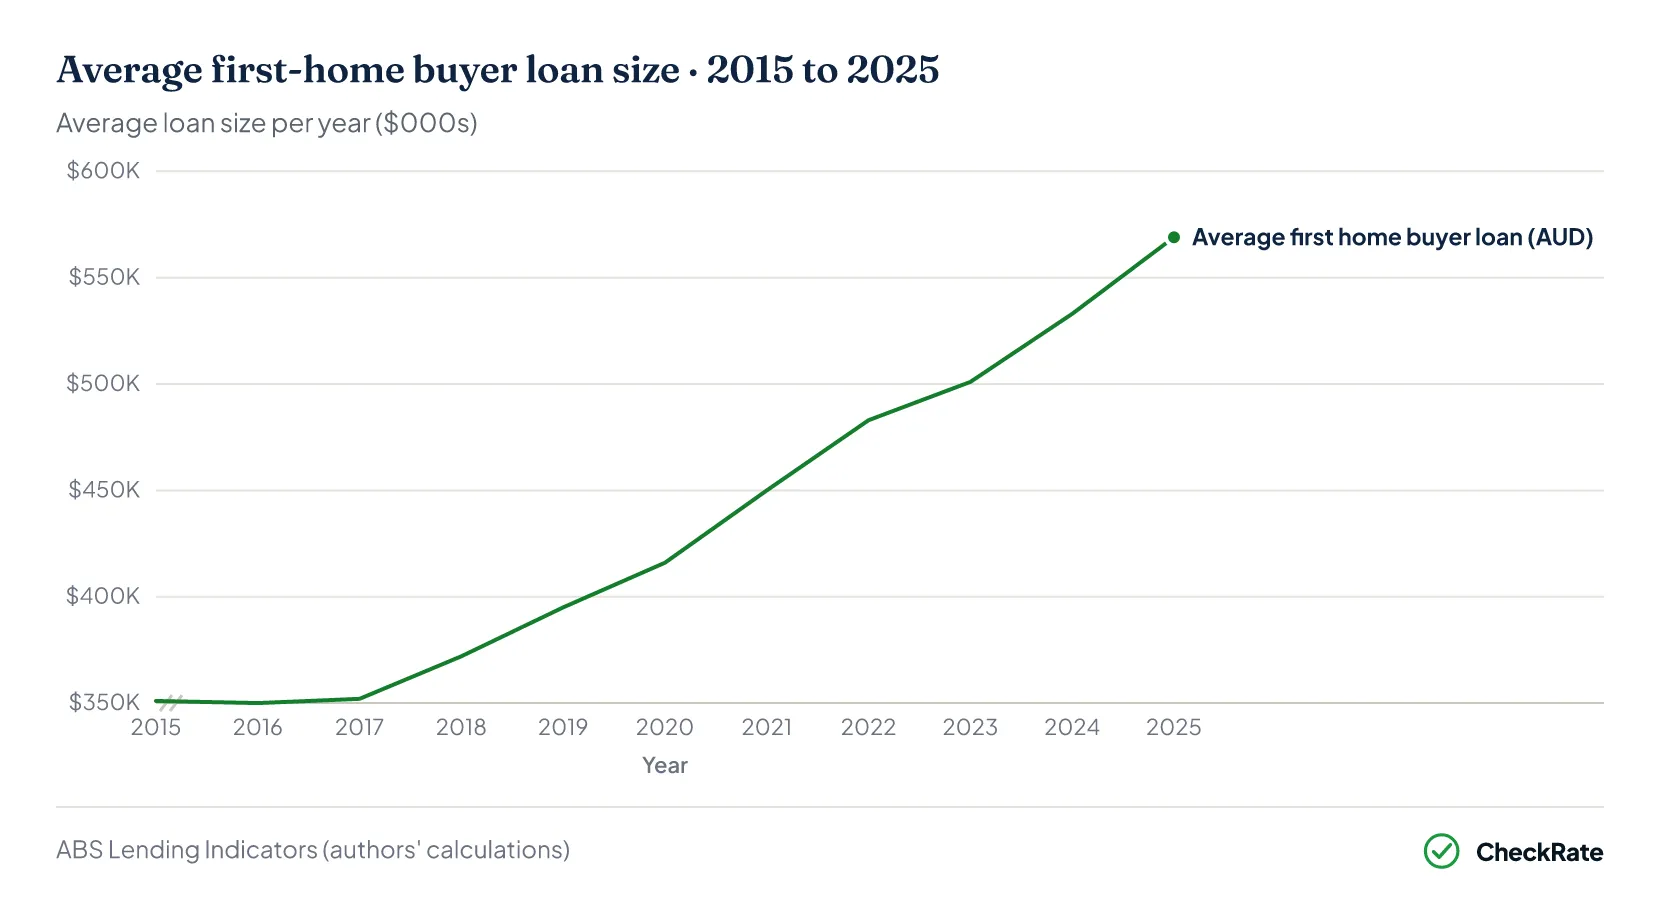
$569,000 is what the average first-home buyer borrowed in 2025, compared to $351,000 ten years earlier. Loan sizes range from around $445,000 in Tasmania to $652,000 in New South Wales.
The average held near $350,000 from 2015 to 2017, rose through the 2018 to 2021 price cycle, and has kept climbing even as the number of loans eased back from the 2021 peak.
Section 05 · State and territory
State by state: where first-home buyer activity is strongest
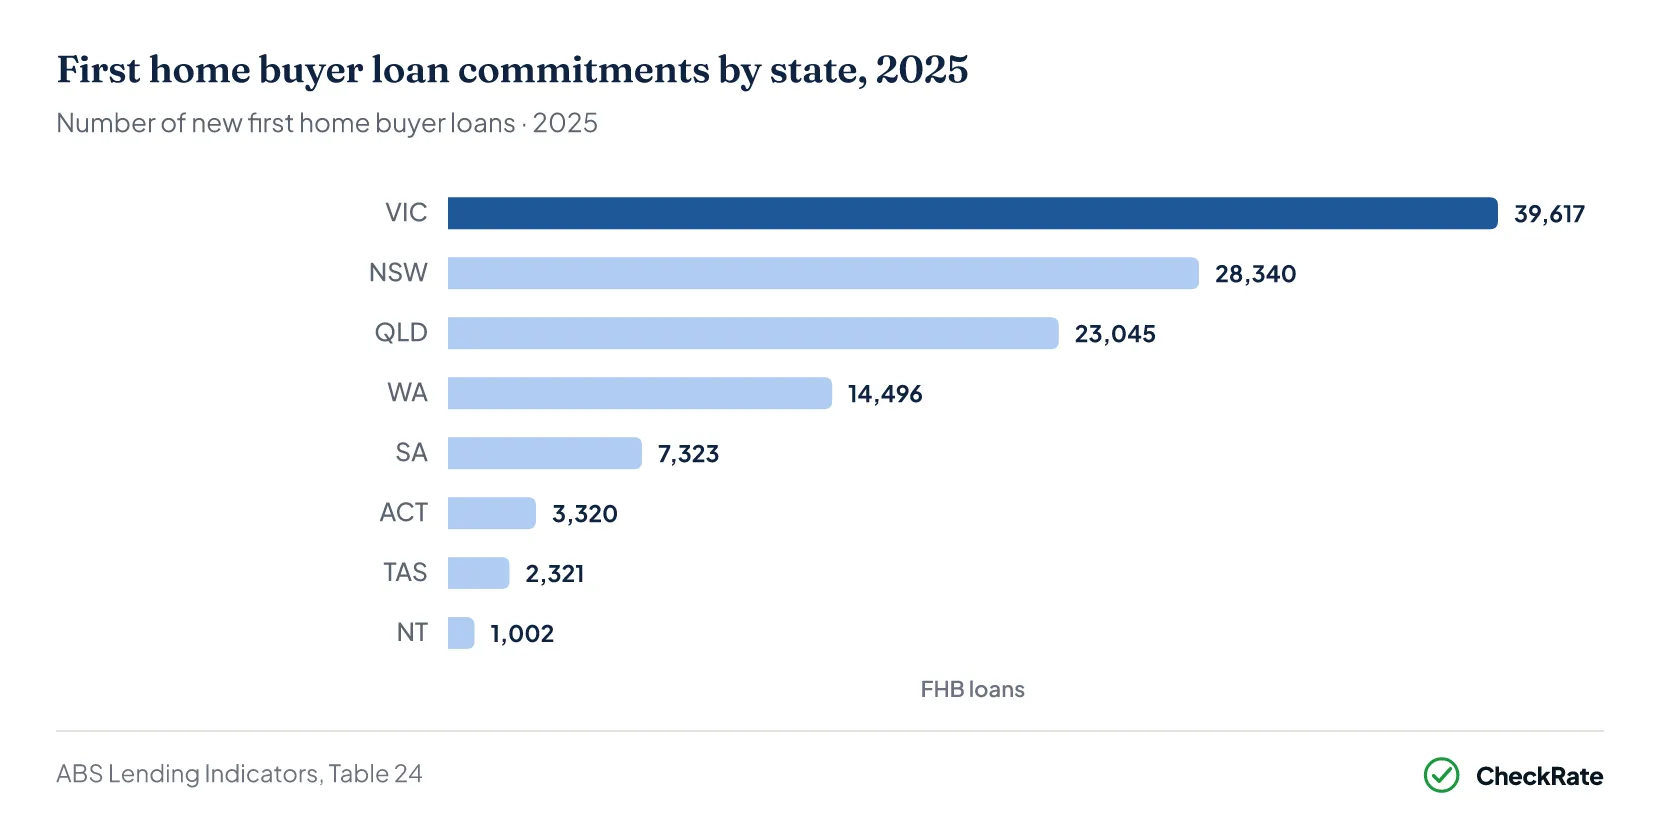
Victoria leads the country with 39,617 first-home buyer loans in 2025, ahead of New South Wales (28,340) and Queensland (23,045). These three states account for more than three in four loans nationally, though NSW buyers borrow the most on average at $652,000.
A first-home buyer in NSW borrows an average of $117,000 more than one in Victoria, and around $205,000 more than one in Tasmania.
| First home buyer lending by state · 2025 | |||
|---|---|---|---|
| State | FHB loans | Total value | Average loan |
| NSW — Highest average loan size | 28,340 | $18.48B | $651,941 |
| VIC — Highest loan count nationally | 39,617 | $21.21B | $535,346 |
| QLD — Second-largest average loan | 23,045 | $13.20B | $572,945 |
| WA — Activity up since 2022 | 14,496 | $7.80B | $538,356 |
| SA — Stamp duty abolished for new builds 2024 | 7,323 | $3.92B | $534,617 |
| ACT — Income-tested concession model | 3,320 | $1.83B | $550,904 |
| TAS — Smallest average loan size | 2,321 | $1.03B | $445,067 |
| NT — $50k FHOG, largest grant nationally | 1,002 | $0.45B | $449,102 |
Source · ABS Lending Indicators, Table 24
Section 06 · Government support
What government support is available to first-home buyers?
There are five main ways the Australian government supports first-home buyers, including the Home Guarantee Scheme, Help to Buy, the First Home Super Saver Scheme, the First Home Owner Grant, and stamp duty concessions. The Productivity Commission estimates that state duty concession spending alone exceeded $1.6 billion in 2023-24, up 20% from the previous year.
| The five mechanisms of first home buyer support | ||
|---|---|---|
| Mechanism | Administered by | What it does |
| Home Guarantee Scheme — HGS: First Home Guarantee + Family Home Guarantee | Federal · Housing Australia | Federal guarantee replaces LMI for deposits as low as 2-5% |
| Help to Buy — Shared equity, launching late 2025 | Federal | Government takes up to 40% equity in a new home, 30% existing |
| First Home Super Saver — Tax-advantaged savings via superannuation | Federal · ATO | Up to $50,000 of voluntary contributions at concessional tax rates |
| First Home Owner Grant — Restricted to new builds in most states | State-administered | Cash grant from $10k to $50k depending on state |
| Stamp duty concessions — Largest form of assistance nationally | State-administered | Full or partial exemption from transfer duty to state thresholds |
Source · Housing Australia, ATO, state revenue offices
State transfer duty concessions remain the largest single form of financial help in dollar terms. NSW saved 82,174 first-home buyers a combined $1.7 billion in the twelve months after its July 2023 threshold expansion. Victoria processed 42,208 duty concession payments worth $825.6 million in 2024-25. Queensland lifted its full-exemption threshold from $500,000 to $700,000 in 2024, giving buyers a maximum saving of $17,350.
Section 07 · New vs existing
New builds or existing homes: where are first-home buyers buying?
National ABS data does not separate first-home buyer loans by property type. The clearest signal available is that every mainland state now restricts its First Home Owner Grant to new builds only, pointing to a deliberate policy push toward new construction over existing stock.
Restricting grants to new builds is designed to turn buyer cash into actual construction, targeting what the Productivity Commission identifies as a long-term shortage of homes.
| First home owner grant by state · 2025 · new-build vs established eligibility | ||
|---|---|---|
| State / territory | Grant amount | Eligibility |
| Northern Territory — Most generous direct cash grant | $50,000 | New builds |
| Queensland — Temporarily doubled to support construction | $30,000 | New builds only |
| South Australia — Combined with full stamp duty abolition | $15,000 | New builds only |
| NSW, VIC, WA, TAS — Rely more heavily on stamp duty concessions | $10,000 | New builds only |
| ACT — Income-tested concession instead of a grant | N/A | Concession only |
Source · State revenue offices.
Section 08 · Scheme uptake
How many first-home buyers used a government scheme in 2024-25?
The Home Guarantee Scheme supported 46,022 first-home buyers in 2024-25, filling 92% of available places. A further 18,300 made withdrawals through the First Home Super Saver Scheme, with a total of $364.4 million released that year.
| Federal Home Guarantee Scheme and FHSS uptake · 2018-19 to 2024-25 | |||||
|---|---|---|---|---|---|
| Year | HGS places available | HGS places taken | Take-up rate | FHSS releases | FHSS paid |
| 2018-19 | N/A | N/A | N/A | 4,200 | $50.8M |
| 2019-20 | 10,000 | approx. 10,000 | 100% | N/A | N/A |
| 2020-21 | 20,000 | 19,416 | 97% | 12,100 | $171.5M |
| 2021-22 | 20,000+ | 24,500 | N/A | 12,500 | $170.4M |
| 2022-23 | 50,000 | 32,500 | 65% | 13,300 | $203.8M |
| 2023-24 | 50,000 | 43,800 | 87% | 16,800 | $312.7M |
| 2024-25 | 50,000 | 46,022 | 92% | 18,300 | $364.4M |
Source · Housing Australia Annual Reports, ATO FHSS data
118,936
Home Guarantee Scheme backs a $59.6 billion loan book As of 30 June 2025, Housing Australia backed 118,936 active guarantees linked to a $59.6 billion loan book. Only 0.3% were 90+ days in arrears, while 0.9% were receiving hardship support. Around one in five participants had already exited the scheme, usually within 2.5 years.
The low default rate suggests that for this group of buyers, the main barrier to homeownership was cash to pull a deposit together, not the ability to keep up with ongoing repayments. That finding is central to the government's decision to move the scheme to uncapped operation from October 2025.
First-home buyer stamp duty concessions by state
Victorian stamp duty concession volumes peaked at 53,980 payments in 2020-21 and stood at 42,208 in 2024-25. The total dollar value has kept climbing, reaching $825.6 million in 2024-25, because property prices have continued to rise.
| Victorian stamp duty concession volumes and value · selected years | ||||
|---|---|---|---|---|
| Year | Metro volume | Regional volume | Total payments | Value of assistance |
| 2013-14 | 18,089 | 4,924 | 23,013 | $133.0M |
| 2017-18 | 26,179 | 9,094 | 35,273 | $551.7M |
| 2020-21 | 38,285 | 15,695 | 53,980 | $885.0M |
| 2022-23 | 27,716 | 8,602 | 36,318 | $665.6M |
| 2023-24 | 32,849 | 8,944 | 41,793 | $798.1M |
| 2024-25 | 32,564 | 9,644 | 42,208 | $825.6M |
Source · State Revenue Office, Victoria
Section 09 · Who's buying
Who is buying a first home in Australia?
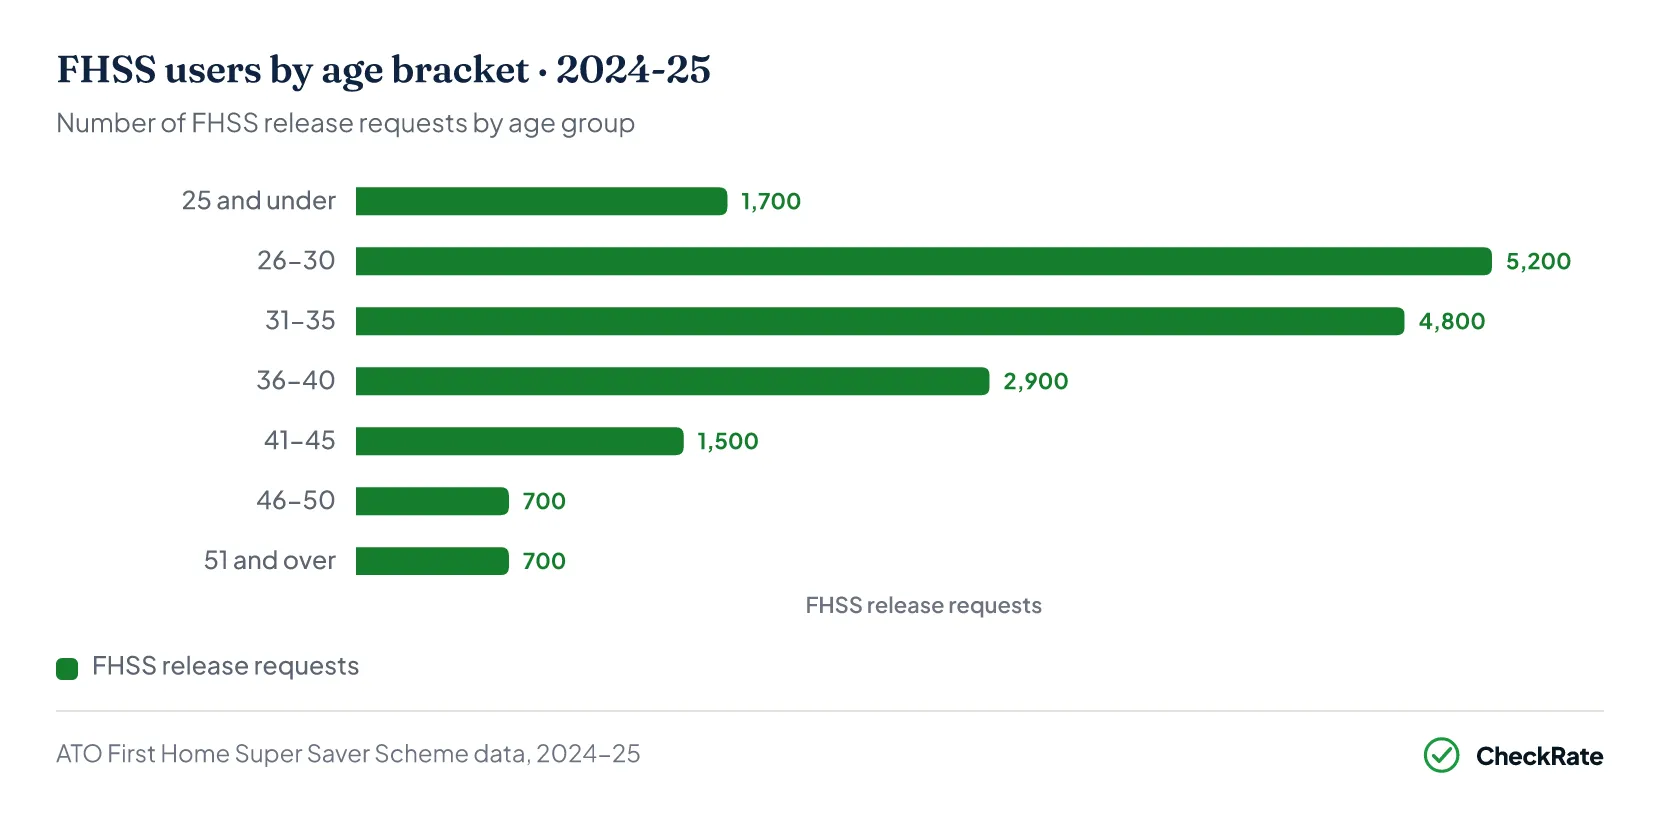
Today's typical first-home buyer is under 35, relies on two incomes, and is increasingly leaning on a federal guarantee or family help to cover the deposit. In 2024-25, 17% received financial support from their parents, up from 11% in 2022. More than half of Home Guarantee Scheme users say they would have needed at least two extra years to save without it.
Age trends: more buyers under 30 than ever before
In 2022-23, more than 50% of scheme participants were under 30, up from 33% in 2019-20. The 18 to 24 cohort alone climbed from 3% of scheme users to 14% over the same period.
Key workers and single parents using the Home Guarantee Scheme
According to Housing Australia, more than 45,000 key workers have used the HGS since it launched, including 11,300 in 2023-24 alone. Nurses made up 35% of participating key workers, teachers accounted for 34% and emergency services staff made up 11%. The Family Home Guarantee has a clear gender skew, with 82% of participants in 2023-24 being women, reflecting the financial gap that often follows separation.
Section 10 · Tenure picture
Australia's housing split: owners, renters and mortgage holders
Australian households are almost evenly split between those paying off a mortgage, those who own outright, and renters. The 2021 Census put those shares at 35%, 31% and 31% respectively, a split that has shifted over decades as outright ownership has fallen from 41% in 1996.
Shared equity arrangements have historically been a very small part of the market, though the federal Help to Buy scheme and existing state programs are set to expand that category from 2026 onwards.
| Australian household tenure mix · Census 2021 | ||
|---|---|---|
| Tenure | Share of households | Approx. households |
| Mortgaged — Owner-occupier still paying off a home loan | approx. 35% | approx. 3.8M |
| Owned outright — Down from 41% in 1996 | approx. 31% | approx. 3.4M |
| Renting — Private and public rental combined | approx. 31% | approx. 3.4M |
| Other / not stated — Includes shared equity, boarding, life tenure | approx. 3% | approx. 0.3M |
Source · ABS Census 2021, Housing Occupancy and Costs
The long-run decline in outright ownership is arguably the biggest shift in the data. Where previous generations typically paid off a mortgage and entered retirement debt-free, the median outstanding mortgage balance in retirement-age households has roughly tripled in inflation-adjusted terms over the past twenty years.
Total Australian household debt reached $3.40 trillion in December 2025, with owner-occupier and investment property loans making up more than 93% of the total. For a fuller breakdown of household borrowing, see our Australia household debt statistics article.
References
- ABS Lending Indicators (Tables 1, 4 and 24) · Australian Bureau of Statistics
- Housing Australia Annual Report 2024-25 · housingaustralia.gov.au
- ATO First Home Super Saver Scheme data · ato.gov.au
- State Revenue Office Victoria — first home buyer duty concession statistics · sro.vic.gov.au
- Revenue NSW — First Home Buyer Assistance Scheme data · revenue.nsw.gov.au
- Queensland Revenue Office — first home concession and grant statistics · qro.qld.gov.au
- RevenueSA — Stamp duty relief for eligible first home buyers · revenuesa.sa.gov.au
- State Revenue Office Tasmania — First Home Owner Grant applications and payments · sro.tas.gov.au
- Productivity Commission — housing affordability and deposit hurdle analysis · pc.gov.au
- ABS Census of Population and Housing 2021 · Australian Bureau of Statistics