


Updated
- $674per month
- Monthly essential household bills, excluding mortgage, up from $447 in 2015
- $244per month
- Monthly home and contents insurance, fastest-rising bill over 10 years
- $4,237per month
- Monthly repayment on average new owner-occupier loan, up from $2,416 in 2021
- −4.4%
- Real wage growth in 2022, the biggest annual fall in purchasing power on record
 Average rent in Australia 2026: rent by state and cityAustralian rent inflation eased to 3.8% year-on-year in February 2026, down from a peak of 7.8% in August 2023. The pace of rent growth has roughly halved over the past 30 months, although rents thems…
 Average grocery bill in Australia: what households spendThe average Australian household spends $178 a week on groceries in 2025, up from $168 in 2024 and $160 in 2023. Over three years, that is an $18 rise at the checkout, or roughly $936 more a year.
 Australian electricity costs 2026: average bills, prices and household spendingAustralian household electricity usage was valued at $23.9 billion in 2024–25, up from $11.674 billion in 2009–10. That represents an increase of around 105% in nominal terms over 15 years.
Section 01 · Monthly bills
Average household bills in Australia: what families pay each month
The average Australian household spent $674 a month on essential bills in 2025, covering electricity and gas, water, phone and internet, and home and contents insurance. That was 51% higher than in 2015, when the same bills cost $447 per month. For owner-occupiers with an average new mortgage, monthly repayments of about $4,237 lifted the combined monthly cost to about $4,911
| What Australians spend on bills each month | ||||
|---|---|---|---|---|
| Bill category | 2015 | 2020 | 2025 | Change since 2015 |
| Electricity and gas | $127 | $138 | $195 | +54% |
| Water | $70 | $90 | $110 | +57% |
| Phone and internet | $130 | $125 | $125 | −4% |
| Home and contents insurance | $120 | $161 | $244 | +103% |
| Total essential bills (excl. mortgage) | $447 | $514 | $674 | 51% higher than in 2015 |
What bills are included in the $674 monthly average?
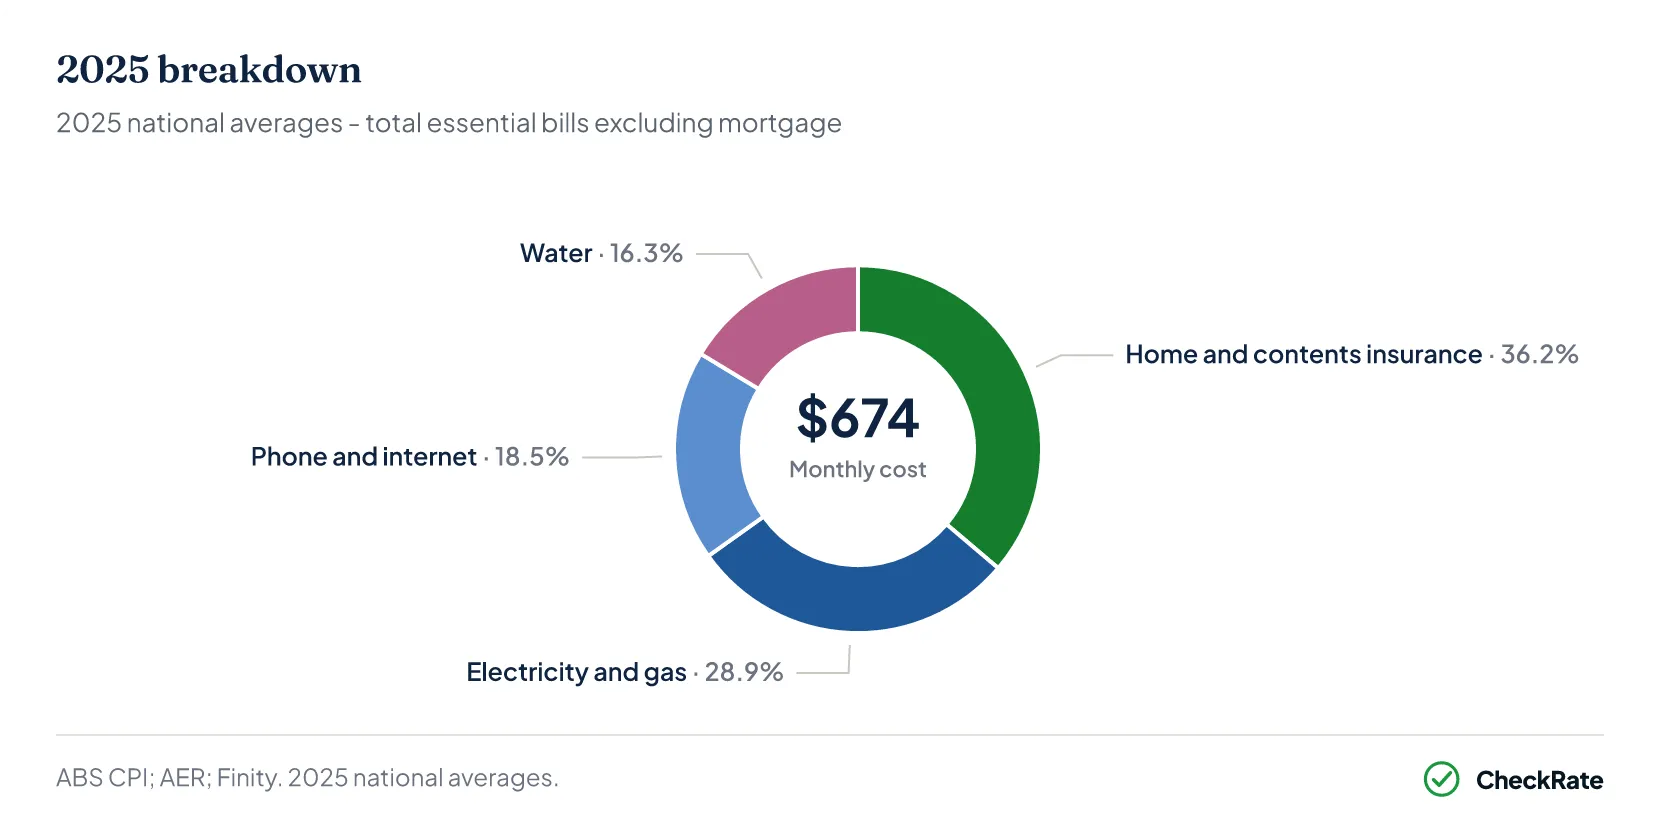
The $674 figure covers four categories: home and contents insurance ($244), electricity and gas ($195), phone and internet ($125), and water ($110). Mortgage repayments are excluded because they only apply to homeowners with a home loan. When estimated repayments of about $4,237 are added, the combined monthly total for mortgaged owner-occupiers reaches about $4,911.
Do these averages apply equally to renters and homeowners?
Energy, water, and phone and internet averages apply broadly to both renters and homeowners. The home and contents insurance figure reflects what property owners pay; renters with contents-only policies typically pay less. Mortgage repayments apply only to homeowners with an active home loan. Renters' largest housing cost is rent, which is not included in these figures.
Section 02 · Electricity and gas bills
Average energy bills fell to $195 a month in 2025
The average Australian household spent $195 per month on electricity and gas in 2025, down from a peak of $208 in 2024. The reduction partly reflected Commonwealth and state energy rebates, which reduced reported household electricity costs for eligible households.
Electricity prices later rose as earlier rebate effects were unwound or used up. ABS data showed electricity prices rising by 25.4% in the year to March 2026, but this figure reflected the changing effect of rebates as well as underlying retail prices.
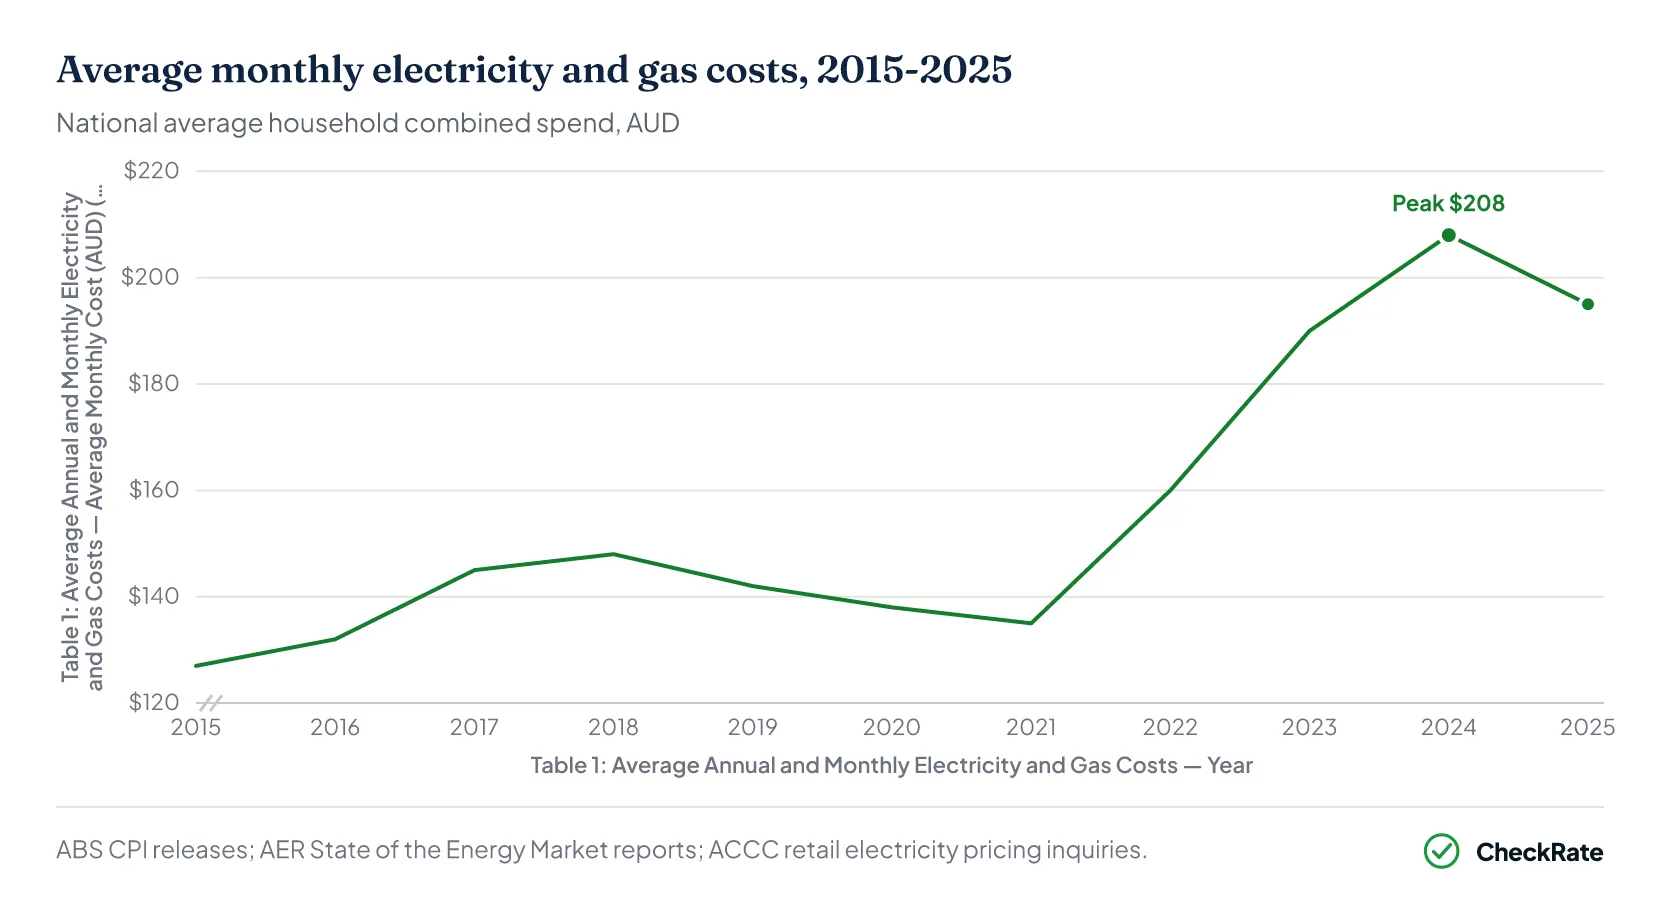
Bills climbed from $127 a month in 2015 to $145 in 2017, partly following the closure of the Hazelwood coal-fired power station in Victoria. That reduced electricity generation capacity and was followed by higher wholesale prices. At the time, the cost of maintaining power lines and infrastructure made up roughly 48% of a typical electricity bill, limiting how much retail price competition could affect household costs.
By 2021, average monthly costs had fallen to $135. A government price cap introduced in mid-2019, known as the Default Market Offer, limited the maximum rate energy retailers could charge customers who had not actively chosen a plan.
Average monthly energy bills then rose to $190 by 2023 and reached $208 in 2024, alongside higher global gas prices following Russia's invasion of Ukraine.
Australia's east coast gas market is linked to international prices. When global prices increased, local gas costs also rose. Because gas-fired power plants are often used to meet peak electricity demand, higher gas costs also contributed to higher electricity prices. Government rebate programmes contributed to the reported fall in household bills to $195 in 2025.
Bills vary noticeably between states. Queensland recorded the highest average quarterly electricity bills in 2024 and 2025, ranging from $432 to $499, partly reflecting high summer air-conditioning demand. Victoria's quarterly bills were generally lower, averaging around $368.
What caused the energy price spike in 2022 and 2023?
The main cause was rising global gas prices after Russia invaded Ukraine in February 2022. Australia's east coast gas prices are linked to international markets, so when global prices jumped, local costs followed. Gas-fired power plants are used heavily during peak demand periods, so higher gas costs also pushed electricity prices up. Bills climbed from $135 a month in 2021 to $208 by 2024 before government rebates reduced the reported cost.
Why did the reported energy bill fall in 2025 if wholesale prices are still high?
The fall from $208 in 2024 to $195 in 2025 reflects government rebates rather than lower underlying retail prices. The federal Energy Bill Relief Fund committed $3.5 billion for 2024 to 2025, providing eligible households with rebates of up to $300, supplemented by additional state schemes. Reported electricity prices later rose 25.4% in the year to March 2026, partly reflecting the unwinding of earlier rebate effects.
Section 03 · Water bills
Average water bill fixed service fees shape monthly costs
Average monthly water costs reached $110 in 2025, up 57% from $70 in 2015. Fixed service fees account for a large share of each quarterly invoice, which means lower household water use may not reduce the total bill by the same proportion.
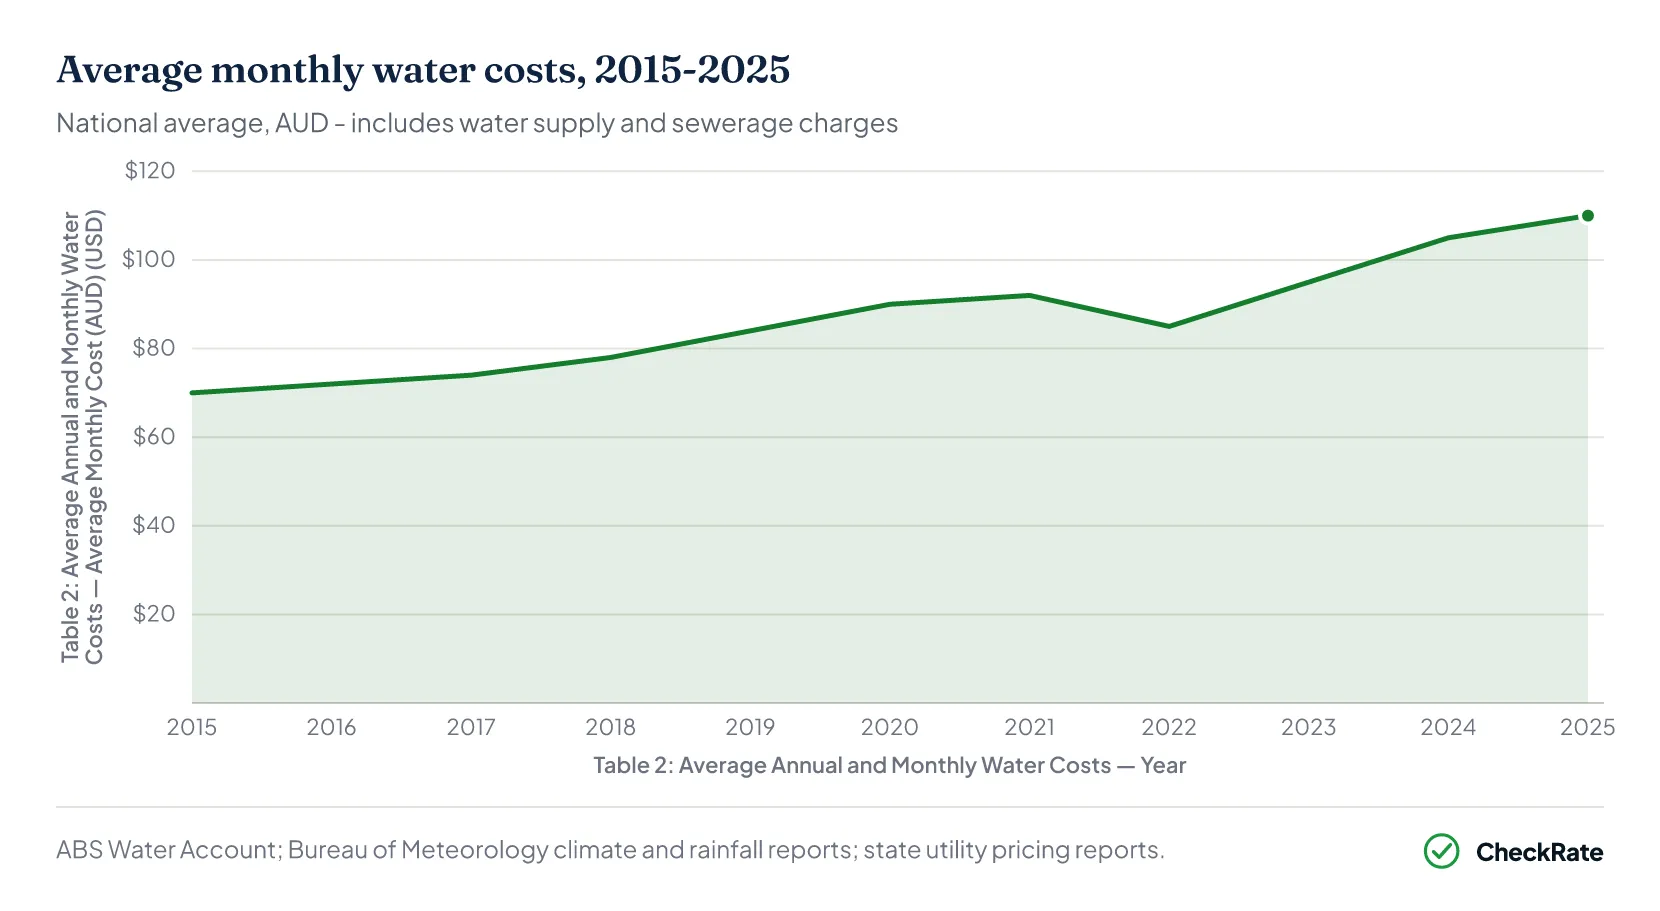
Bills rose fastest in 2018 and 2019, climbing from $78 to $84 a month. During this period, severe drought conditions reduced dam storage levels and increased reliance on desalination plants, which convert seawater into drinking water and are more expensive to operate. Those costs were reflected in higher household bills. Household water use also rose during periods of extreme heat, including additional garden watering.
Average monthly water bills dipped to $85 in 2022, following three consecutive wet years from 2020 to 2022. A weather pattern known as La Niña brought heavy rainfall across eastern Australia, which reduced garden watering needs and overall household water use.
As conditions returned to a warmer, drier pattern in 2023 and 2024, water use climbed back to 174 kilolitres per household. Combined with higher operating costs, including electricity costs for pumping and treatment, average bills reached $105 a month in 2024 and $110 in 2025.
Why do water bills vary between states?
Water pricing is set by state governments, regulators and water utilities, which means bills vary across the country. South East Queensland records some of the highest average bills nationally, with fixed sewerage and access charges accounting for a large share of the total. Western Australia has historically recorded lower average household water costs than many other states. Desalination infrastructure can also affect costs where it is used. These facilities are expensive to operate and maintain, and those costs can be reflected in customer bills over time.
How much of a water bill is affected by usage?
Only the usage-based portion of a water bill changes with household consumption. A large share of many water bills is made up of fixed service fees, which apply regardless of usage. Garden watering can affect the usage-based portion, which helps explain why average bills dipped in 2022 during a period of heavy rainfall.
Section 04 · Phone and internet bills
Average phone and internet bill remained stable
Phone and internet costs averaged $125 a month in 2025, compared with $130 in 2015. This makes phone and internet the only major household bill in this article to record a lower nominal monthly cost over the decade. After accounting for general price inflation, the real cost was lower than in 2015.
In the 12 months to March 2026, phone and internet prices rose by 1.4%, compared with headline inflation of 4.6%. While monthly costs have stayed close to their 2015 level, the service being purchased has changed. Internet speeds, mobile data allowances and overall data use have increased substantially over the decade. National data use reached approximately 13.9 million terabytes in the final three months of 2023.
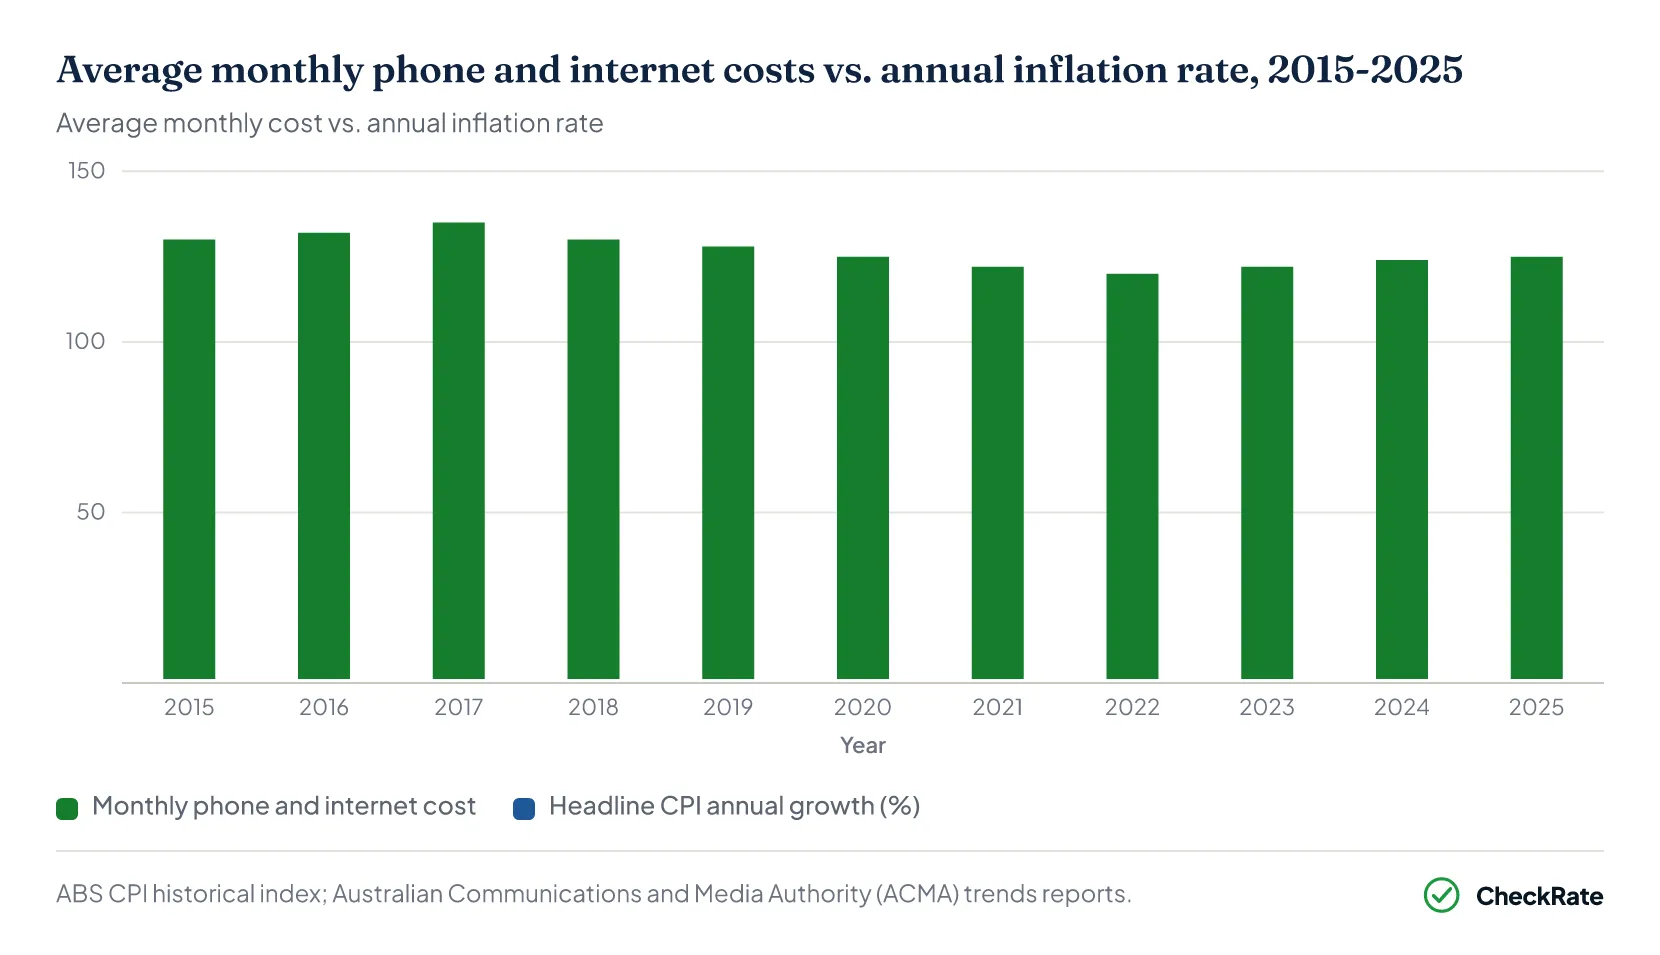
The relatively stable price trend may reflect competition across the telecommunications market. Smaller providers that rent network access from major carriers have added price pressure, particularly in mobile plans, where the cost of data has fallen as usage has increased.
Costs edged up slightly between 2015 and 2017 as the NBN rollout moved more households onto faster, higher-tier plans. By 2020, the COVID-19 pandemic had increased demand for reliable internet for work, healthcare appointments and schooling, but average monthly costs remained close to their earlier level.
Some price rises returned in 2024 and 2025 as major carriers increased rates on home internet and mobile plans, partly linked to 5G network investment. At $125 a month in 2025, phone and internet costs were still slightly below their 2015 level in nominal terms.
Why did phone and internet costs fall while every other bill rose?
Phone and internet costs fell from $130 a month in 2015 to $125 in 2025, a 4% decline over a decade when general prices rose by roughly 30%. One factor is the low marginal cost of carrying additional data once network infrastructure is in place. Smaller providers that rent network access from major carriers have also added price competition, particularly in mobile and internet plans. By comparison, energy, water and insurance are more directly linked to physical input costs, including fuel prices, infrastructure costs, building materials and climate-related risk, many of which increased over the same period.
Section 05 · Insurance premiums
Average home insurance bill reaches $244 a month
Home and contents insurance recorded the largest proportionate increase of any bill category over the decade. The average annual home and contents insurance premium reached $2,938 in 2025, equivalent to about $244 per month. This was 103% higher than in 2015 and 51% higher than in 2020, making insurance the fastest-rising bill category in this comparison.
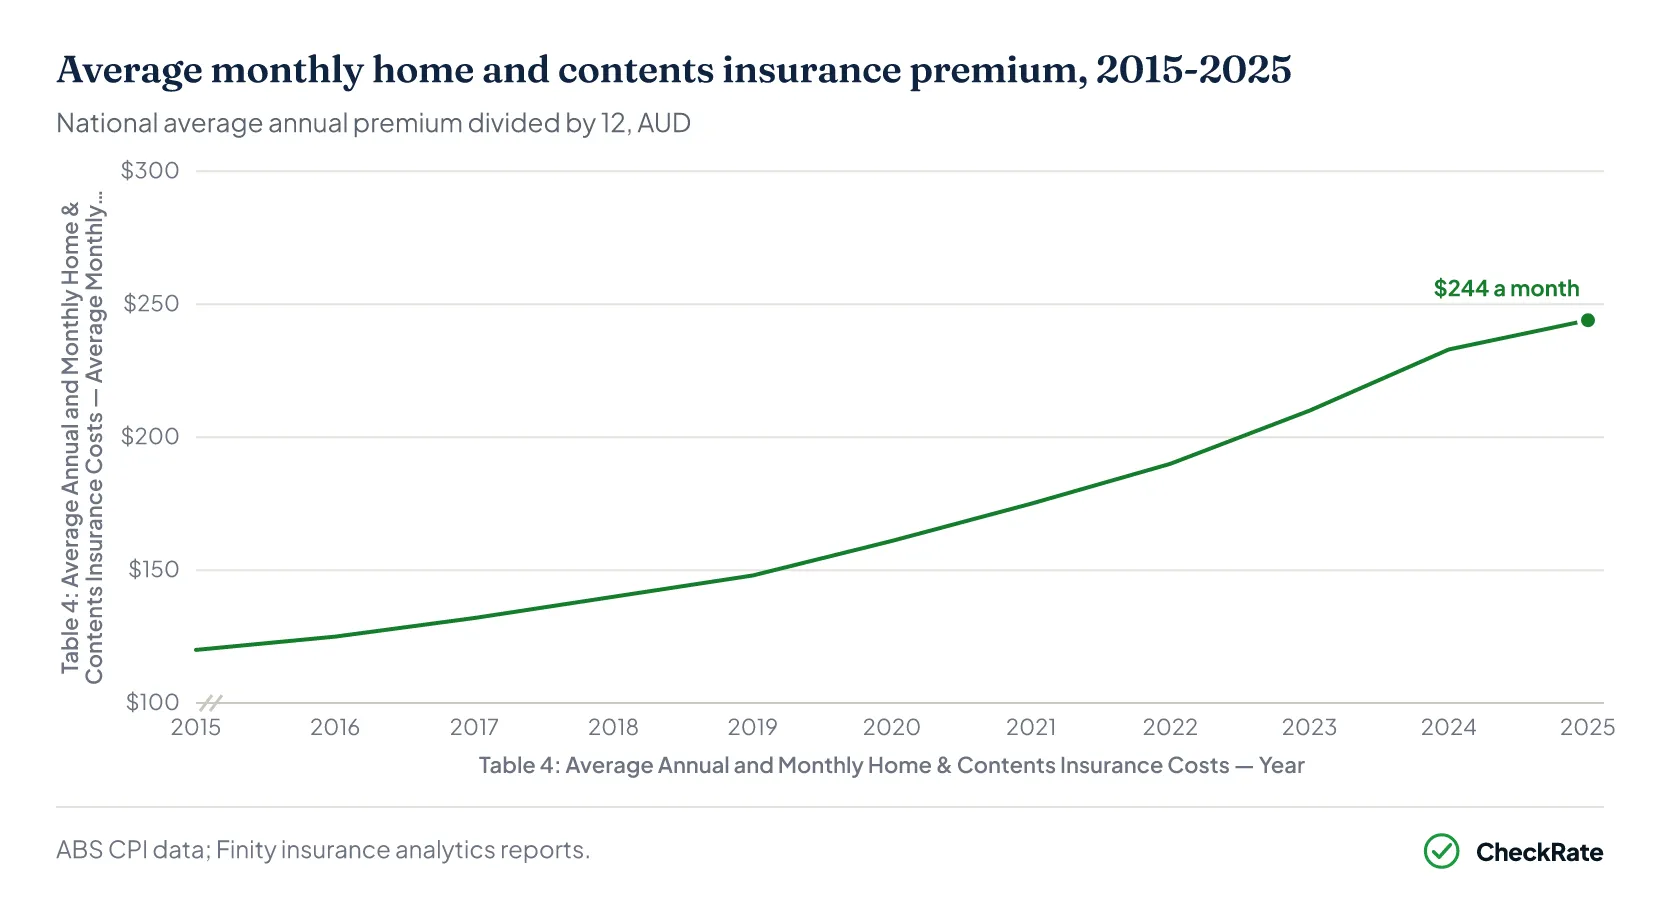
Premiums rose from $120 a month in 2015 to $161 by 2020, a 34% increase over five years. The Black Summer bushfires were followed by further premium increases, after destroying thousands of homes and generating billions of dollars in claims.
Major flooding across northern New South Wales and South East Queensland in 2021 and 2022 coincided with another rise, with the average monthly premium increasing from $175 to $190. These disasters were among the most costly in Australia's history and contributed to higher claims costs across the insurance sector. International reinsurers, which provide financial backing to insurance companies, also raised rates or reduced exposure in some higher-risk areas.
The average monthly premium reached $210 in 2023 and $233 in 2024, partly driven by rising building costs. Material and labour shortages during and after the COVID-19 pandemic made rebuilding homes more expensive. Because home insurance covers the full cost of rebuilding, higher construction costs flow directly into higher premiums.
Rising premiums have also been linked to underinsurance. Some households reduce their level of cover or cancel policies when premiums become less affordable. This can leave households with greater exposure to repair or rebuilding costs after major disasters.
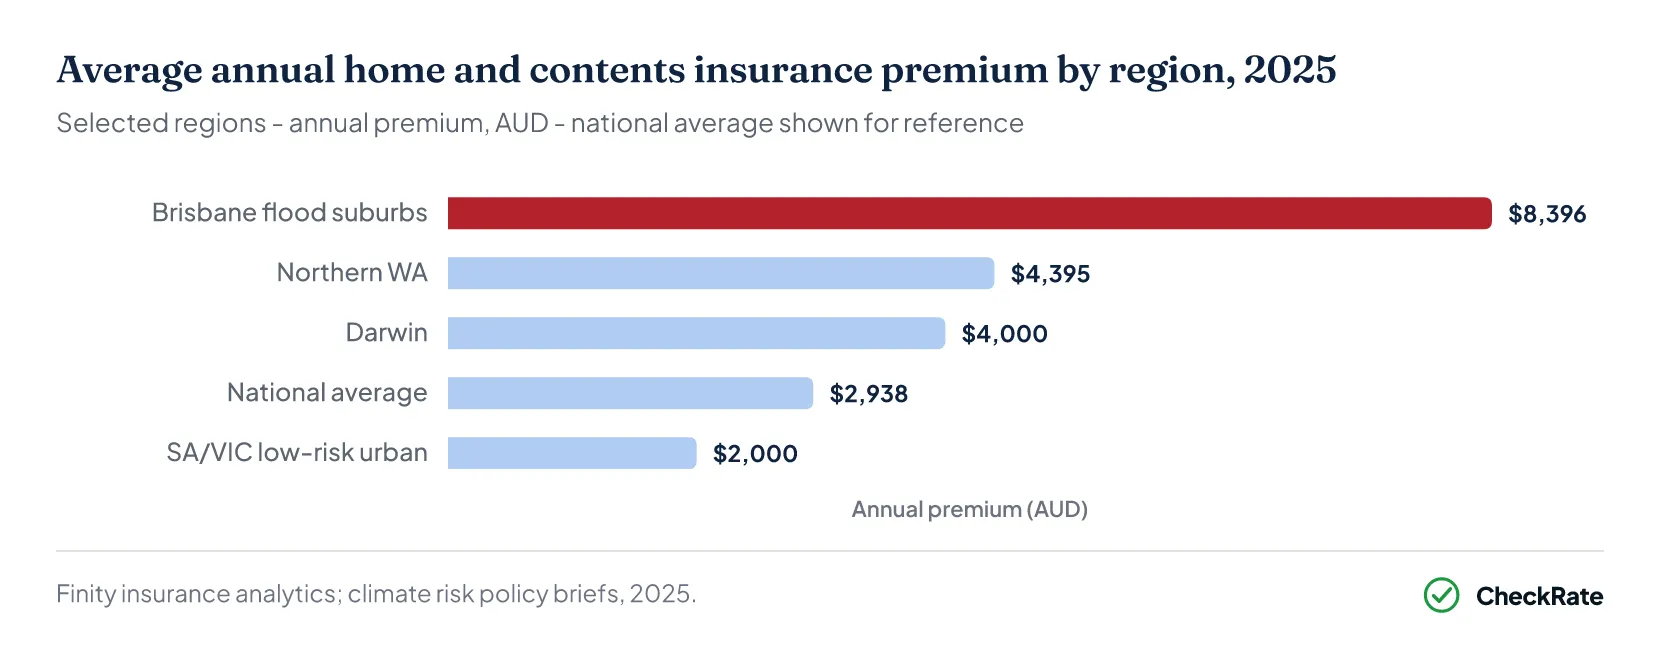
Why is insurance so much more expensive in Queensland and northern Australia?
These regions face a much higher risk of floods and cyclones than most other parts of Australia, which makes them more expensive to insure. The 2019 to 2020 bushfires and 2022 East Coast floods prompted global insurers to reassess Australian risk and raise their rates. For high-risk postcodes, that repricing was steep. In some high-risk areas, households may face substantially higher premiums, and some may reduce cover or go without insurance.
Section 06 · Debt repayments
Average new mortgage repayment increased after 2021
Estimated monthly repayments on the average new owner-occupier loan reached about $4,237 in 2025, up about 75% from $2,416 in 2021 and about 90% above the 2015 figure of $2,233. This figure applies only to owner-occupiers with a home loan and is separate from the $674 monthly average for other household bills.
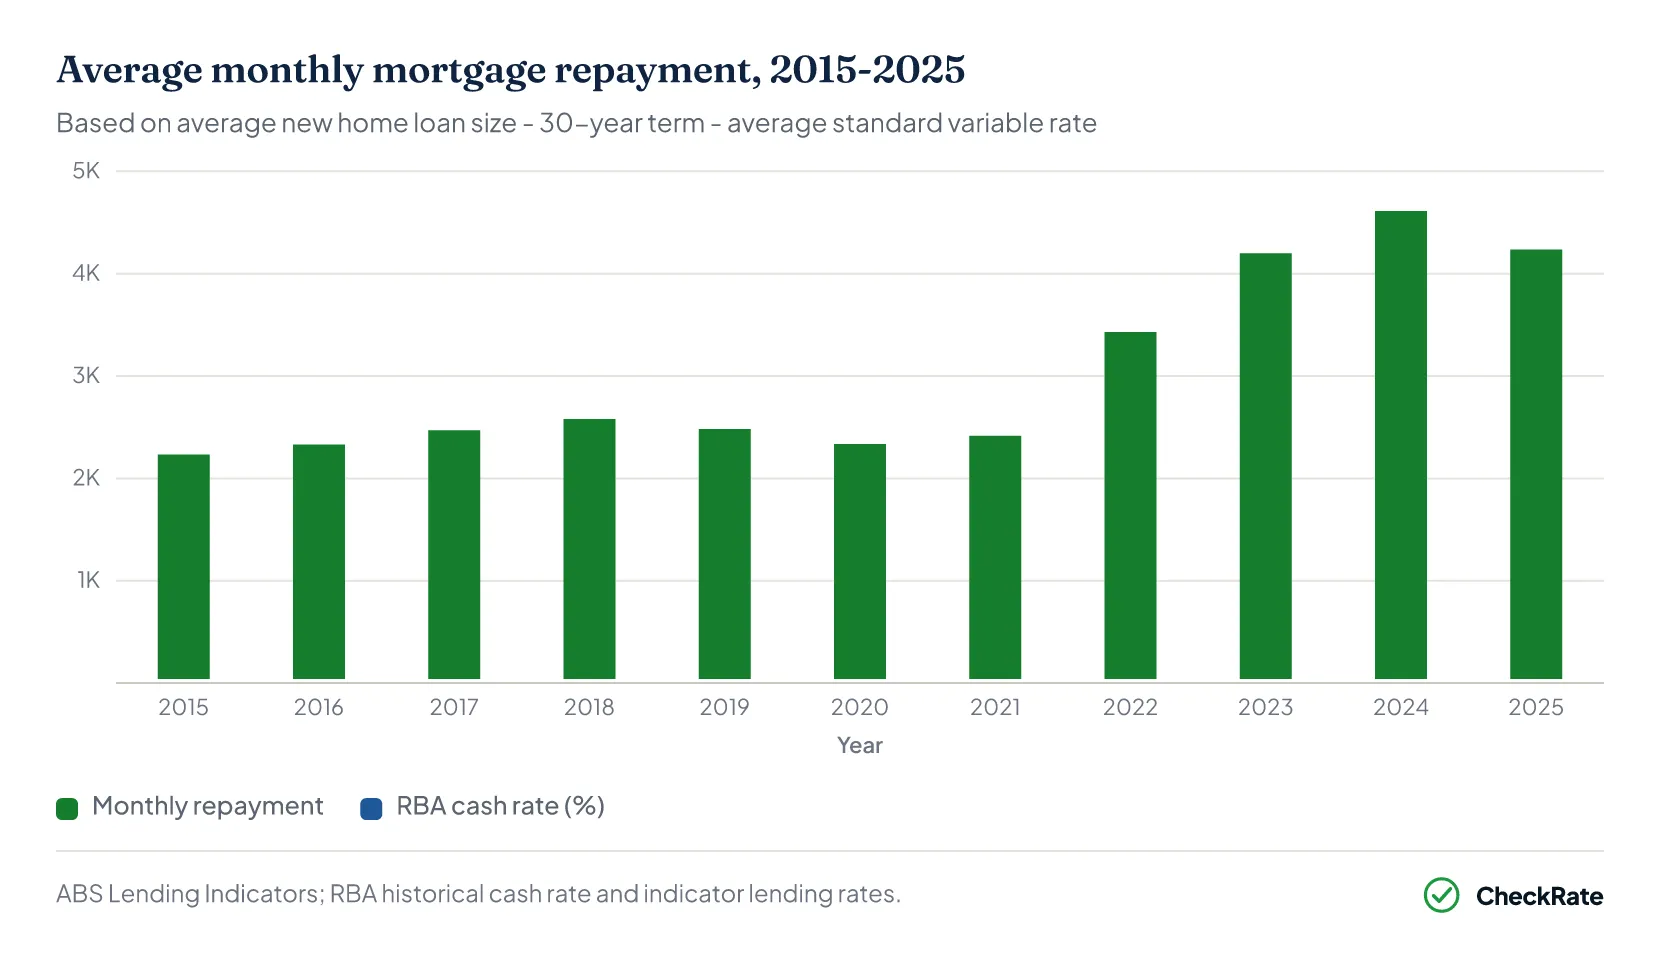
Monthly repayments started at $2,233 in 2015, reached $2,580 in 2018, then fell to $2,416 in 2021. This occurred even as average loan sizes increased from $389,000 to $600,000 over the same period. Repeated interest rate cuts, which brought the cash rate down to a record low of 0.10% by 2020, limited the increase in monthly repayments relative to loan size growth.
The cash rate, the key interest rate set by the Reserve Bank of Australia, rose from 0.10% to 3.10% during 2022, then reached 4.35% in late 2023. Home loan rates followed, reaching around 6.42% by 2024. The rate rises followed inflation reaching 7.8% by the end of 2022.
On an average loan of around $700,000, higher rates were associated with a sharp rise in monthly repayments. Average repayments increased from $2,416 in 2021 to $4,200 in 2023 and $4,613 in 2024. Many borrowers had fixed rates below 2% during the low-rate period and later moved onto higher variable rates in 2023 and 2024, concentrating the repayment increase over a short period.
Rate cuts in 2025 brought the cash rate down to 4.10%, and average monthly repayments fell to $4,237. At that level, repayments remained higher than any figure recorded before 2022.
| Average new owner-occupier loan size by state, 2025 | ||
|---|---|---|
| State | Average loan size | Monthly repayment (est.) |
| New South Wales | $873,000 | $5,030 |
| Victoria | $680,000 | $3,920 |
| Queensland | $680,000 | $3,920 |
| Western Australia | $600,000 | $3,457 |
| South Australia | $570,000 | $3,284 |
| Tasmania | $504,000 | $2,904 |
| National average | $736,000 | $4,237 |
Source · ABS Lending Indicators; RBA, 2025.
How are the average mortgage repayment figures calculated?
Each figure is based on the average new home loan for that year, repaid over 30 years at the prevailing average variable interest rate. Actual repayments vary depending on the interest rate, loan term, and whether extra repayments have been made. The figures are a national estimate for a standard new loan and will not match every individual's situation.
Why did mortgage repayments nearly double between 2021 and 2024?
Monthly repayments climbed from $2,416 in 2021 to $4,613 in 2024, a 91% increase in three years. Two things happened at once. The Reserve Bank raised the cash rate from a record low of 0.10% to a peak of 4.35% between 2022 and late 2023, one of the fastest rate-rise cycles on record. At the same time, average loan sizes had already grown to around $600,000 to $694,000 during the low-rate period. A larger loan at a much higher interest rate produces a much bigger monthly repayment.
Section 07 · Wages vs bill inflation, 2015–2025
Real wages fell as inflation outpaced pay growth
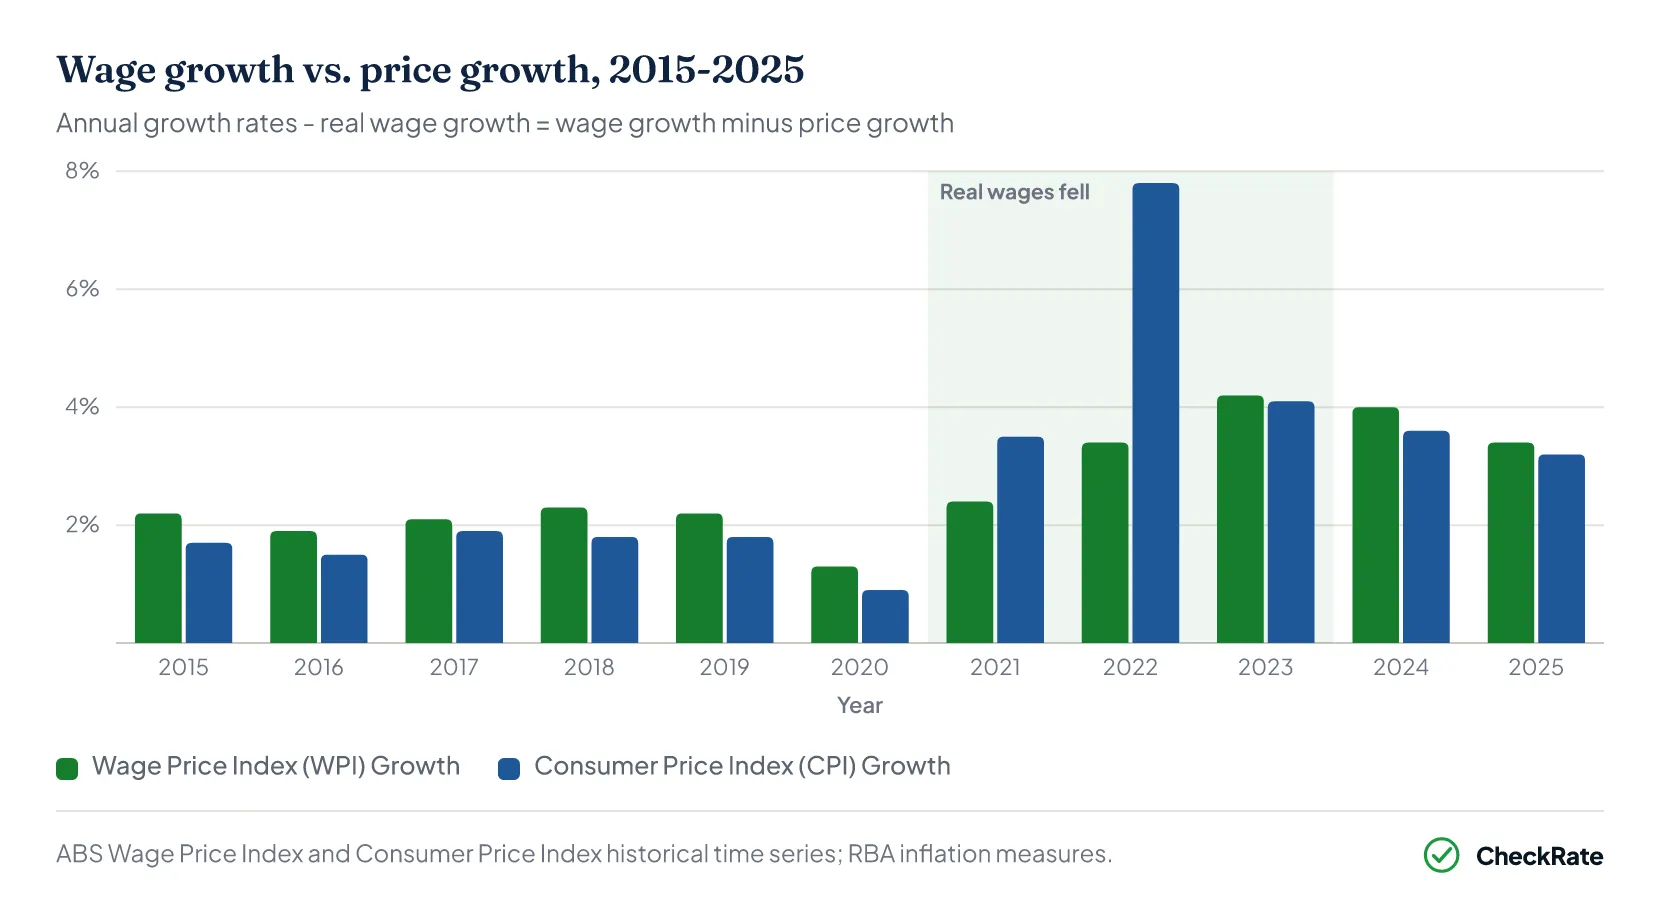
Real wages, which measure wage growth after inflation, fell by 4.4% in 2022. This was the largest annual fall in the available series. Prices rose by 7.8% that year, while wages grew by 3.4%. This means the same level of income bought less than it did a year earlier.
| Wage growth vs. price growth, 2015–2025 | |||
|---|---|---|---|
| Year | WPI growth | CPI growth | Real wage growth |
| 2015 | 2.2% | 1.7% | +0.5% |
| 2016 | 1.9% | 1.5% | +0.4% |
| 2017 | 2.1% | 1.9% | +0.2% |
| 2018 | 2.3% | 1.8% | +0.5% |
| 2019 | 2.2% | 1.8% | +0.4% |
| 2020 | 1.3% | 0.9% | +0.4% |
| 2021 | 2.4% | 3.5% | −1.1% |
| 2022 | 3.4% | 7.8% | −4.4% |
| 2023 | 4.2% | 4.1% | +0.1% |
| 2024 | 4.0% | 3.6% | +0.4% |
| 2025 | 3.4% | 3.2% | +0.2% |
Source · ABS Wage Price Index and Consumer Price Index historical time series; RBA inflation measures.
Wages grew by 2.4% in 2021 as prices began to rise, and by 3.4% in 2022 when prices rose by 7.8%. Australian wages are set through a mix of enterprise agreements, individual arrangements and annual wage decisions. These processes can respond more slowly than sudden price increases, which means wage growth may lag inflation during periods of rapid price change.
The 2021 to 2023 period had a larger effect on lower-income households, because essential bills such as utilities, insurance and housing take up a larger share of income. When those costs rise faster than wages, lower-income households have less room to absorb the increase.
Wages grew by 4.2% in 2023, slightly above price growth of 4.1%. Real wage growth then remained positive but small, at +0.1% in 2023, +0.4% in 2024 and +0.2% in 2025.
These gains did not fully reverse the earlier decline. Essential bills reached $674 a month in 2025, compared with $447 in 2015, meaning essential costs accounted for a larger share of household income than earlier in the decade.
What does “real wage growth” mean for household budgets?
In 2022, prices rose 7.8% while wages grew just 3.4%, producing a real wage fall of 4.4%. That means the average Australian worker's income bought less than the year before. Real wage growth simply measures how wages are growing compared to prices. When wages grow faster than prices, people can afford more with the same income. When prices grow faster than wages, the same pay buys less.
Are wages now keeping up with the cost of household bills?
Marginally. Wages returned to growing slightly faster than prices in 2023 (+0.1%), 2024 (+0.4%) and 2025 (+0.2%). However, essential bills remain well above their level before the 2021 to 2023 price surge. The 51% increase in non-mortgage bills since 2015 has not been reversed. Slightly positive real wage growth means the gap is no longer widening at the same pace, but it does not automatically reduce the higher bill base already reached.
Section 08 · Explore the data
Bills at a glance
Three views of the same data: year explorer, 2025 breakdown, and bill estimator. All figures are monthly averages in AUD. Mortgage repayments excluded.
| Year explorer — bill averages by year, 2015–2025 | |||||
|---|---|---|---|---|---|
| Year | Insurance | Energy | Phone & internet | Water | Total (excl. mortgage) |
| 2015 | $120 | $127 | $130 | $70 | $447 |
| 2016 | $125 | $132 | $132 | $72 | $461 |
| 2017 | $132 | $145 | $135 | $74 | $486 |
| 2018 | $140 | $148 | $130 | $78 | $496 |
| 2019 | $148 | $142 | $128 | $84 | $502 |
| 2020 | $161 | $138 | $125 | $90 | $514 |
| 2021 | $175 | $135 | $122 | $92 | $524 |
| 2022 | $190 | $160 | $120 | $85 | $555 |
| 2023 | $210 | $190 | $122 | $95 | $617 |
| 2024 | $233 | $208 | $124 | $105 | $670 |
| 2025 | $244 | $195 | $125 | $110 | $674 |
Household bills calculator
Add up your regular household bills and see how the monthly total compares with the national average.
References
- ABS, Consumer Price Index, Australia — December quarter 2025 · Australian Bureau of Statistics
- ABS, Consumer Price Index, Australia, March 2026 · Australian Bureau of Statistics
- ABS Lending Indicators, December quarter 2025 · Australian Bureau of Statistics
- ABS, Wage Price Index, Australia — December quarter 2025 · Australian Bureau of Statistics
- ABS, Water Account, Australia — 2023-24 · Australian Bureau of Statistics
- RBA, Lenders' Interest Rates (Statistical Table F6) — housing rates, February 2026 · Reserve Bank of Australia
- AER, State of the Energy Market 2025 · Australian Energy Regulator
- ACCC, Inquiry into the National Electricity Market — December 2025 report · accc.gov.au
- Bureau of Meteorology, Annual Climate Statement 2019 · bom.gov.au
- Bureau of Meteorology, ENSO climate history · bom.gov.au
- Finity Consulting, home insurance premium data 2020-2025 · finity.com.au
- ACMA, Communications and media in Australia — telecommunications trends 2023-24 · acma.gov.au