


Published
Section 01 · July 2026
What is the average term deposit rate in Australia?
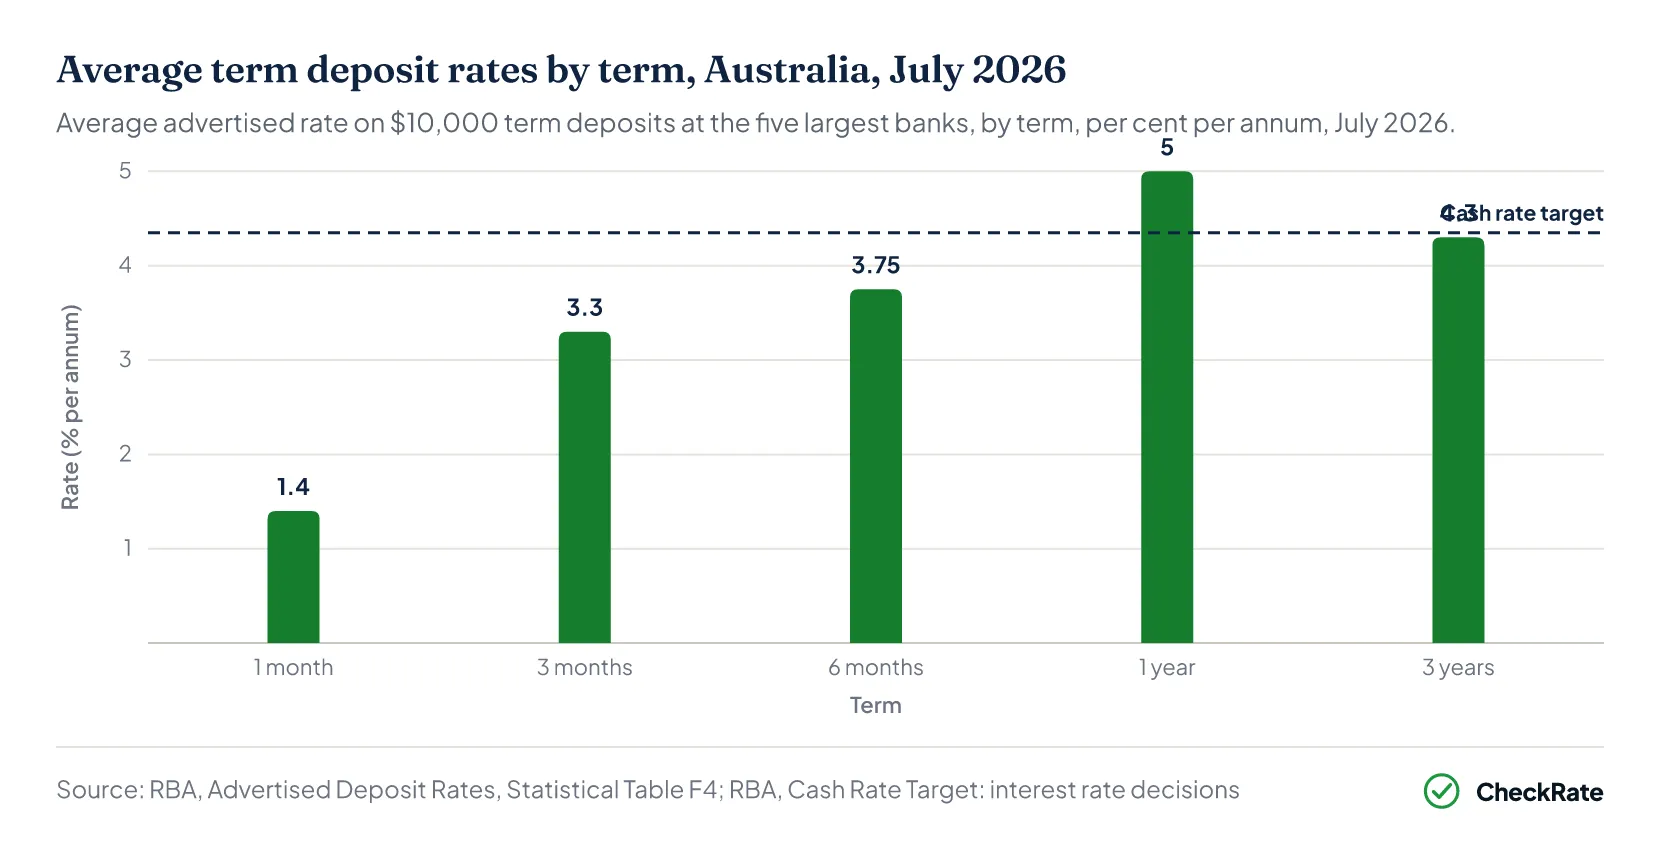
The Reserve Bank publishes monthly averages of the five largest banks' term deposit rates for a $10,000 deposit. In July 2026, the average across all terms was 3.60 per cent1. The five published terms averaged 1.40 per cent for 1 month, 3.30 per cent for 3 months, 3.75 per cent for 6 months, 5.00 per cent for 1 year and 4.30 per cent for 3 years.
The all-terms average covers every term the five banks offer, not only the five published terms, so it is not the simple mean of the five published figures.
The July 2026 all-terms average of 3.60 per cent matched the level recorded from July 2023 to February 2024. No month since September 2012, when the average was 3.70 per cent, has recorded a higher value. The comparison is derived from every month in the series1. The 1-year average reached 5.05 per cent in May and June 2026, its highest since 5.10 per cent in April 2012. Its July 2026 value of 5.00 per cent exceeded every month between those two dates.
These are averages of the five largest banks' standard rates, not the highest rates on offer in the market, and rates can differ for other deposit sizes.
How the term deposit averages compare with the savings account averages in the same table is covered in the savings account rates article.
| Average term deposit rates by term, Australia, July 2026 | |
|---|---|
| Term | Average rate (% p.a.) |
| 1 month | 1.40 |
| 3 months | 3.30 |
| 6 months | 3.75 |
| 1 year | 5.00 |
| 3 years | 4.30 |
| Average rate, all terms | 3.60 |
Source · RBA, Advertised Deposit Rates, Statistical Table F4
Section 02 · By term
Which term deposit length has the highest average rate?
The 1-year average has been the sole highest of the five published terms in every month from March 2023 to July 2026, a run of 41 months, based on a comparison of the five terms in each month1. That ordering has been unusual over the full period. Across the 532 months from April 1982, the first month with all five terms published, the 1-year average was the highest or equal highest in 144. Over the same 41 months, the 3-year average has been below the 1-year average; across the full 532 months, that was the case in 179.
The 1-month average has been the lowest of the five published terms in almost every month. It was the lowest or equal lowest in 510 of the 532 months, and has been the sole lowest in every month since May 20221. The gap between the 1-year and 1-month averages was 3.60 percentage points in July 2026, derived by subtraction. The widest gap between the two averages was 5.35 percentage points, in July 2008, when the 1-year average was 8.25 per cent and the 1-month average 2.90 per cent.
Why can term deposit rates differ by term?
The ACCC's retail deposits inquiry cited an Australian Banking Association submission that longer terms nearly always offered higher rates.2 However, term deposit rates do not always increase with term length, depending on a bank's funding requirements and the market's expectations for future interest rates.
The inquiry also described term deposit specials, which offer higher rates for specific terms such as 7 or 18 months to meet a bank's funding needs.2 It reported that a bank generally offers only one or two specials at a time, and that larger deposits are generally offered higher rates. The RBA averages record the five largest banks' standard rates for each published term, so a special offered for an unlisted term is not included in the five published series.
Section 03 · Cash rate
How do term deposit rates move with the RBA cash rate?
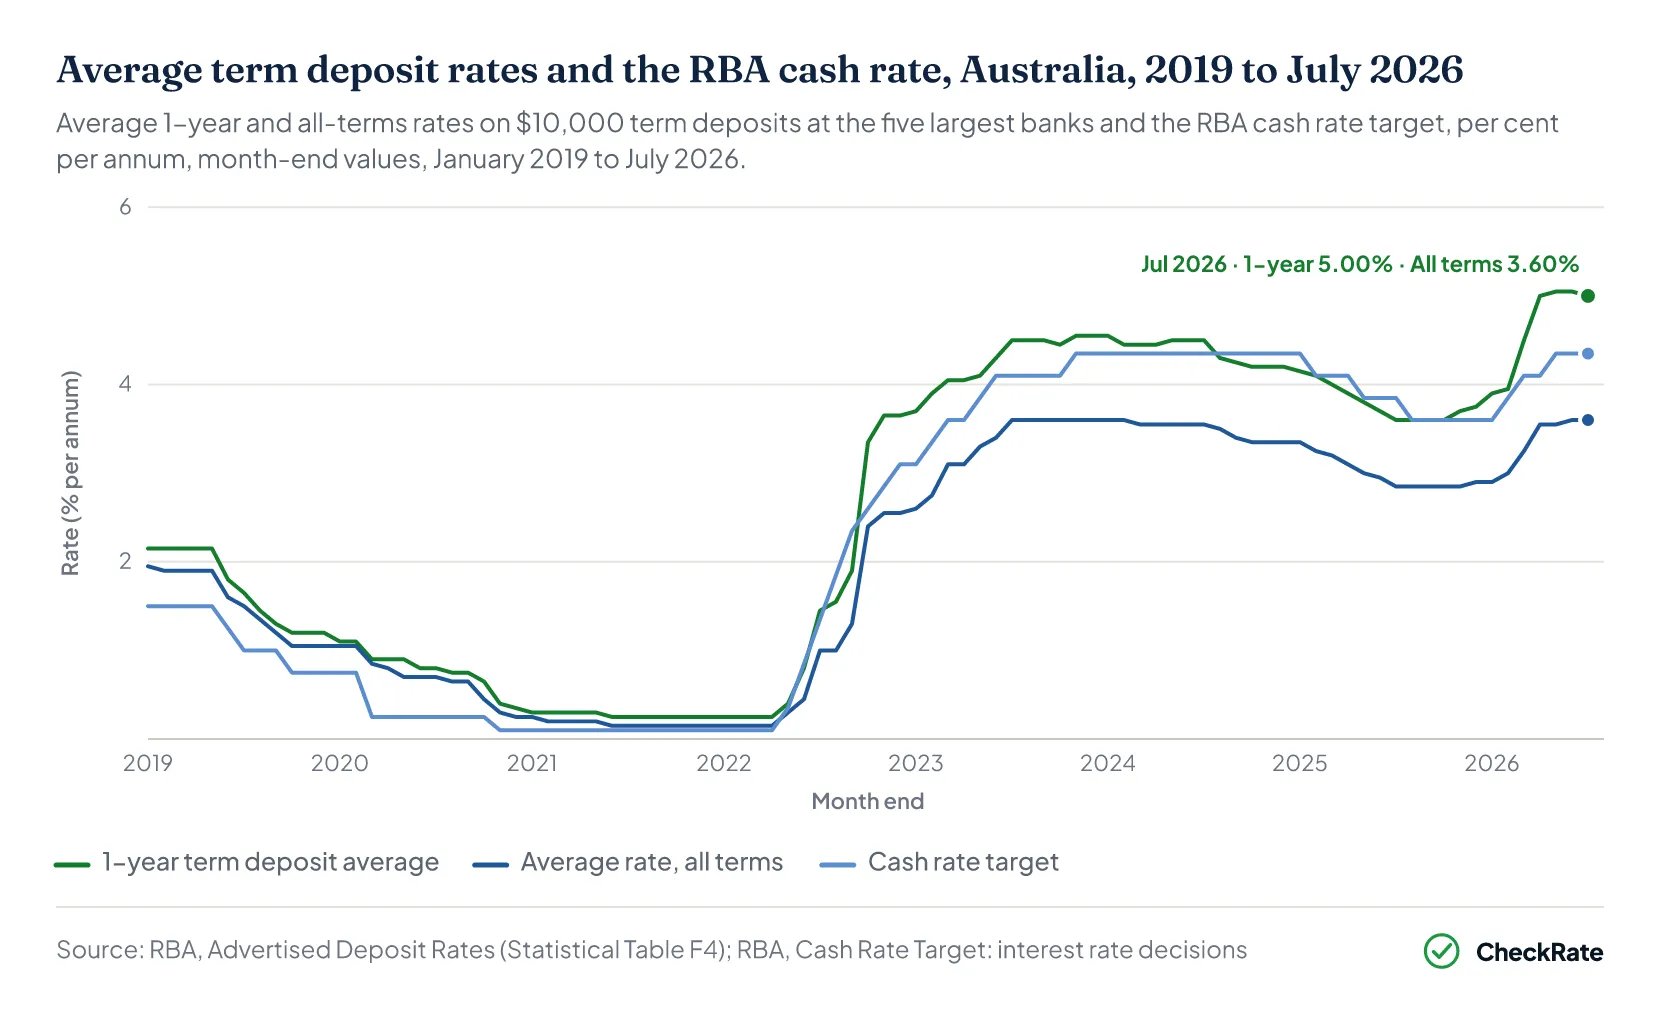
Term deposit averages have moved in the same direction as the cash rate in each cycle since 2022, but not by the same amount. The cash rate target is 4.35 per cent as at 24 August 2026, after three 0.25 percentage point increases took effect between February and May 2026 and the Monetary Policy Board held the target at its June and August meetings3. At the end of July 2026, the 1-year term deposit average of 5.00 per cent was 0.65 points above the cash rate, while the all-terms average of 3.60 per cent was 0.75 points below it. Both differences are derived by subtraction1.
Across the 13 increases of 2022 and 2023, the cash rate rose by 4.25 percentage points, from 0.10 per cent at the end of April 2022 to 4.35 per cent at the end of November 2023. Over the same period, the 1-year average rose from 0.25 to 4.55 per cent, an increase of 4.30 points, while the all-terms average rose by 3.45 points, from 0.15 to 3.60 per cent1.
The later cycles were smaller. Across the three cuts of 2025, measured from the end of January 2025 to the end of January 2026, the 1-year average fell by 0.25 percentage points, compared with a 0.75 point fall in the cash rate1. Across the three increases of 2026, measured from the end of January 2026 to the end of July 2026, the 1-year average rose by 1.10 points compared with a 0.75 point rise in the cash rate.
When has the all-terms average been above or below the cash rate?
Over the longer term, the all-terms average was at or above the month-end cash rate in 131 of the 294 months from February 2002, when the all-terms average begins, to July 2026. Those months fell into two stretches: June 2009 to April 2010, 11 months, and May 2012 to April 2022, 120 consecutive months1. Since May 2022, the all-terms average has been below the cash rate in every month, a run of 51 months to July 2026.
The full list of cash rate decisions behind these windows is in the RBA cash rate history.
| Cash rate cycles and term deposit averages, Australia, 2022 to 2026 | |||
|---|---|---|---|
| Window (month-end to month-end) | Cash rate (points) | 1-year average (points) | All-terms average (points) |
| April 2022 to November 2023 (13 increases) | +4.25 | +4.30 | +3.45 |
| January 2025 to January 2026 (3 cuts) | −0.75 | −0.25 | −0.45 |
| January 2026 to July 2026 (3 increases) | +0.75 | +1.10 | +0.70 |
Source · RBA, Advertised Deposit Rates (Statistical Table F4); RBA, Cash Rate Target: interest rate decisions
Section 04 · At maturity
What happens when a term deposit matures?
Most term deposits in the bank data reported by the ACCC were rolled over at maturity. Approximately 90 to 94 per cent of term deposits that matured in January 2022 were rolled over2, while 14 per cent of respondents with a term deposit in the ACCC's 2023 consumer survey switched to a different bank at maturity.
A term deposit pays a rate that is guaranteed not to change for the length of its term, provided the funds are not withdrawn before maturity2. Withdrawing early can incur a cost. Some banks charge a fixed fee or reduce the interest that would otherwise have been earned, depending on the remaining length of the term. Some accounts also require advance notice before an early withdrawal.
The ACCC identified customers' ability to switch banks at maturity as a source of competitive pressure on deposit pricing, while noting that parts of the switching process remained challenging2.
Early to mid 2022, some banks offered targeted interest rates for new and renewing term deposits, or for consumers who had previously held a term deposit and likely moved the funds to another bank.2 From mid 2022 to mid 2023, banks appeared to make increasing use of targeted offers alongside advertised term deposit specials to retain consumers.
Section 05 · Since 1981
How have term deposit rates changed since 1981?
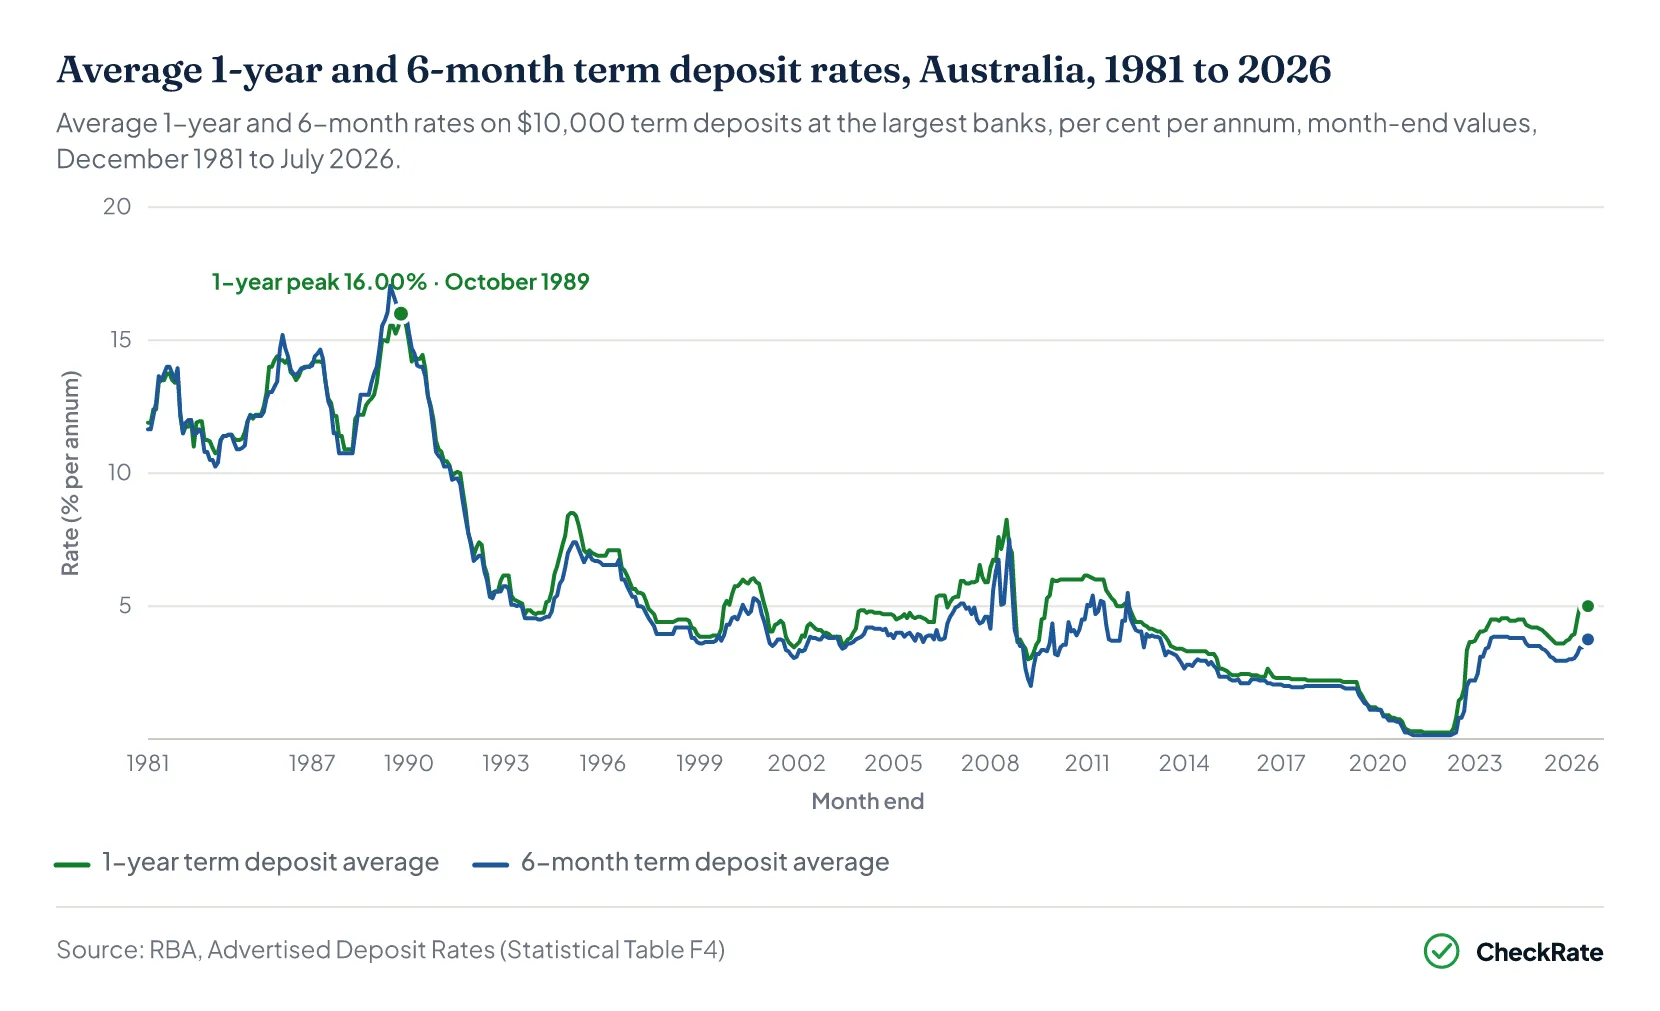
At the end of December 1981, when the 3-month, 6-month and 1-year series began, the 3-month and 6-month averages were 11.65 per cent and the 1-year average was 11.90 per cent. The 1-month and 3-year series began in April 19821. Every term's record high was recorded in 1989. The 3-month average reached 17.25 per cent in October and December 1989, the 6-month average reached 17.05 per cent in June 1989, and the 1-year average reached 16.00 per cent in October 1989. The averages then declined through the 1990s. By December 1999, the 1-year average was 5.05 per cent.
The all-terms average began in February 2002 at 3.45 per cent and reached its record high of 5.25 per cent in September 2008. The 1-year average reached its highest level of the 2000s at 8.25 per cent in July 20081.
The record lows occurred while the cash rate target stood at 0.10 per cent. The all-terms average held at 0.15 per cent and the 1-year average at 0.25 per cent, both from June 2021 to April 20221.
After the cash rate increases of 2022 and 2023, the 1-year average reached 4.55 per cent, where it remained from November 2023 to January 2024, while the all-terms average held at 3.60 per cent from July 2023 to February 20241. Both declined through 2025. Following the three increases of 2026, the 1-year average reached 5.05 per cent in May and June 2026, its highest since April 2012, and the all-terms average reached 3.60 per cent in June and July 2026.
| Term deposit average rate records, Australia, 1981 to 2026 | ||
|---|---|---|
| Record | Rate | Month |
| Highest 3-month average | 17.25% | October and December 1989 |
| Highest 6-month average | 17.05% | June 1989 |
| Highest 1-year average | 16.00% | October 1989 |
| Highest all-terms average | 5.25% | September 2008 |
| Lowest 1-year average | 0.25% | June 2021 to April 2022 |
| Lowest all-terms average | 0.15% | June 2021 to April 2022 |
Source · RBA, Advertised Deposit Rates (Statistical Table F4)
Key milestones in Australian term deposit rates, 1981 to 2026
December 1981
The RBA's term deposit series began, with the 3-month and 6-month averages at 11.65 per cent and the 1-year average at 11.90 per cent.
October 1989
The 1-year average peaked at 16.00 per cent. The 3-month average reached 17.25 per cent, a level it matched again in December 1989, the highest value recorded across the five published terms.
September 2008
The all-terms average, published since February 2002, peaked at 5.25 per cent.
June 2021 to April 2022
The all-terms average held at its record low of 0.15 per cent and the 1-year average at its record low of 0.25 per cent while the cash rate target stood at 0.10 per cent.
November 2023
After the 13 cash rate increases of 2022 and 2023, the 1-year average reached 4.55 per cent, where it remained until January 2024.
May and June 2026
The 1-year average reached 5.05 per cent, its highest since April 2012, after the three cash rate increases between February and May 2026.
July 2026
The 1-year average was 5.00 per cent and the all-terms average was 3.60 per cent, the all-terms average's equal highest since September 2012.
Source · RBA, Advertised Deposit Rates (Statistical Table F4); RBA, Cash Rate Target: interest rate decisions
Section 06
Term deposit rates: quick answers
What is the average term deposit rate in Australia?
The average rate on a $10,000 term deposit across all terms at the five largest banks was 3.60 per cent in July 2026, according to the Reserve Bank of Australia's Advertised Deposit Rates data. By term, the averages were 1.40 per cent for 1 month, 3.30 per cent for 3 months, 3.75 per cent for 6 months, 5.00 per cent for 1 year and 4.30 per cent for 3 years.
Which term deposit term has the highest rate?
The 1-year term had the highest average rate among the five published terms the Reserve Bank of Australia publishes, at 5.00 per cent in July 2026 for a $10,000 deposit at the five largest banks. The 1-year average has been the highest of the five published terms in every month since March 2023. The 1-month term had the lowest average, at 1.40 per cent.
What was the highest term deposit rate in Australia?
The highest value across the Reserve Bank of Australia's five published term deposit series is 17.25 per cent, recorded by the 3-month average in October and December 1989. The 6-month average peaked at 17.05 per cent in June 1989 and the 1-year average at 16.00 per cent in October 1989. These are averages of the largest banks' rates for a $10,000 deposit, not the highest single rate on offer.
Are term deposit rates higher than savings account rates?
In July 2026, the average 1-year term deposit rate at the five largest banks, 5.00 per cent, was above both the average bonus savings rate of 4.80 per cent, which assumes bonus conditions are met, and the average online savings rate of 3.10 per cent. The average term deposit rate across all terms, 3.60 per cent, was between the two savings averages. All figures are Reserve Bank of Australia averages for a $10,000 balance.
Do term deposit rates follow the RBA cash rate?
Term deposit averages have moved in the same direction as the cash rate in each cycle since 2022, but by different amounts. Between April 2022 and November 2023, the cash rate target rose by 4.25 percentage points, the 1-year term deposit average 4.30 points and the all-terms average by 3.45 points. The all-terms average has been below the cash rate in every month from May 2022 to July 2026; from May 2012 to April 2022, it was at or above the cash rate for 120 consecutive months.
Do term deposits roll over automatically at maturity?
Most term deposits were rolled over at maturity in the period the Australian Competition and Consumer Commission (ACCC) examined. In bank data reported by the ACCC, approximately 90 to 94 per cent of term deposits that matured in January 2022 were rolled over. In the inquiry's consumer survey, 14 per cent of respondents with a term deposit switched to a different bank at maturity.