


Updated
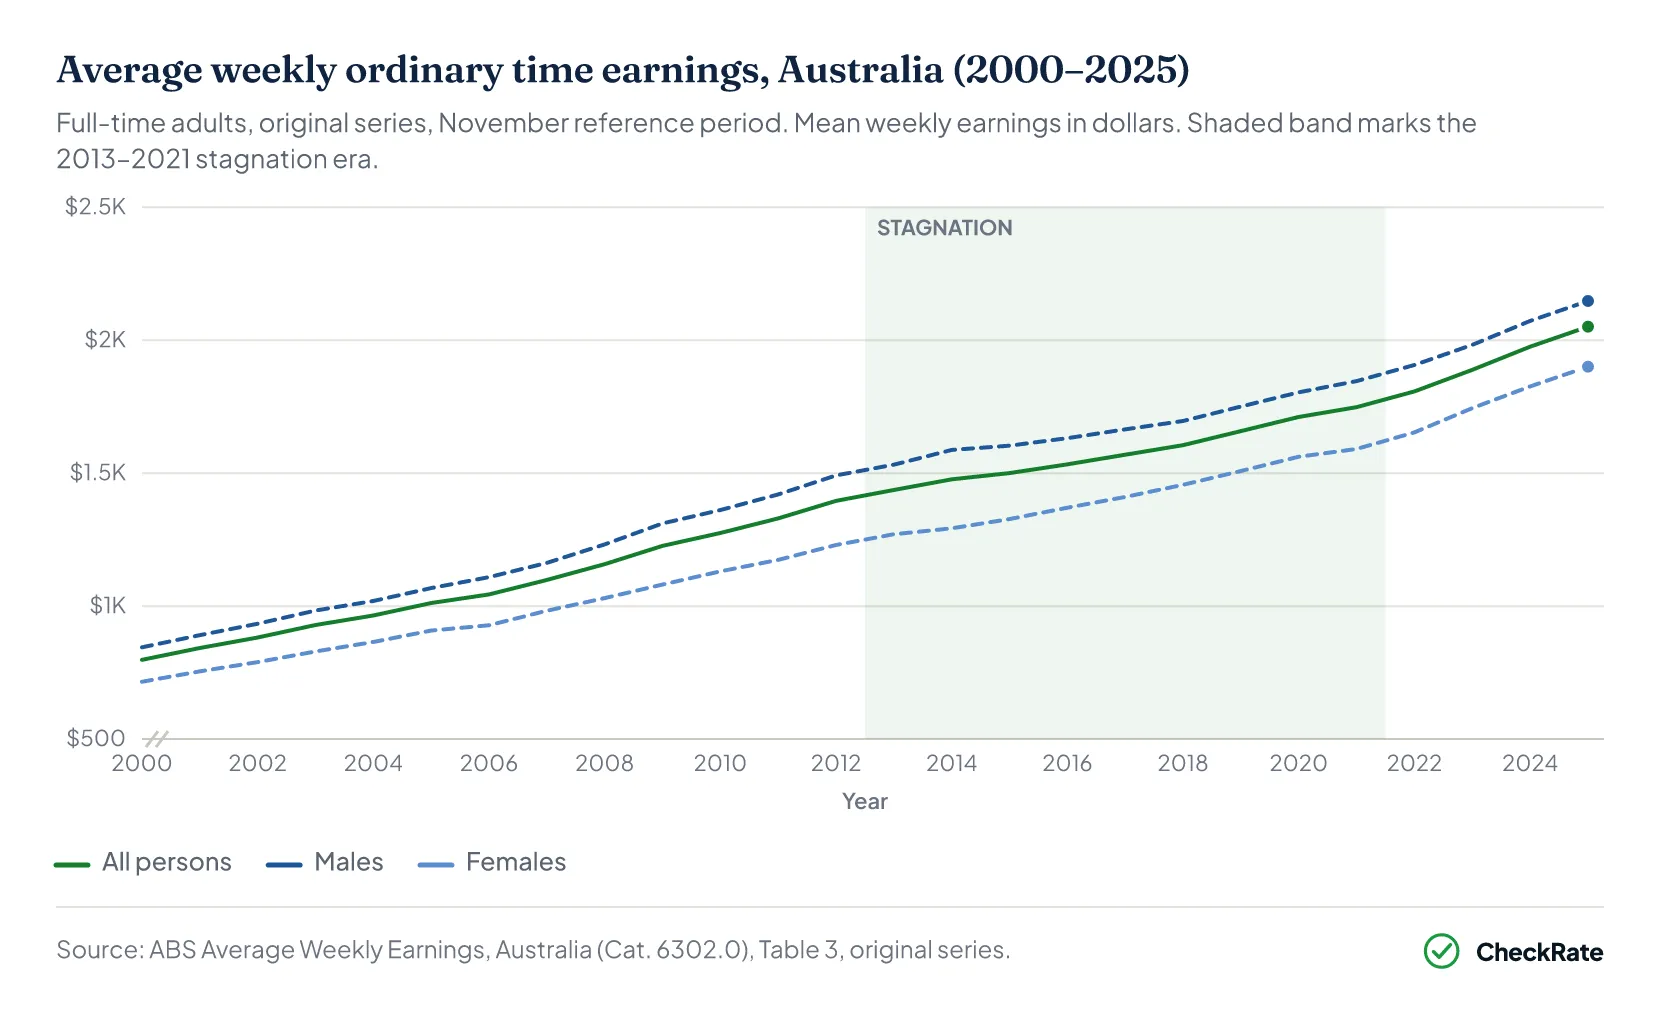
The average full-time Australian worker earned $2,051.10 a week in ordinary-time wages in November 2025, equal to $106,657 a year. That was 157% higher than in November 2000, when the same measure was $798.10 a week. In cash terms, full-time wages have more than doubled over 25 years.
Estimated real household income in 2026 sits roughly near its 2018 level, based on WPI and CPI movements rather than direct household income survey observations. After inflation, the gains from higher wages look much smaller. Much of the improvement built up through the 2010s was squeezed during the recent inflation surge, particularly in 2022, when consumer prices rose by 7.8% while wages increased by only 3.4%.
- Average weekly earnings (OTE)
- $2,051
- Full-time adults, November 2025
- Median weekly earnings
- $1,887
- All full-time workers, total earnings, May 2025
- Nominal wage growth since November 2000
- 157%
- Full-time ordinary time earnings
- Real wage decline in 2022
- −4.4%
- Largest single-year contraction in the available series
 Australian wealth statistics: net worth, assets and the wealth gapThat gap is not new. When both figures were last measured together in 2019–20, average household net worth was $1.04 million, while the median was $579,200. By 2024, the average had risen to $1.58 mil…
 Average salary in Australia 2026: wages, median pay and weekly earningsThe average full-time adult worker in Australia earned $2,051.10 per week in base pay, known as ordinary time earnings, as at November 2025. That is equal to $106,657 per year. This is the most widely…
 Income distribution in Australia: what each income percentile earnsThe median taxable income in Australia was $55,868 in 2022-23. The median is the midpoint of the income range, meaning half of all individual taxpayers earned more and half earned less.
Section 01 · Average wages by year
Average wage in Australia by year, 2000–2025
Average Weekly Ordinary Time Earnings, or AWOTE, measures base pay for full-time adult employees. It excludes overtime, bonuses and one-off payments. Because the measure is used consistently across each survey period, it is one of the clearest ways to track changes in full-time base pay over time. The figures below use November readings, the main reference point for this series.
Three broad phases stand out across the 25 years. Wages grew strongly through the 2000s, helped by the mining investment boom and stronger competition for workers. Growth then slowed from 2013, averaging just 2.2% a year through to 2021. After the pandemic, a tighter labour market pushed nominal wage growth to its fastest pace since 2008. The Wage Price Index peaked at 4.2% in the December 2023 quarter, then eased to 3.3% by early 2026.
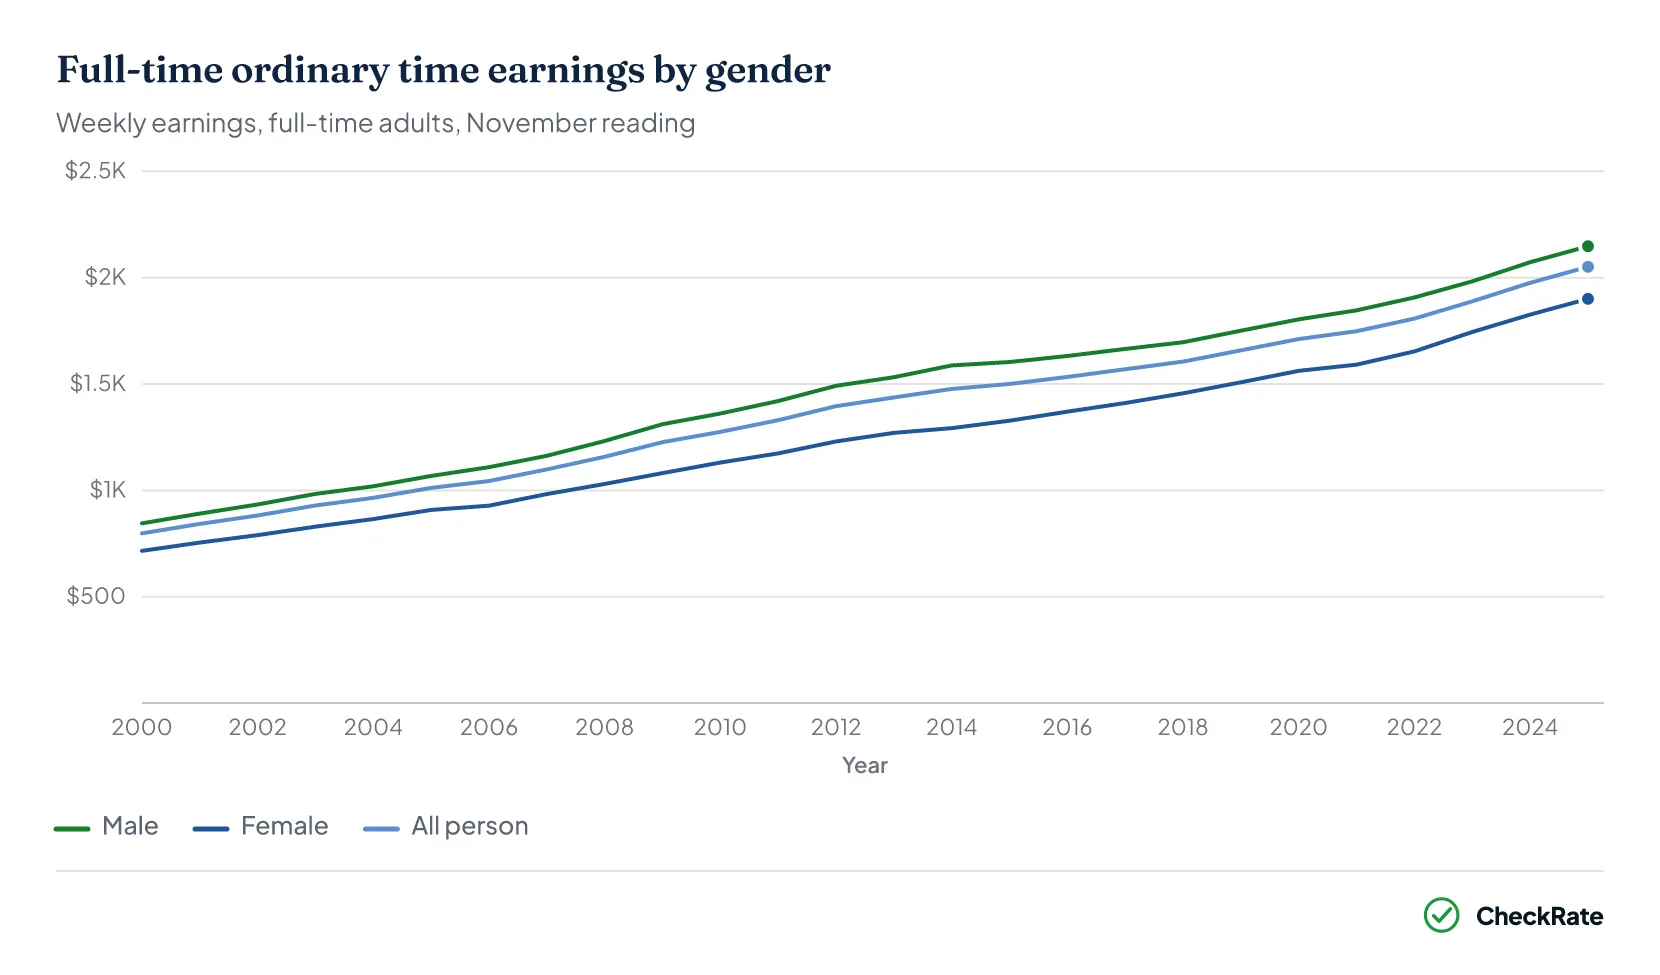
Gender pay gap in Australia: male and female earnings compared
Male full-time ordinary-time earnings were $2,147.80 a week in November 2025, compared with $1,900.60 a week for females. This puts the unadjusted gender pay gap at 11.5%, the narrowest recorded in the available series and down from a peak of 18.6% in November 2014.
This figure does not adjust for occupation, industry, seniority or hours worked. It should therefore be read as a whole-of-workforce comparison, rather than a like-for-like measure of pay for the same roles.
What is the current average full-time wage in Australia?
Full-time adult ordinary-time earnings, or AWOTE, averaged $2,051.10 a week in November 2025, equal to $106,657 a year. This is the mean, not the median. The median for full-time workers was $1,887 a week, or $98,124 a year, in May 2025. The median gives a clearer guide to what a typical full-time worker earns because it is less affected by very high earners at the top of the income distribution.
What is AWOTE and how does it differ from an average salary?
AWOTE stands for Average Weekly Ordinary Time Earnings. It covers base pay for full-time adults, excluding overtime, commissions, and bonuses, and is collected from employers each survey period. Average salary figures in the media often include part-time workers, use different pay components, or draw on different datasets entirely. Because AWOTE uses the same methodology every period, it's the most consistent measure available for tracking base pay trends over time.
Why does the ABS report different average wage figures?
Different ABS wage surveys measure different groups of workers. The AWOTE series covers full-time adult ordinary-time earnings only, which usually produces a higher average figure. Other employee earnings data can include part-time and casual workers, which often produces a lower median. Differences in scope, measure type and pay components all affect the final number. A figure may be a mean or a median, and it may cover ordinary-time earnings, total earnings or broader employee income. Each figure can be accurate, but only for the specific measure it is reporting.
Section 02 · How earnings are distributed
Mean vs median wage in Australia: why the typical worker earns less than the average
The mean for full-time adult ordinary-time earnings was $2,051.10 a week in November 2025. The median for full-time workers was $1,887 a week in May 2025.
These figures come from different survey periods and measure slightly different things: ordinary-time earnings compared with total cash earnings. Even so, they point to the same broader pattern. A relatively small number of very high earners lift the mean above what a typical full-time worker receives. The median is the midpoint of the earnings distribution, which means half of workers earn more and half earn less. It is less affected by very high or very low incomes.
Mean — full-time adults
- Ordinary time, Nov 2025
$2,051 per week · pulled up by high earners
Median — all full-time workers
- Total earnings, May 2025
$1,887 per week · half earn more, half less
When part-time workers are included, the median falls considerably. The all-employees median was $1,436 per week, or $74,672 per year, in May 2025. That was $451 below the full-time median.
This broader figure is often more useful for understanding earnings across the overall workforce because it includes full-time, part-time and casual workers.
Where full-time wages sit in Australia
One quarter of full-time workers earn below $1,424 per week. One quarter earn above $2,560 per week. The remaining half sit between those two points, with the median at $1,887.
| Earnings range: Q1 to Q3 by worker type (May 2025) | |||
|---|---|---|---|
| Worker type | Q1 (25th pct) | Median | Q3 (75th pct) |
| Full-time males | $1,472 | $1,994 | $2,741 |
| Full-time females | $1,370 | $1,758 | $2,353 |
| All full-time | $1,424 | $1,887 | $2,560 |
| All persons | $878 | $1,436 | $2,122 |
| Part-time only | $393 | $769 | $1,169 |
Source · ABS Average Weekly Earnings, Australia (Cat. 6302.0), distribution of weekly total cash earnings, May 2025.
How the distribution has shifted since 2012
Between May 2021 and May 2025, the full-time median wage rose 18.5%, from $1,592 to $1,887 a week, as wage growth accelerated after the pandemic. Over the longer period since 2012, the gap between lower and upper full-time earners also widened. The interquartile range increased from $796 to $1,136 a week, meaning the dollar gap between the lower and upper quartile points grew by $340.
In percentage terms, however, the lower quartile point rose slightly faster than the upper quartile point, increasing by 53.4% compared with 48.5%.
| Full-time earnings distribution by survey period | ||||
|---|---|---|---|---|
| Survey period | Q1 (25th pct) | Median | Q3 (75th pct) | IQR spread |
| May 2012 | $928 | $1,250 | $1,724 | $796 |
| May 2016 | $1,038 | $1,398 | $1,923 | $885 |
| May 2021 | $1,196 | $1,592 | $2,192 | $996 |
| May 2023 | $1,289 | $1,710 | $2,367 | $1,078 |
| May 2025 | $1,424 | $1,887 | $2,560 | $1,136 |
Source · ABS Average Weekly Earnings, Australia (Cat. 6302.0), distribution of weekly total cash earnings.
What is the median wage in Australia in 2026?
The latest available data shows full-time workers had median total cash earnings of $1,887 a week, or $98,124 a year, in May 2025. For all employees, including part-time and casual workers, the median was lower at $1,436 a week, or $74,672 a year. The full-time figure is often cited when comparing full-time earnings. The all-employees median gives a broader view of the workforce because it includes part-time and casual workers.
What percentage of Australians earn more than $100,000 per year?
The available distribution data does not give an exact percentage for workers earning more than $100,000 a year. However, it shows where that income sits in the full-time earnings spread. In May 2025, the full-time median was $1,887 a week, or $98,124 a year, while the third quartile was $2,560 a week, or $133,120 a year. A salary of $100,000 a year sits just above the full-time median, placing it slightly above the midpoint for full-time workers. Across all employees, including part-time and casual workers, $100,000 a year would sit higher in the overall earnings distribution.
Why is the mean higher than the median for Australian wages?
The mean is calculated by adding all wages and dividing by the number of workers. It is pulled higher by a smaller group of very high earners, including senior executives, specialist professionals and high earners in sectors such as finance, mining and medicine. The median is the middle value, meaning half of workers earn more and half earn less. It is less affected by very high incomes at the top of the distribution. For this reason, the median is often a more useful benchmark for typical earnings.
Section 03 · Real income over time
Real income in Australia: how wages and purchasing power have changed
Estimated real household income in 2026 sits roughly near its 2018 level, based on WPI and CPI movements rather than direct household income survey observations. This suggests much of the gain built up through the 2010s has been reversed. The difference between nominal and real income is important. Nominal wage growth measures how much more money workers receive in dollar terms. Real wage growth shows whether that money actually buys more after inflation. When prices rise faster than wages, purchasing power falls, even if the dollar amount on a payslip increases.
Real median equivalised disposable household income peaked at around $1,228 a week in 2020, measured in constant 2023 dollars. This was partly lifted by pandemic-era government transfers. By 2023, it had fallen to about $1,152 a week, roughly back to 2016 levels.
The broader household income data shows a similar pattern. Disposable incomes were affected by higher mortgage repayments, rising energy bills and services inflation that ran above headline CPI. While nominal wages have continued to grow, the higher price level created by the 2022 inflation surge has not unwound.
Has the average Australian wage kept up with inflation?
In most years between 2000 and 2020, wages did rise faster than inflation, but the gains were usually modest, typically between 0.2% and 1.4% a year in real terms. From 2013, those gains narrowed to close to zero. During the 2022 inflation spike, wages fell clearly behind prices. Wage growth was 3.4%, while inflation reached 7.8%, producing a real wage decline of about 4.4%. That single year reflected much of the cumulative real wage growth built up over the previous seven years. By early 2026, inflation was again running ahead of wage growth, with CPI at 4.6% compared with wage growth of 3.3%. That means real wages remained under pressure.
What is real wage growth and how is it different from nominal wage growth?
Nominal wage growth is the percentage increase in wages from one year to the next. If wages rise from $1,000 to $1,030 a week, that is 3% nominal growth. Real wage growth adjusts for inflation by comparing wage growth with price growth. If wages rise by 3% but prices rise by 4%, real wage growth is about −1%. This means workers are earning more dollars, but those dollars buy less than before. Real wage growth is the more useful measure of whether wages are improving after inflation.
Section 04 · The wage stagnation era
When did Australia's wage growth stall?
Australia's wage growth slowed sharply between 2013 and 2021.
The Wage Price Index (WPI) measures changes in wage rates for a fixed basket of jobs. This helps filter out the effects of promotions, changes in the mix of workers, overtime and bonuses. It is one of the clearest indicators of whether employers are paying more for the same work.
Annual WPI growth averaged 3.7% during the 2000s, but fell to an average of 2.2% between 2013 and 2021. It reached a record low of 1.3% in 2020, during the pandemic.
2000–2012
3.7%Growth era
Avg annual WPI growth. Mining boom drives labour market tightness and strong base pay rises.
2013–2021
2.2%Stagnation
Avg annual WPI growth. Fell to 1.3% in 2020, the weakest on record.
2022–2026
3.5%Post-pandemic
Avg annual WPI growth. Peaked at 4.2% in December 2023; now easing to approx. 3.3%.
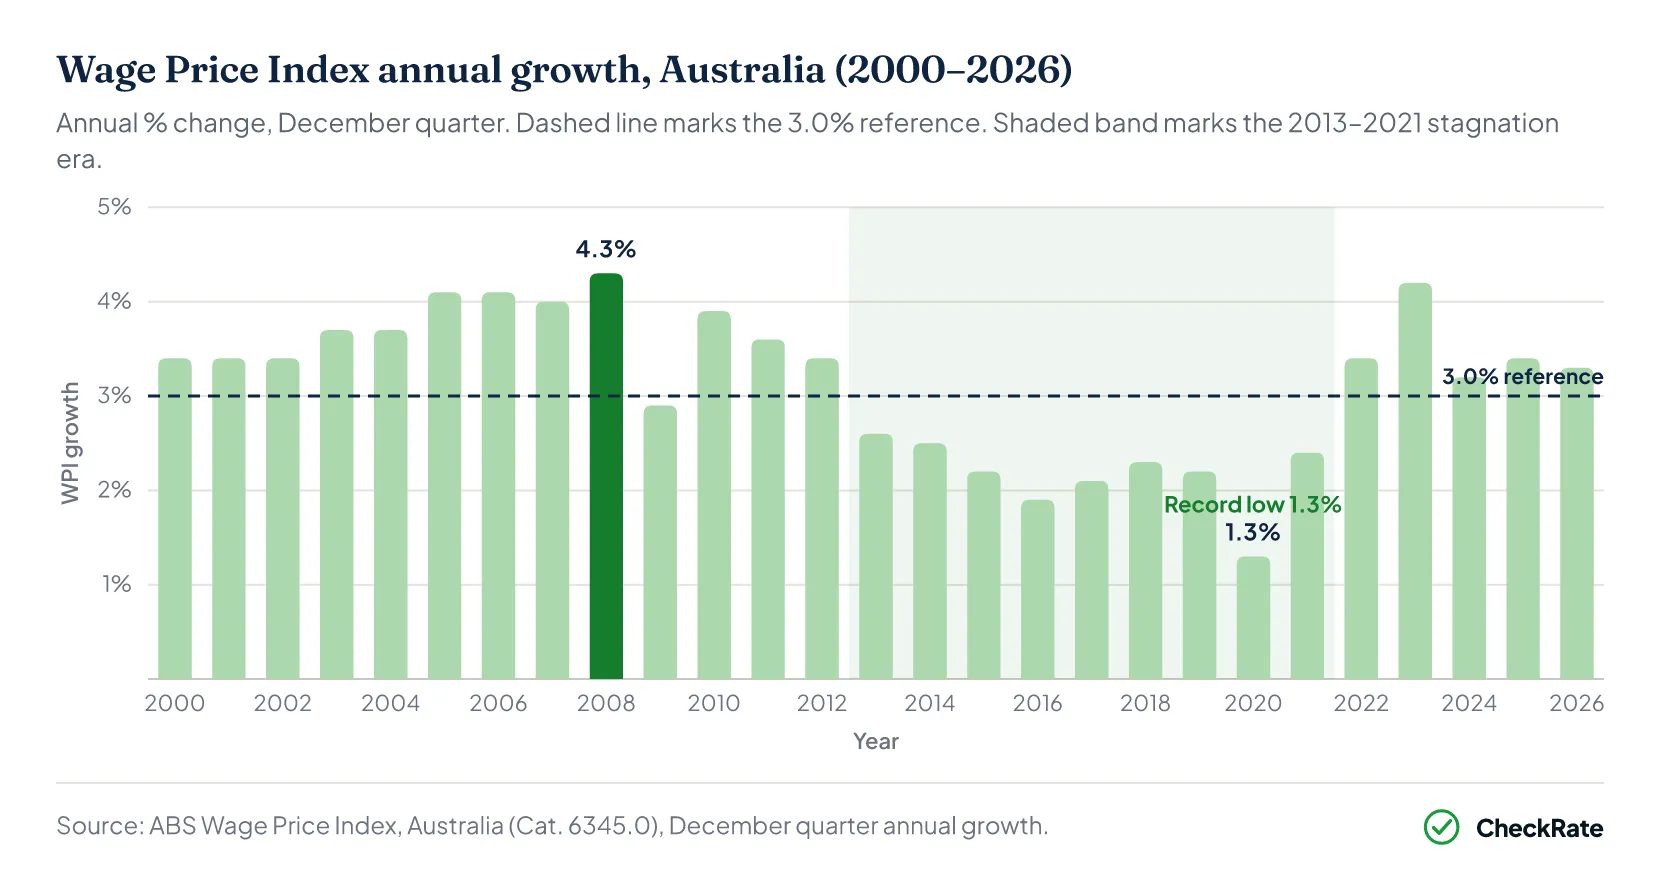
The slowdown coincided with several pressures. The capital-intensive phase of the mining boom ended, labour underutilisation rose as more workers wanted extra hours they could not get, and many enterprise bargaining agreements locked in fixed wage increases of around 2.0%. Weak productivity growth also weighed on pay growth.
These pressures did not resolve quickly. As a result, low wage growth persisted for several years and left workers more exposed when inflation surged.
The rebound from 2022 was influenced by a much tighter labour market. Border closures had reduced migrant labour supply, expired enterprise agreements were renegotiated at higher rates, and the Fair Work Commission approved larger minimum wage increases.
Annual WPI growth peaked at 4.2% in the December 2023 quarter before easing to about 3.3% by early 2026, as higher interest rates cooled hiring demand.
Why did Australian wage growth stall from 2013 to 2021?
Australian wage growth stalled from 2013 to 2021 as several structural pressures converged. The capital-intensive phase of the mining boom ended, reducing its wider effect on the labour market. Labour underutilisation also rose, with more Australians working fewer hours than they wanted, which weakened bargaining power. At the same time, many enterprise agreements from the mid-2010s locked in fixed annual increases of around 2.0%, while declining union density made it harder to renegotiate higher increases. Weak productivity growth also limited what employers could reasonably offer.
What caused wages to rise again from 2022 onwards?
Wages began rising again from 2022 as the post-pandemic labour market tightened sharply. Unemployment fell to multi-decade lows, border closures constrained migrant labour supply, and workers gained bargaining power they had lacked for much of the previous decade. Enterprise agreements from the low-growth years of 2015 to 2019 expired and were renegotiated at higher rates, while the Fair Work Commission also approved larger minimum wage increases. WPI growth peaked at 4.2% in the December 2023 quarter before easing to about 3.3% by early 2026 as higher interest rates slowed hiring demand.
Section 05 · Wages and wealth
House prices vs wages in Australia: how the gap has widened
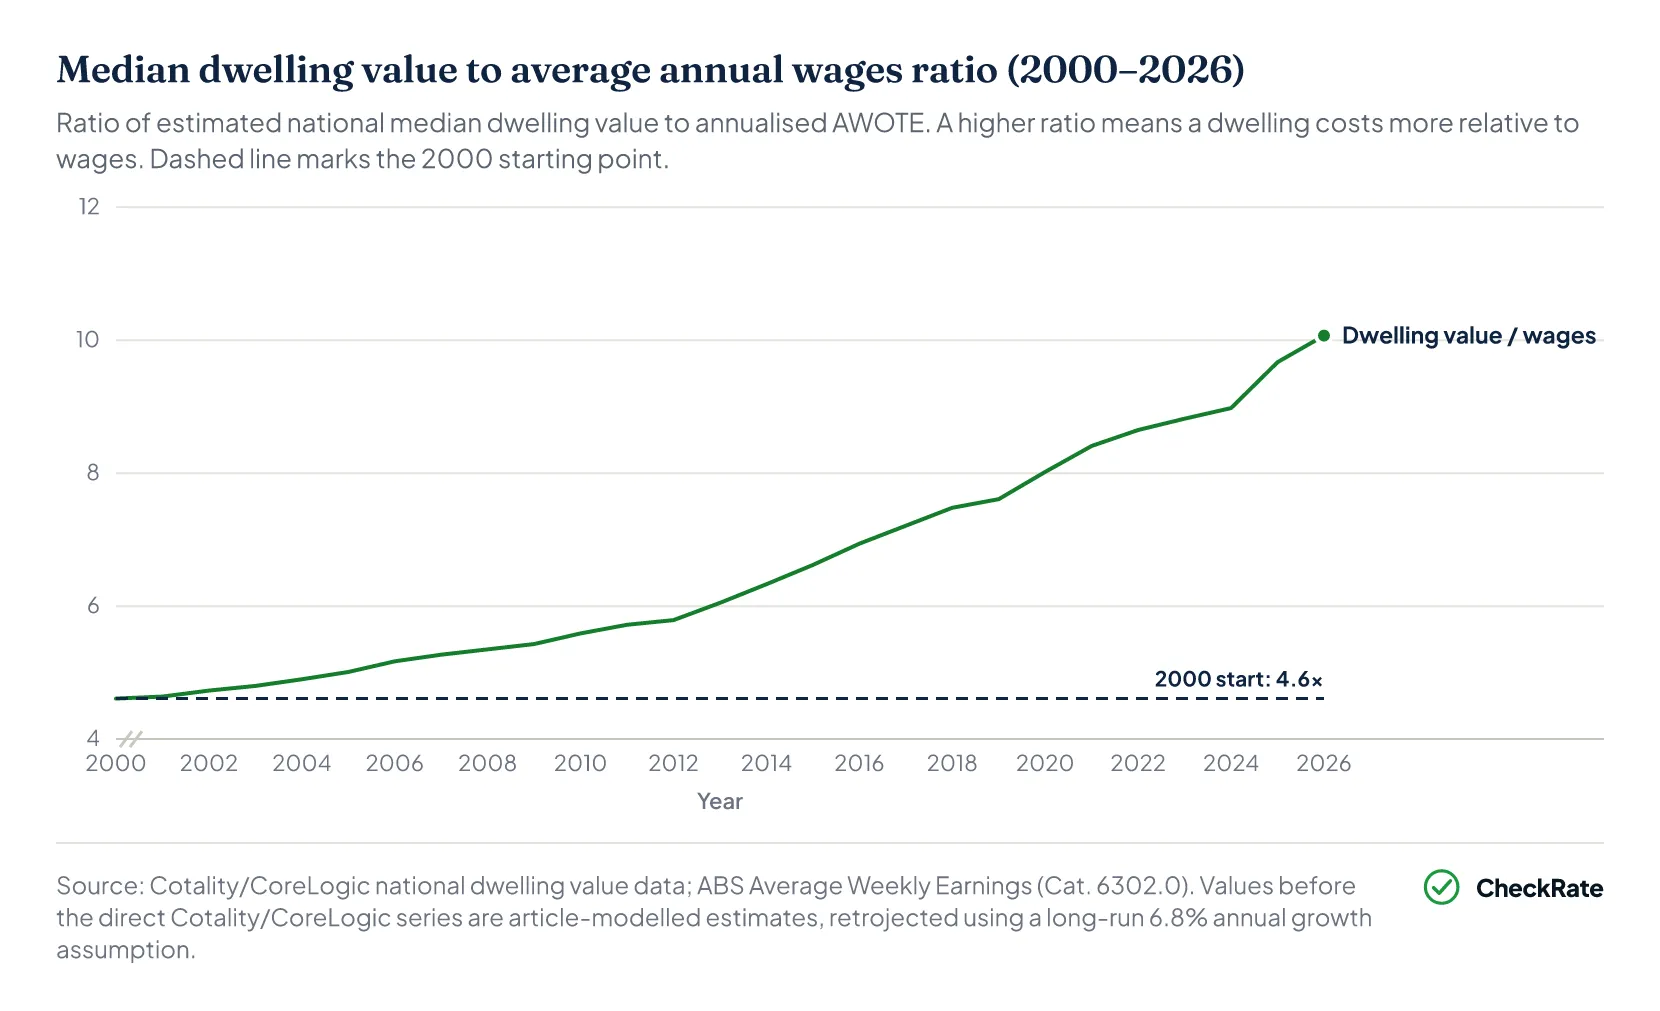
In 2000, the median Australian dwelling cost about 4.6 times the average annual full-time wage. By early 2026, that ratio had risen to more than 10 times.
Over the same period, nominal wages increased by 157%, but dwelling values rose much faster. This widened the gap between what full-time workers earn and what it costs to buy a home.
How long does it take to save a deposit on a house on the average wage?
On the average full-time wage of $106,657 a year, saving 20% of gross income would amount to $21,331 a year. At that rate, saving a 20% deposit on a median-priced Australian dwelling would take about 10 years in 2026. In 2000, using the same savings rate, it would have taken roughly 4.5 years. These are simplified estimates and do not account for tax, living costs, interest earned on savings, changes in property prices during the saving period, or the fact that many buyers save from household income rather than one individual wage.
Why have dwelling values grown faster than wages?
Dwelling values have grown faster than wages because several long-running forces have pushed housing demand higher while supply has remained constrained. Tax settings, including negative gearing and the capital gains tax discount, have made property investment more attractive. Historically low interest rates between 2011 and 2022 also increased borrowing capacity without a matching lift in wages. At the same time, restrictive land-use planning in major cities limited how quickly new housing could be added as the population grew. The pandemic then brought record-low interest rates and fiscal stimulus, which accelerated buyer demand. While some conditions have changed since then, these structural pressures have not fully unwound.
Section 06 · Housing affordability
Australia's dwelling price-to-income ratio has doubled since 2000
The dwelling price-to-income ratio measures how many years of median gross household income would be needed to buy a median-priced dwelling outright. In 2000, the ratio stood at 4.2, which was already high by historical standards. By 2024, it had reached a peak of 8.6, meaning a median-priced home cost more than twice as much relative to household income as it did 24 years earlier.
The ratio eased slightly to about 8.3 to 8.4 in 2025 and 2026, as higher interest rates cooled price growth in parts of the market. But this does not necessarily mean housing became more affordable. The easing mainly reflects reduced borrowing capacity, while dwelling prices remain high, the deposit hurdle is still substantial, and mortgage repayments are a heavier burden than they were before interest rates rose.
What does the dwelling price-to-income ratio mean in practice?
The ratio shows how many years of total household income would be needed to buy a median-priced dwelling outright, assuming no other spending. A ratio of 8.6 means a household on the national median income would need to put every dollar of income towards a home for 8.6 years to cover the purchase price. In practice, saving takes much longer because households still need to pay for rent, food, transport and other essentials. The ratio is most useful as a long-run trend indicator, rather than a precise measure of affordability for individual buyers.
Has housing affordability improved since the rate rises of 2022?
Only at the margins. The rate rises from 2022 to 2024 reduced borrowing capacity by increasing repayment costs, which cooled demand in parts of the market and moderated price growth. The dwelling price-to-income ratio eased from a peak of 8.6 in 2024 to about 8.3 to 8.4 in 2025 and 2026. However, this does not represent a structural improvement in affordability. Dwelling prices remain elevated, the deposit hurdle is still substantial, and higher interest rates have added ongoing cost pressure for mortgage holders. A sustained fall in the price-to-income ratio would require incomes to grow faster than dwelling prices over time.
Section 07 · OECD comparison
How Australia compares to other OECD countries over time
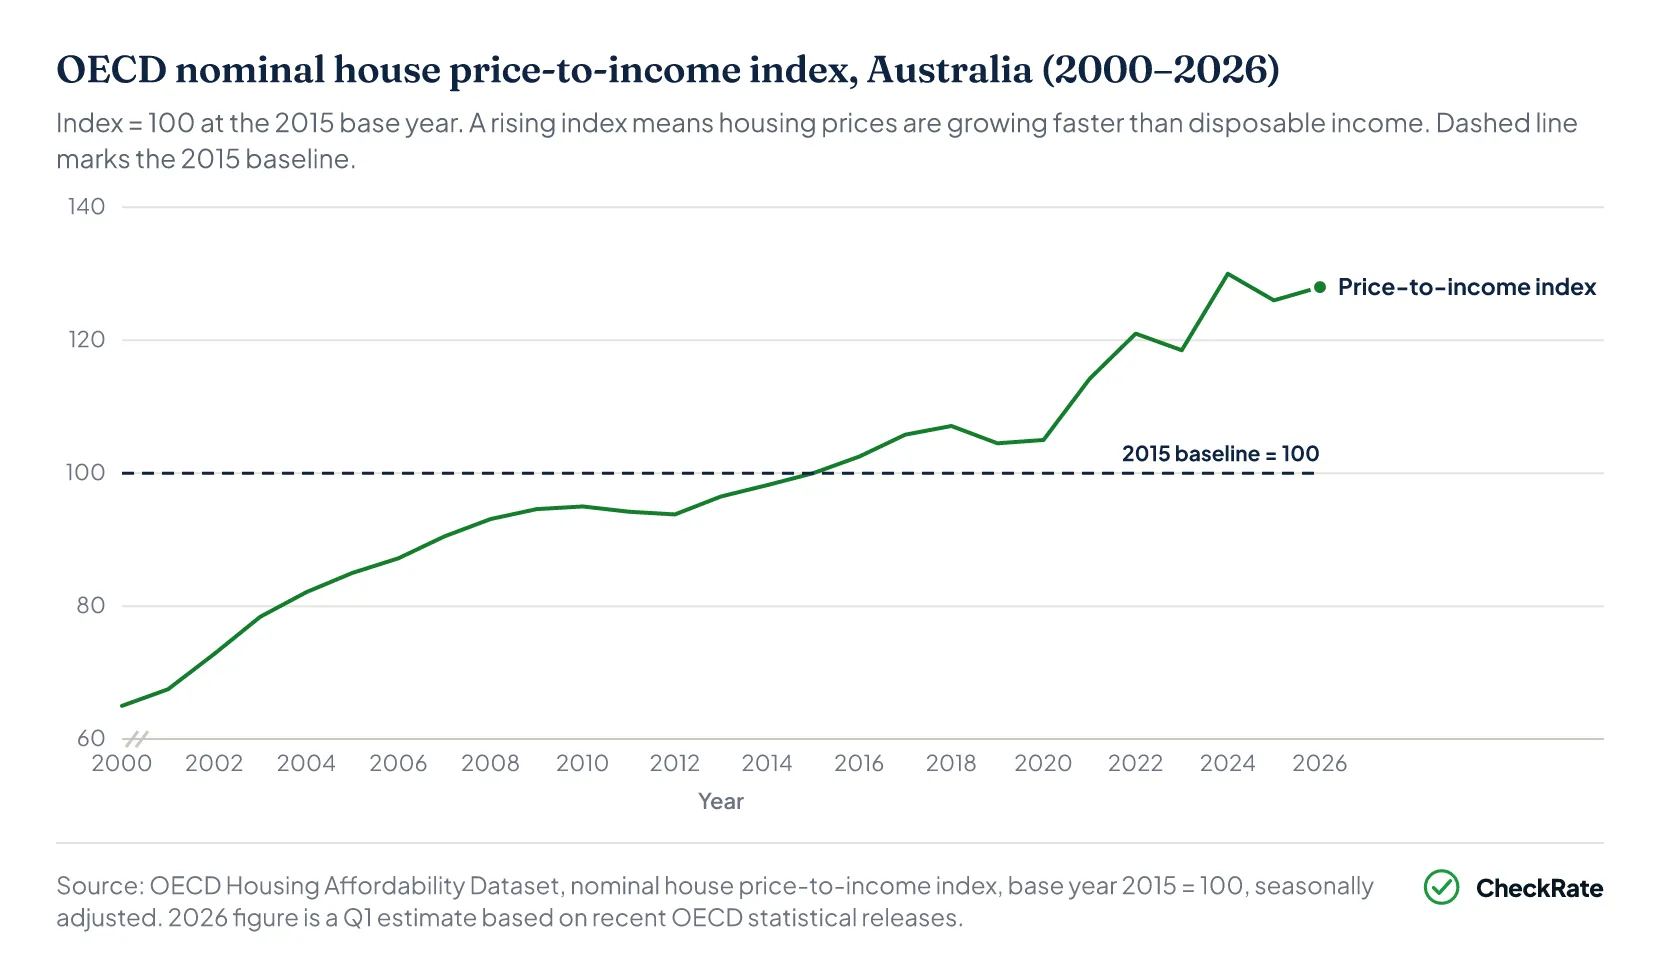
Australia's nominal house price-to-income index reached 130 in 2024, one of the higher readings among countries in the Organisation for Economic Co-operation and Development (OECD), before easing to about 128 in early 2026.
The index is standardised at 100 in 2015 across member countries and measures how much house prices have grown relative to disposable income since that base year.
A reading of 128 means Australian house prices have grown about 28% faster than disposable incomes since 2015.
How does Australia's housing affordability compare internationally?
Australia's price-to-income index reached 130 in 2024 and sat at about 128 in early 2026, placing it among the higher readings for countries in the Organisation for Economic Co-operation and Development (OECD). The OECD average has risen more moderately over the same period. Australia's key difference is not only the level of the index, but its long-term path. It has risen almost continuously since 2000, without the larger corrections seen in some peer countries after 2008. Other English-speaking markets, including Canada and New Zealand, have recorded similarly persistent increases, while some European countries have seen more modest rises or periods of genuine correction.
What does an OECD index value of 128 mean in plain terms?
An index value of 128 means that, compared with 2015, Australian house prices have grown about 28% faster than disposable incomes. If house prices and disposable incomes had grown at the same rate since 2015, the index would still be 100. Australia's longer-term shift is larger: the index was about 65 in 2000, showing that the gap between housing costs and incomes had already widened substantially before the 2015 base year.
Section 08 · Real purchasing power
Australian purchasing power since 2000: are workers better off?
Real wage growth is calculated as the annual Wage Price Index minus the Consumer Price Index. A positive result means wages outpaced prices that year. A negative result means purchasing power fell.
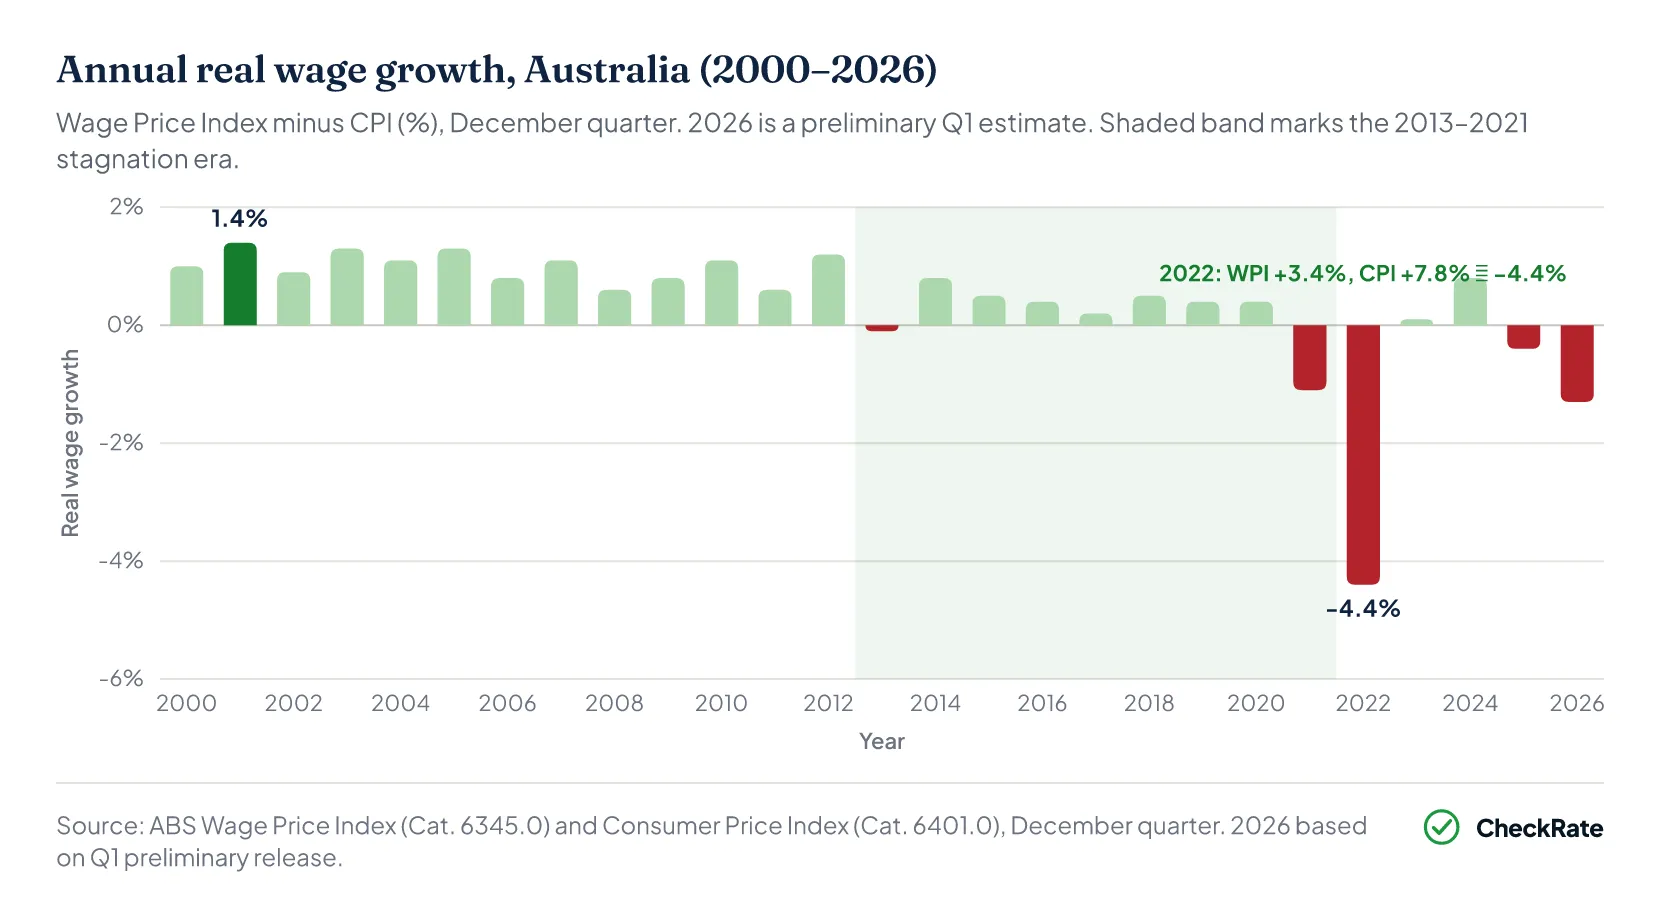
In nominal terms, average wages have grown by 157% since 2000. In real purchasing power terms, the gain is far more modest. Between 2000 and 2012, real wages grew by 0.6% to 1.4% a year, compounding into a meaningful lift in living standards. From 2014 to 2020, growth averaged less than 0.5% a year.
The contraction in 2021 and 2022 then reversed those gains. Even with a partial recovery in 2023 (+0.1%) and 2024 (+0.8%), real wages in 2026 sit close to where they were in 2009. The higher price level created by the 2022 inflation surge remains the new baseline, even as wage growth continues.
Have real wages increased since 2000?
For wage earners, real wages appear higher than in 2000, but the increase is much smaller than the nominal wage rise. Between 2000 and 2020, real wages grew by roughly 15% to 20% in cumulative terms, indicating an increase in purchasing power over that period. The 2021 to 2022 inflation period erased much of that progress, with a combined real wage loss of 5.5% wiping out the gains built up over the previous seven years. By 2026, real wages sit close to where they were in 2009. For households that also accumulated property, the picture is different, because dwelling values have grown much faster than wages. The answer depends heavily on whether a household owns assets.
What caused the 2022 real wage decline?
The 2022 real wage decline of 4.4% was caused by inflation running well ahead of wages. Consumer prices rose by 7.8% that year, driven by global supply chain disruption, energy price shocks following the Russia-Ukraine war, pandemic-era demand stimulus and rising housing costs. Wages grew by just 3.4% over the same period. Because wages are often set through enterprise agreements, awards or annual review cycles, they cannot respond quickly to a sudden inflation spike. That mismatch produced the weakest real wage outcome in the available series.
Has Australia recovered from the 2022 real wage decline?
Only partially. In 2023 and 2024, inflation moderated, and wage growth picked up, producing small positive real wage outcomes of 0.1% and 0.8%, respectively. But these gains did not restore the purchasing power lost in 2021 and 2022. The price level remains permanently higher, so even when real wage growth turns positive, workers are growing from a lower real base. In early 2026, inflation was again running ahead of wage growth, with CPI at 4.6% compared with wage growth of 3.3%, producing an estimated real wage decline of 1.3%, based on Q1 preliminary data.
References
- ABS Average Weekly Earnings, Australia, November 2025 · Australian Bureau of Statistics
- ABS Employee Earnings and Hours, Australia · Australian Bureau of Statistics
- ABS Wage Price Index, Australia · Australian Bureau of Statistics
- ABS Consumer Price Index, Australia (latest release, Cat. 6401.0) · Australian Bureau of Statistics
- ABS, Household Income and Wealth, Australia 2024 · Australian Bureau of Statistics
- Cotality (CoreLogic) — national dwelling value data and indices · cotality.com
- Cotality — Housing Affordability Report, November 2025 · discover.cotality.com
- OECD Analytical house price indicators, dataflow DSD_AN_HOUSE_PRICES (price-to-income, series HPI_YDH and HPI_YDH_AVG) · sdmx.oecd.org