Land tax was the fastest-growing major tax shown in the article's ABS series, rising 177.8% between 2015–16 and 2024–25. Separately, capital gains tax (CGT) and negative gearing changes passed into law in June 2026, with the main measures starting from 1 July 2027.
Which level of government collects the most tax in Australia?
Australia runs tax through three levels of government, but the money is collected very unevenly. The Commonwealth levies all income tax, company tax and GST, and administers customs and excise. States rely on a narrower base: payroll tax, land tax and taxes on the sale of goods and services such as stamp duty. Local councils have only one source of tax revenue under the official classification: property, in the form of municipal rates.
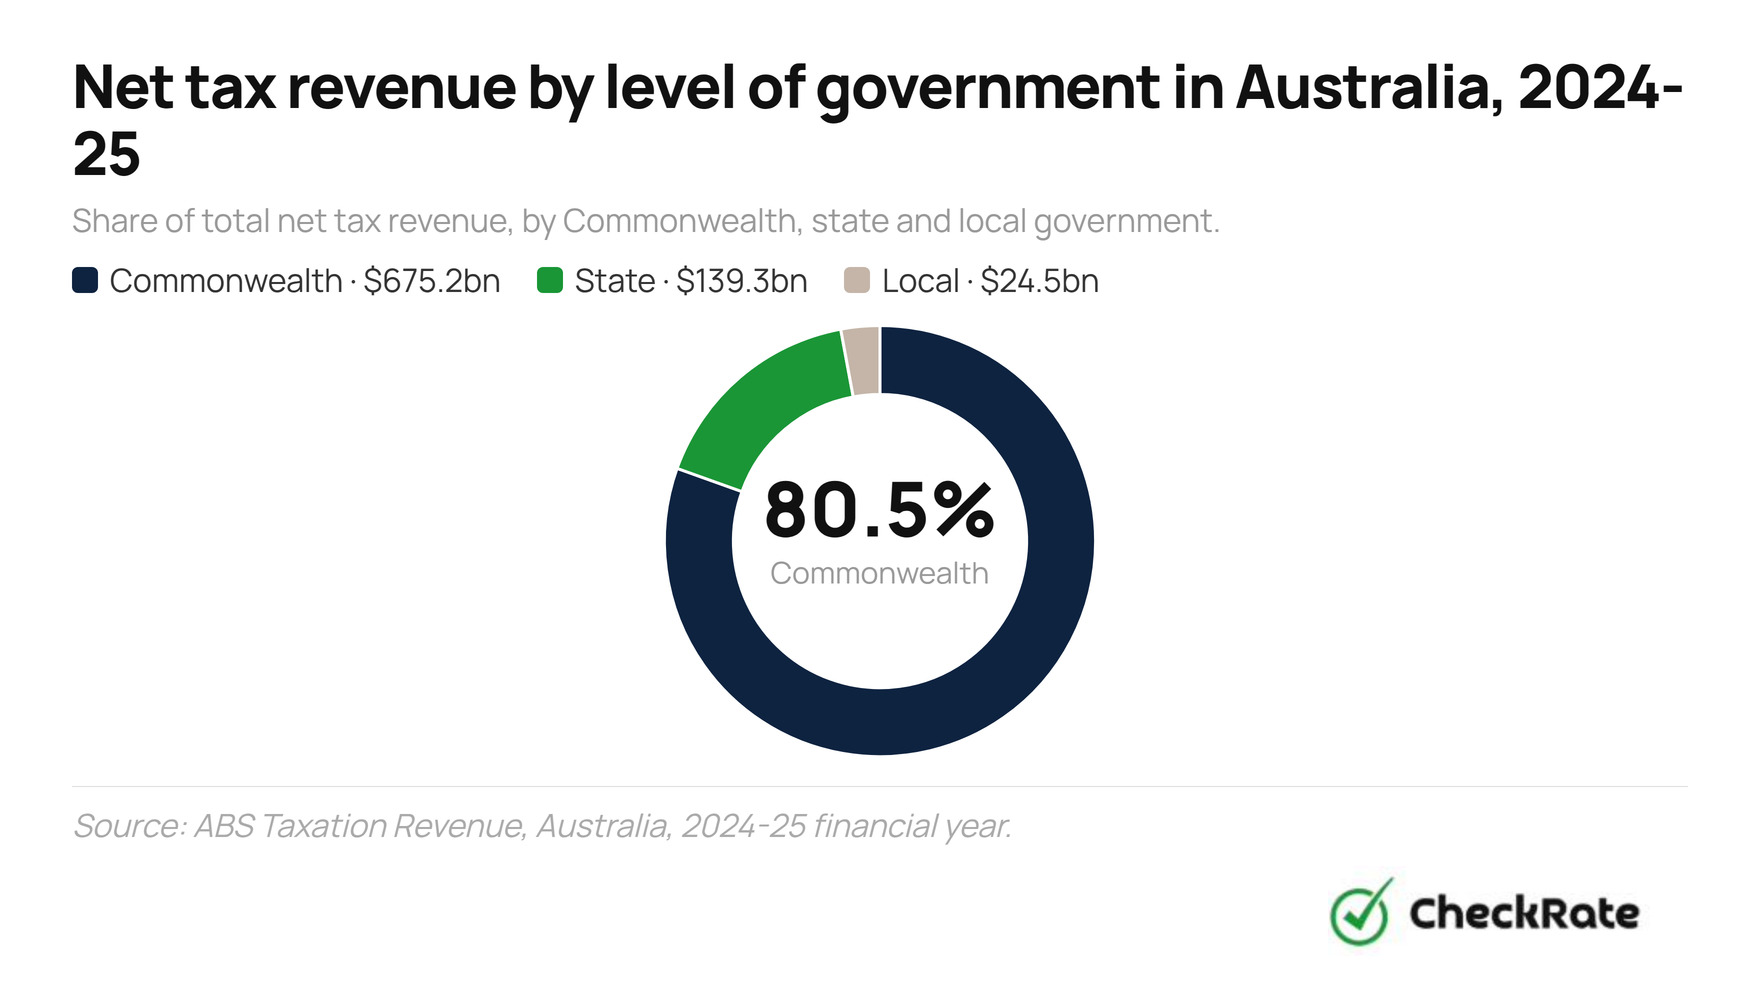
In 2024–25, the Australian Government collected $675.2 billion in net tax revenue, against $139.3 billion for the states and territories combined and $24.5 billion for local government. Every level of government recorded growth on the year before.
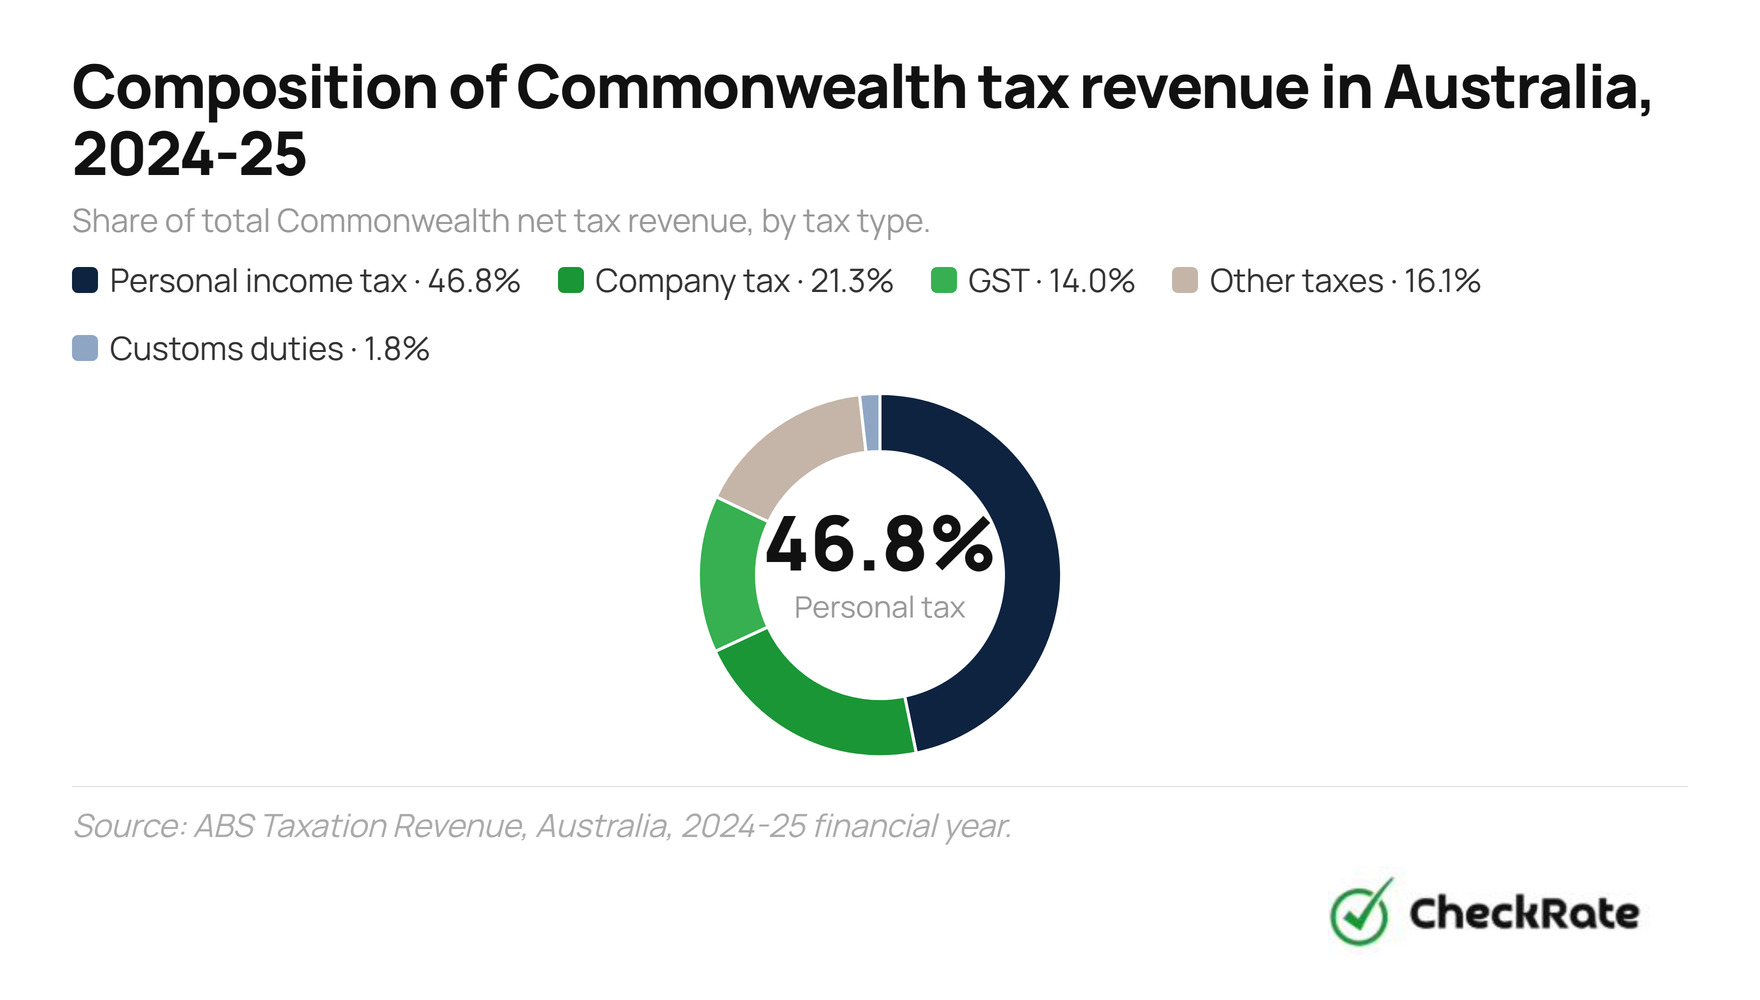
The Commonwealth composition chart shows why Commonwealth tax revenue is broader than income tax alone. Personal income tax was the largest single category, accounting for 46.8% of Commonwealth tax revenue in 2024–25. Company tax, GST and other Commonwealth taxes, including tax paid by superannuation funds, accounted for the remaining share.
Why the Commonwealth collects most tax
Income taxation has been mainly a Commonwealth function since the Second World War. States and territories now rely on narrower tax bases, including property, payroll and transaction taxes. Local government's tax base is narrower again, with taxation revenue recorded as property tax under the ABS classification.
On a per-person basis, total tax revenue across all levels of government was $30,633 in 2024–25. This comprised $24,652 collected by the Commonwealth and $6,023 collected by state, territory and local governments combined. These are population averages, not estimates of how much an individual taxpayer paid.
What are Australia's biggest sources of tax revenue?
Personal income tax was Australia's largest single tax in 2024–25, raising $316.2 billion. Company tax was second at $143.7 billion, followed by GST at $94.8 billion.
Over the decade from 2015–16 to 2024–25, land tax recorded the fastest growth among the major tax types shown in this article, rising 177.8%. That was ahead of company tax, which rose 123.1%, and personal income tax, which rose 82.5%.
- Personal income tax
- Company tax
- GST

Why land tax revenue grew faster than other major tax types
Land tax revenue rose from $7.2 billion in 2015–16 to $20.0 billion in 2024–25. The ABS data does not isolate one cause, but the increase is consistent with higher land values and changes to state land tax settings over the period. Victoria is one example of a policy change: its general land tax threshold fell from $300,000 to $50,000 from the 2024 land tax year, and a COVID-19 debt levy applies for the 2024 to 2033 land tax years.
Stamp duty on conveyances can be more volatile than land tax because it depends on both the number and value of property transactions in a given year. Revenue can therefore fall in some years, even when land tax continues to rise.
The state and local mix
Within state and local taxes, the "other state taxes" category, which includes insurance duty, motor vehicle taxes and gambling taxes, was the largest single line at $43.9 billion in 2024–25, ahead of payroll tax at $41.5 billion. State and local taxation revenue increased by $11.5 billion during the year, led by stamp duties on conveyances, payroll taxes and land taxes.
| Tax type | 2015–16 | 2024–25 | Growth |
|---|---|---|---|
| Land tax | $7.2bn | $20.0bn | +177.8% |
| Company tax | $64.4bn | $143.7bn | +123.1% |
| Payroll tax | $22.6bn | $41.5bn | +83.6% |
| Personal income tax | $173.3bn | $316.2bn | +82.5% |
| Stamp duty on conveyances | $20.6bn | $34.4bn | +67.0% |
| GST | $59.2bn | $94.8bn | +60.1% |
| Municipal rates | $16.9bn | $25.1bn | +48.5% |
| Other state taxes | $27.7bn | $43.9bn | +58.5% |
How much income tax do Australians pay?
Australia taxes income progressively: different portions of taxable income are taxed at different marginal rates, rather than the whole amount being taxed at one flat rate. The tax-free threshold, currently $18,200, has not moved since 2012–13. The 2025–26 brackets are the same as 2024–25, but the rate on the second bracket is legislated to fall in each of the next two years.
| Taxable income | 2025–26 | 2026–27 | 2027–28 |
|---|---|---|---|
| $0 to $18,200 | Tax-free | Tax-free | Tax-free |
| $18,201 to $45,000 | 16% | 15% | 14% |
| $45,001 to $135,000 | 30% | 30% | 30% |
| $135,001 to $190,000 | 37% | 37% | 37% |
| Over $190,000 | 45% | 45% | 45% |
The practical effect is modest but measurable. For anyone earning more than $45,000, the rate cuts on the second bracket are worth up to $268 a year from 2026–27 and $536 a year from 2027–28, compared with 2024–25 settings. These cuts do not include the Medicare levy, which sits on top at 2% of taxable income for most residents, or any offsets a taxpayer may be entitled to.
The Medicare levy, and how the thresholds apply
Most residents pay an additional 2% Medicare levy on top of income tax. Lower-income earners pay a reduced levy or none at all. For 2025–26, a single person pays no Medicare levy on taxable income up to $28,011. The levy then phases in before the full 2% rate applies above the upper phase-in threshold.
The 2025–26 Medicare levy low-income threshold is higher for people eligible for the seniors and pensioners tax offset, increasing to $44,268. Family thresholds also apply, depending on household circumstances and dependants.
Bracket creep, in plain terms
The $18,200 tax-free threshold has been fixed since 2012–13. Wages have risen substantially since then, so a larger share of most people's income now falls above that threshold than did a decade ago. This effect, known as bracket creep, can increase the average tax rate paid on a given real income over time, even when no bracket rate changes at all.
What tax changes were passed in 2026?
A significant package of tax reforms was announced in the 2026–27 Budget on 12 May 2026 and later passed both houses of federal Parliament. It received royal assent on 26 June 2026 as the Treasury Laws Amendment (Tax Reform No. 1) Act 2026 and the related Income Tax Rates Amendment Act. The main capital gains tax and negative gearing changes are now law, although most do not start immediately.
What is actually changing, and when
The distinction matters for anyone planning around these rules. The instant deduction, the CGT overhaul and the negative gearing limits are all now settled law, even though most of them do not start until future income years. The asset write-off and the trust measure are not: the write-off has been introduced to Parliament in a second bill but had not passed at the time of writing, and the trust measure remains a Budget announcement only, with its final shape, including any carve-outs, still being worked out.
Two other measures were bundled into the same package. A $250 Working Australians Tax Offset begins from the 2027–28 income year, aimed at wage and salary earners and sole traders. As the price of securing support to pass the package, new self-managed super fund borrowing arrangements over residential property are also restricted, from 45 days after royal assent, landing on 10 August 2026. Existing arrangements are grandfathered.
How does GST revenue get distributed to Australian states and territories?
GST is a broad-based 10% tax on most goods and services sold in Australia, in place since July 2000. The Commonwealth administers and collects it, but by design, GST revenue is distributed to the states and territories. The distribution is based on relativities recommended each year by the independent Commonwealth Grants Commission.
The Commission's job is to work out how much GST each state needs to fund a broadly similar standard of services, given differences in population, costs and each state's own capacity to raise revenue. A state with strong mining royalties, for instance, is assessed as needing less GST support than it otherwise would.
Why Western Australia's GST share changed in 2026–27
In 2018, the Commonwealth legislated a floor under Western Australia's GST share after years of the state receiving a shrinking slice due to its mining royalties. That floor was phased in gradually, with the Commonwealth making additional payments during the transition so other states and territories were not worse off under the revised GST distribution arrangements. The 2026–27 distribution marks the end of that six-year transition period. From this year, no state's relativity can fall below the lower of New South Wales or Victoria, and Western Australia now receives the same per-person share of the pool as New South Wales.
Queensland is set for the largest year-on-year increase of any state in 2026–27, driven by falling coal prices reducing its own revenue-raising capacity in the Commission's assessment, which increases its calculated need for GST support.
How much do state and territory taxes vary across Australia?
The Commonwealth applies the same income tax, company tax and GST rules everywhere. Below that layer, state and territory taxes vary substantially. Victoria and New South Wales recorded the highest combined state and local tax revenue per person in 2024–25, while the Northern Territory and Tasmania recorded the lowest.
Those figures reflect each state's overall tax mix and economic base, not any single tax that would appear on a bill. For that, the three taxes that actually differ by jurisdiction — payroll tax, land tax and stamp duty — are worth looking at directly.
Key differences in state and territory taxes
- The Northern Territory has the highest payroll tax threshold and the only jurisdiction with no land tax at all. Its $2.5 million payroll threshold is the highest in the country, and from 1 July 2026 a new 6.5% rate applies to very large employer groups.
- Victoria has the lowest land tax threshold among the states, at $50,000. That is down from $300,000 before 2024, after the state added a COVID-19 debt levy for the 2024 to 2033 land tax years.
- Tasmania has the lowest top marginal transfer duty rate among the states, at around 4.5%. Western Australia also has one of the lower top rates, at around 5.15%, while the ACT has been gradually reducing conveyance duty since 2012 as part of its broader tax reform programme.
How has Australian tax revenue changed since 2010–11?
Zooming out from the past decade to a longer run of ABS data shows the same broad upward trend: total tax revenue across all levels of government has more than doubled since 2010–11, rising from $360.2 billion to $839.0 billion.
The most recent quarterly figure shows some short-term movement within that long upward trend. In the March 2026 quarter, ABS Government Finance Statistics recorded taxation revenue of $220.6 billion, down 4.5% from the December 2025 quarter. Quarterly figures can move for reasons including payment timing and changes in transaction-based taxes, so one quarterly fall does not, by itself, show a change in the long-run trend.
References
- 1Australian Bureau of Statistics, Taxation Revenue, Australia, 2024–25 financial year, released 21 April 2026.
- 2Australian Bureau of Statistics, Taxation Revenue, Australia methodology, 2024–25 financial year, released 21 April 2026.
- 3Australian Bureau of Statistics, Insights into Government Finance Statistics, Annual, 2024–25, released 21 April 2026.
- 4Australian Bureau of Statistics, Government Finance Statistics, Australia, March 2026, released 2 June 2026.
- 5Australian Taxation Office, Tax rates: Australian residents, 2025–26 income year.
- 6Australian Taxation Office, Personal income tax: new tax cuts for every Australian taxpayer, 2026–27 and 2027–28 income years.
- 7Australian Taxation Office, Medicare levy reduction for low-income earners, 2025–26 income year.
- 8Australian Taxation Office, Tax reform: reforming negative gearing and capital gains tax, 2026–27 Budget measure.
- 9Federal Register of Legislation, Treasury Laws Amendment (Tax Reform No. 1) Act 2026, assented to 26 June 2026.
- 10Australian Taxation Office, Standard deduction for work-related expenses, 2026–27 income year.
- 11Australian Taxation Office, $20,000 instant asset write-off, 2026–27 Budget measure.
- 12Commonwealth Grants Commission, 2026 Update, GST relativities for 2026–27.
- 13Commonwealth Grants Commission, 2026–27 GST Distribution media release, released 13 March 2026.
- 14Australian Government, Budget Paper No. 3: Federal Financial Relations, 2026–27, released May 2026.
- 15State and territory revenue offices, payroll tax, land tax and transfer duty rates and thresholds, 2026–27: Revenue NSW, SRO Victoria, Queensland Revenue Office, WA Finance, RevenueSA, SRO Tasmania, ACT Revenue Office, and NT Territory Revenue Office.
Data Snapshots