


Updated
- $122k
- Top 20% of employee earnings (ABS, August 2025)
- $156k
- Top 10% published 90th percentile employee pay (ABS, August 2025)
- $183k
- Fair Work high income threshold, 2025–26
- $250k
- Division 293 ATO super-tax threshold, unchanged since 2017–18
 Income distribution in Australia: what each income percentile earnsThe median taxable income in Australia was $55,868 in 2022-23. The median is the midpoint of the income range, meaning half of all individual taxpayers earned more and half earned less.
 Australian wages and wealth since 2000: why higher pay has not gone as farThe average full-time Australian worker earned $2,051.10 a week in ordinary-time wages in November 2025, equal to $106,657 a year. That was 157% higher than in November 2000, when the same measure was…
 Australian wealth statistics: net worth, assets and the wealth gapThat gap is not new. When both figures were last measured together in 2019–20, average household net worth was $1.04 million, while the median was $579,200. By 2024, the average had risen to $1.58 mil…
Section 01 · ATO thresholds
How does the ATO define a high-income earner?
Australia doesn't have a single official definition of a high income. Three separate government thresholds each serve a different purpose, ranging from $101,000 for singles under the Medicare levy surcharge to $250,000 under the Division 293 super tax.
In workplace settings, the Fair Work threshold is the most commonly cited benchmark. At $183,100, it sits above the top 10% employee threshold of $156,000.
It is still below the top 5% threshold of around $203,000. This puts it roughly in the top 7% to 8% of employee earnings.
Each threshold serves a different purpose. Crossing the $101,000 Medicare levy surcharge line does not make someone a high earner under Fair Work definitions. Earning above the $183,100 Fair Work threshold also leaves a $66,900 gap before the Division 293 super tax threshold applies. For income comparisons, the ABS earnings distribution gives a clearer picture of where a salary sits.
Why is there no single 'high income' number in Australia?
Each threshold was created for a specific purpose. The Fair Work threshold sets the point where certain award protections may change. Division 293 is a super tax rule that reduces the tax advantage of contributions for higher earners. The Medicare levy surcharge is linked to private health insurance take-up. None of these thresholds was designed to show whether a salary counts as high. The ABS earnings distribution provides a percentile-based comparison of employee earnings.
Does the $183,100 Fair Work threshold mean all award protections are lost?
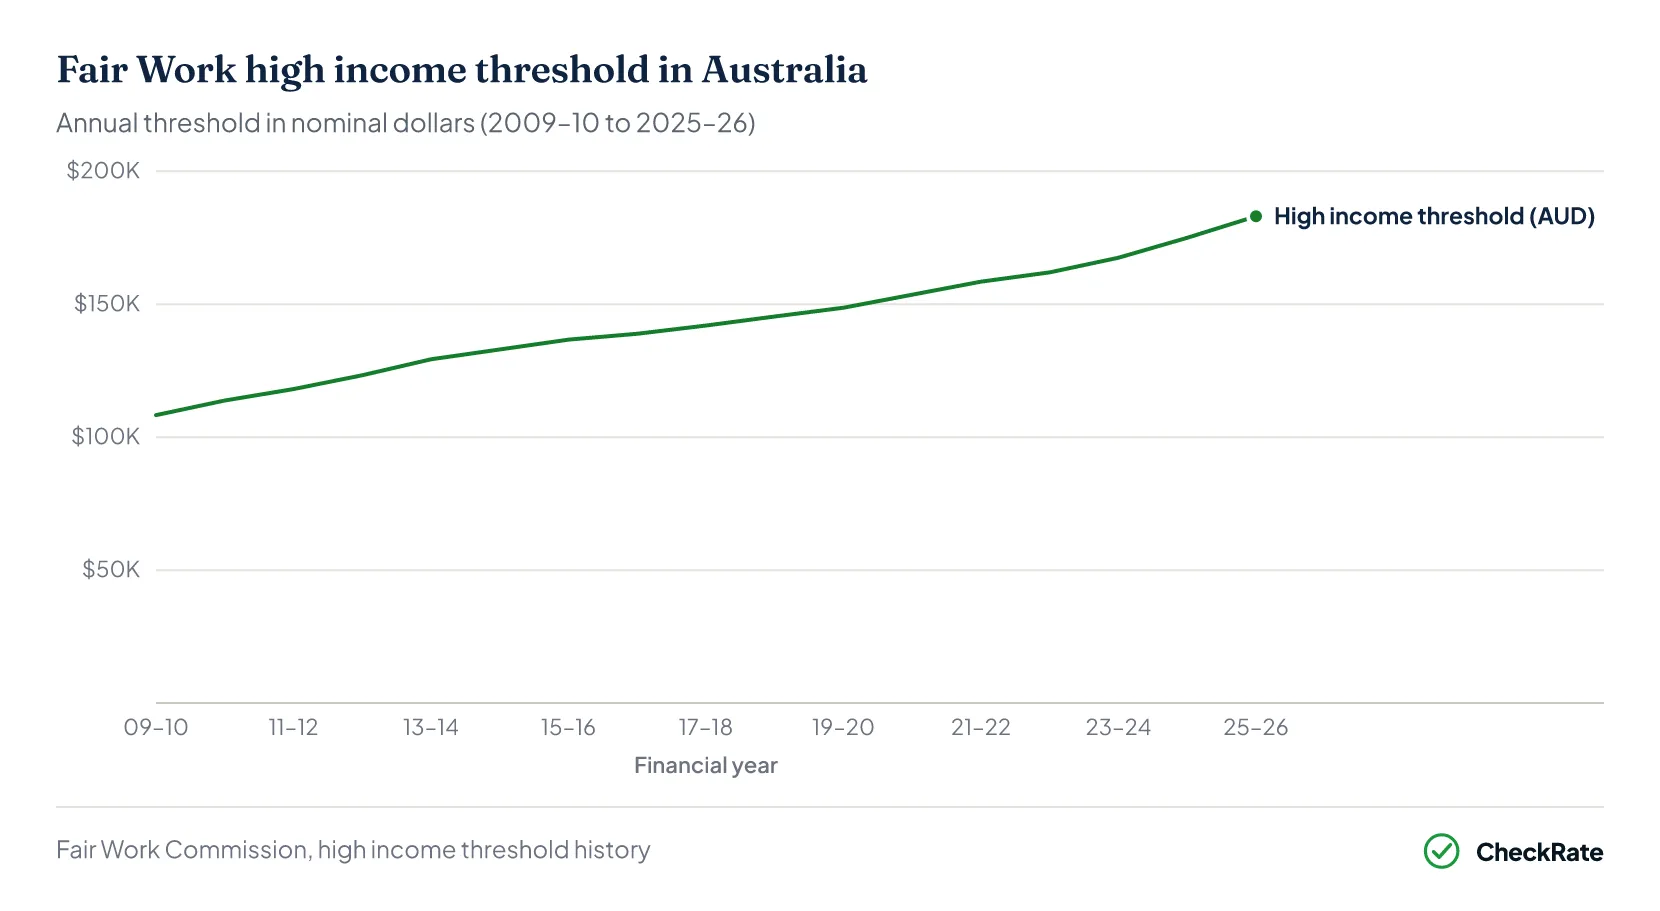
Not automatically. The threshold determines eligibility for guarantee-of-annual-earnings arrangements. If an employee's earnings exceed $183,100 and they sign a written guarantee with their employer, the relevant modern award generally stops applying, except for certain provisions that always remain in effect. Employees below the threshold cannot be placed on such arrangements, regardless of their contract. The threshold is reviewed annually by the Fair Work Commission and has risen from $108,300 in 2009–10 to $183,100 in 2025–26.
Section 02 · Earnings distribution
What salary puts an employee in the top 20% in Australia?
A salary of around $122,200 a year, or $2,350 a week in a main job, sits in the top 20% of Australian employee earnings. This is an estimate based on the ABS grouped earnings distribution and rounded to the nearest $50. It is not a directly published ABS figure.
The median employee salary is $74,100, or $1,425 a week. Three quarters of employees earn below $110,604, or $2,127 a week. An employee at the 80th percentile earns about 65% more than the median.
| Distribution of weekly earnings in Australia (main job) | |||||
|---|---|---|---|---|---|
| Percentile | Aug 2020 | Aug 2024 | Aug 2025 | Annualised (2025) | 1-yr change |
| 10th percentile | $404 | $445 | $450 | $23,400 | +1.1% |
| 25th percentile | $750 | $899 | $900 | $46,800 | +0.1% |
| 50th percentile (median) | $1,150 | $1,399 | $1,425 | $74,100 | +1.9% |
| 75th percentile | $1,736 | $2,055 | $2,127 | $110,604 | +3.5% |
| 90th percentile | $2,500 | $3,040 | $3,000 | $156,000 | −1.3% |
Source · ABS Employee Earnings, August 2025 (Cat. No. 6333.0).
What does the full Australian income distribution look like?
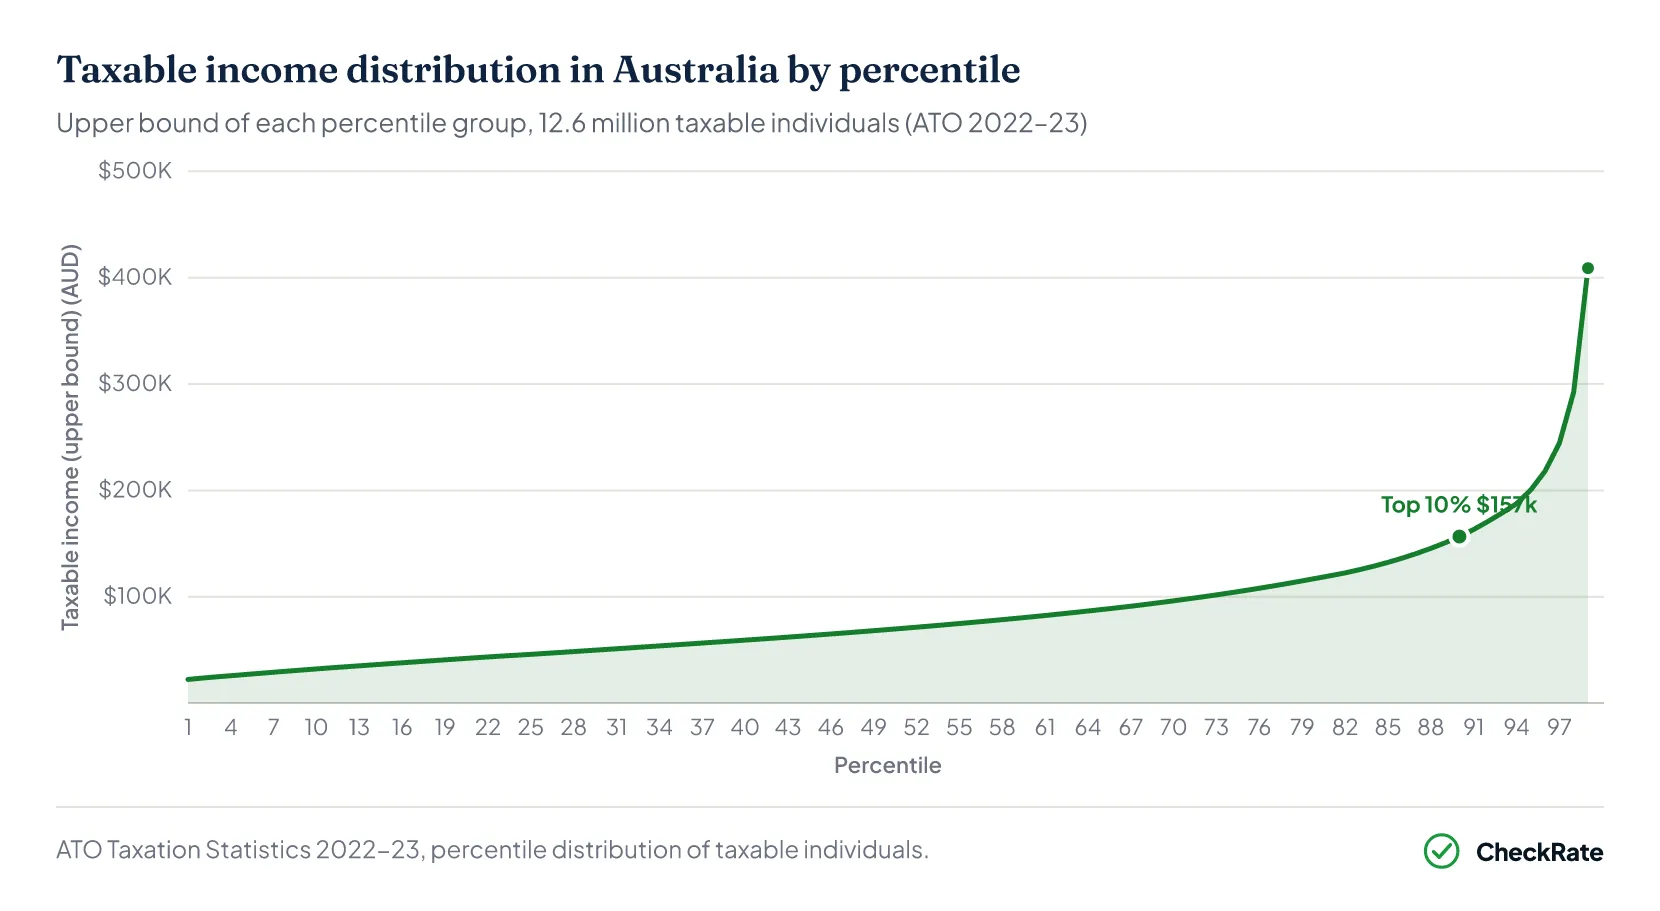
Among the 12.6 million people in the ATO taxable income dataset, half earned below roughly $69,000.
The 90th percentile was $156,592, the 95th percentile was $200,515, and the top 1% threshold was $408,973. The top 1% threshold was nearly six times the median.
Section 03 · Top 10%
What salary puts an employee in the top 10% in Australia?
The ABS publishes the top 10% employee threshold directly. As of August 2025, it was $3,000 a week, or $156,000 a year.
This figure fell 1.3% from $3,040 in August 2024, making it the only published percentile to decline over the year. The decline likely reflects a change in the mix of workers at the top of the distribution, rather than a fall in individual pay rates.
The Fair Work threshold of $183,100 appears to sit roughly around the top 7% to 8% of employee earnings, although the ABS does not publish that exact percentile. This distinction matters because the Fair Work threshold and ABS earnings percentiles measure different things.
Which states have the highest share of top earners?
The share of high earners varies considerably across states and territories. The ACT and Western Australia have the largest proportion of taxpayers earning above $120,000; Tasmania and South Australia have the smallest.
The national average is approximately 18% (shown as dashed line). Figures show the share of taxable individuals in each state and territory with taxable income above $120,000 in 2022–23.
- Share earning $120k+
- 24%
- Share earning $180k+
- 9%
- vs national average ($120k+)
- 6pp
- Share earning $120k+
- 21%
- Share earning $180k+
- 9%
- vs national average ($120k+)
- 3pp
- Share earning $120k+
- 20%
- Share earning $180k+
- 8%
- vs national average ($120k+)
- 2pp
- Share earning $120k+
- 18%
- Share earning $180k+
- 5%
- vs national average ($120k+)
- 0pp
- Share earning $120k+
- 18%
- Share earning $180k+
- 7%
- vs national average ($120k+)
- 0pp
- Share earning $120k+
- 17%
- Share earning $180k+
- 6%
- vs national average ($120k+)
- -1pp
- Share earning $120k+
- 13%
- Share earning $180k+
- 5%
- vs national average ($120k+)
- -5pp
- Share earning $120k+
- 11%
- Share earning $180k+
- 4%
- vs national average ($120k+)
- -7pp
Is $100,000 a high income in Australia?
A $100,000 salary sits around the 73rd to 74th percentile of the ATO taxable individuals dataset. This means it is higher than the income reported by about 73% of the 12.6 million people in that dataset. Measured against the ABS employee distribution, $100,000 is above the median of $74,100 but below the 75th percentile of about $110,604. It is an above-average income, but it falls below most official high-income thresholds.
How many Australians earn over $150,000?
The top 10% threshold is $156,592. This means roughly 1.26 million taxable individuals in the top decile earned above that amount in 2022–23. At $150,000, the income falls just inside the 89th to 90th percentile band, so a slightly larger group earned above $150,000 that year. This was around 1.3 million to 1.4 million people, or about 10% to 11% of the ATO dataset.
Section 04 · Top 5%
What salary puts an employee in the top 5% in Australia?
An employee needs to earn around $202,800 a year, or $3,900 a week, to reach the top 5% of employee earnings in Australia. This is an estimate based on ABS grouped data. It is not a directly published ABS figure, so it should be treated as a guide.
The ATO taxable income data shows a similar result. Its 95th percentile was $200,515 in 2022–23. The ABS and ATO datasets measure different groups and time periods, but both point to a figure of about $200,000.
A salary above $200,000 puts an employee near the top 5% under either measure. The $250,000 Division 293 threshold is still around $50,000 higher than this. Most top 5% earners do not pay this extra super tax. In practice, Division 293 applies closer to the top 2% to 3% of earners.
| ABS employee earnings vs ATO taxable income in Australia | ||
|---|---|---|
| Threshold | ABS employee earnings (Aug 2025) | ATO taxable income (2022–23) |
| Median (50th pctl) | $74,100 | $69,161* |
| Top 20% (80th pctl) | approx. $122,200 | $117,412 |
| Top 10% (90th pctl) | $156,000 | $156,592 |
| Top 5% (95th pctl) | approx. $202,800 | $200,515 |
| Top 1% (99th pctl) | n/a | $408,973 |
Source · ABS Employee Earnings, August 2025; ATO Taxation Statistics 2022–23.
Section 05 · Location matters
How location changes what counts as a high income
A high income can mean different things depending on location.
The 2021 Census recorded a median weekly household income of $2,077 in Greater Sydney, alongside median monthly mortgage repayments of $2,427 and median weekly rent of $470.
In the Rest of NSW, those figures were $1,434, $1,733 and $330. Sydney households earn more on average, but higher housing costs absorb a large share of that advantage.
Capital city — Greater Sydney
- Median household income
$2,077 per week, 2021 Census
- Median monthly mortgage
$2,427 per month
- Median weekly rent
$470 per week
Regional — Rest of New South Wales
- Median household income
$1,434 per week, 2021 Census
- Median monthly mortgage
$1,733 per month
- Median weekly rent
$330 per week
What does a $156,000 salary mean in Sydney versus regional NSW?
Earning $156,000 a year places an employee in the top 10% of Australian employee earnings. However, the value of that salary depends heavily on location.
In Sydney, higher mortgage repayments and rents can take up a larger share of income, which means $156,000 may not stretch as far as the national ranking suggests. In regional NSW, the same income can go further where housing costs are lower.
That does not mean $156,000 is ordinary in Sydney. It still sits above the earnings of 90% of Australian employees. The key point is that a national income ranking and the day-to-day value of that salary can look different, and both can be true.
Section 06 · Historical trend
How the high-income threshold has changed over time
The Fair Work high-income threshold has risen from $108,300 in 2009–10 to $183,100 in 2025–26. That is a 69.1% increase over 16 years. Over the past decade, from 2015–16 to 2025–26, the threshold increased by $46,400, or 33.9%.
The two largest annual increases came in recent years. The threshold rose by $7,500 in 2024–25 and by $8,100 in 2025–26.
| Fair Work high income threshold in Australia by year | ||
|---|---|---|
| Financial year | Threshold | Change from prior year |
| 2009–10 | $108,300 | Base year |
| 2010–11 | $113,800 | +$5,500 (+5.1%) |
| 2011–12 | $118,100 | +$4,300 (+3.8%) |
| 2012–13 | $123,300 | +$5,200 (+4.4%) |
| 2013–14 | $129,300 | +$6,000 (+4.9%) |
| 2014–15 | $133,000 | +$3,700 (+2.9%) |
| 2015–16 | $136,700 | +$3,700 (+2.8%) |
| 2016–17 | $138,900 | +$2,200 (+1.6%) |
| 2017–18 | $142,000 | +$3,100 (+2.2%) |
| 2018–19 | $145,400 | +$3,400 (+2.4%) |
| 2019–20 | $148,700 | +$3,300 (+2.3%) |
| 2020–21 | $153,600 | +$4,900 (+3.3%) |
| 2021–22 | $158,500 | +$4,900 (+3.2%) |
| 2022–23 | $162,000 | +$3,500 (+2.2%) |
| 2023–24 | $167,500 | +$5,500 (+3.4%) |
| 2024–25 | $175,000 | +$7,500 (+4.5%) |
| 2025–26 | $183,100 | +$8,100 (+4.6%) |
| Total change 2009–10 to 2025–26 | +$74,800 | +69.1% |
Source · Fair Work Commission, high income threshold history 2009–10 to 2025–26.
At the top of the employee pay range, the 90th percentile rose from $2,500 a week in August 2020 to $3,000 a week in August 2025, a 20% increase over five years. In the most recent year, it fell by 1.3%, down from $3,040 in August 2024.
Separately, the Division 293 threshold was lowered from $300,000 to $250,000 in 2017–18 and has not changed since. As wages have risen while the threshold has stayed fixed, more high earners now sit above the $250,000 line than when the threshold was first introduced.
How has the gender pay gap in taxable income changed?
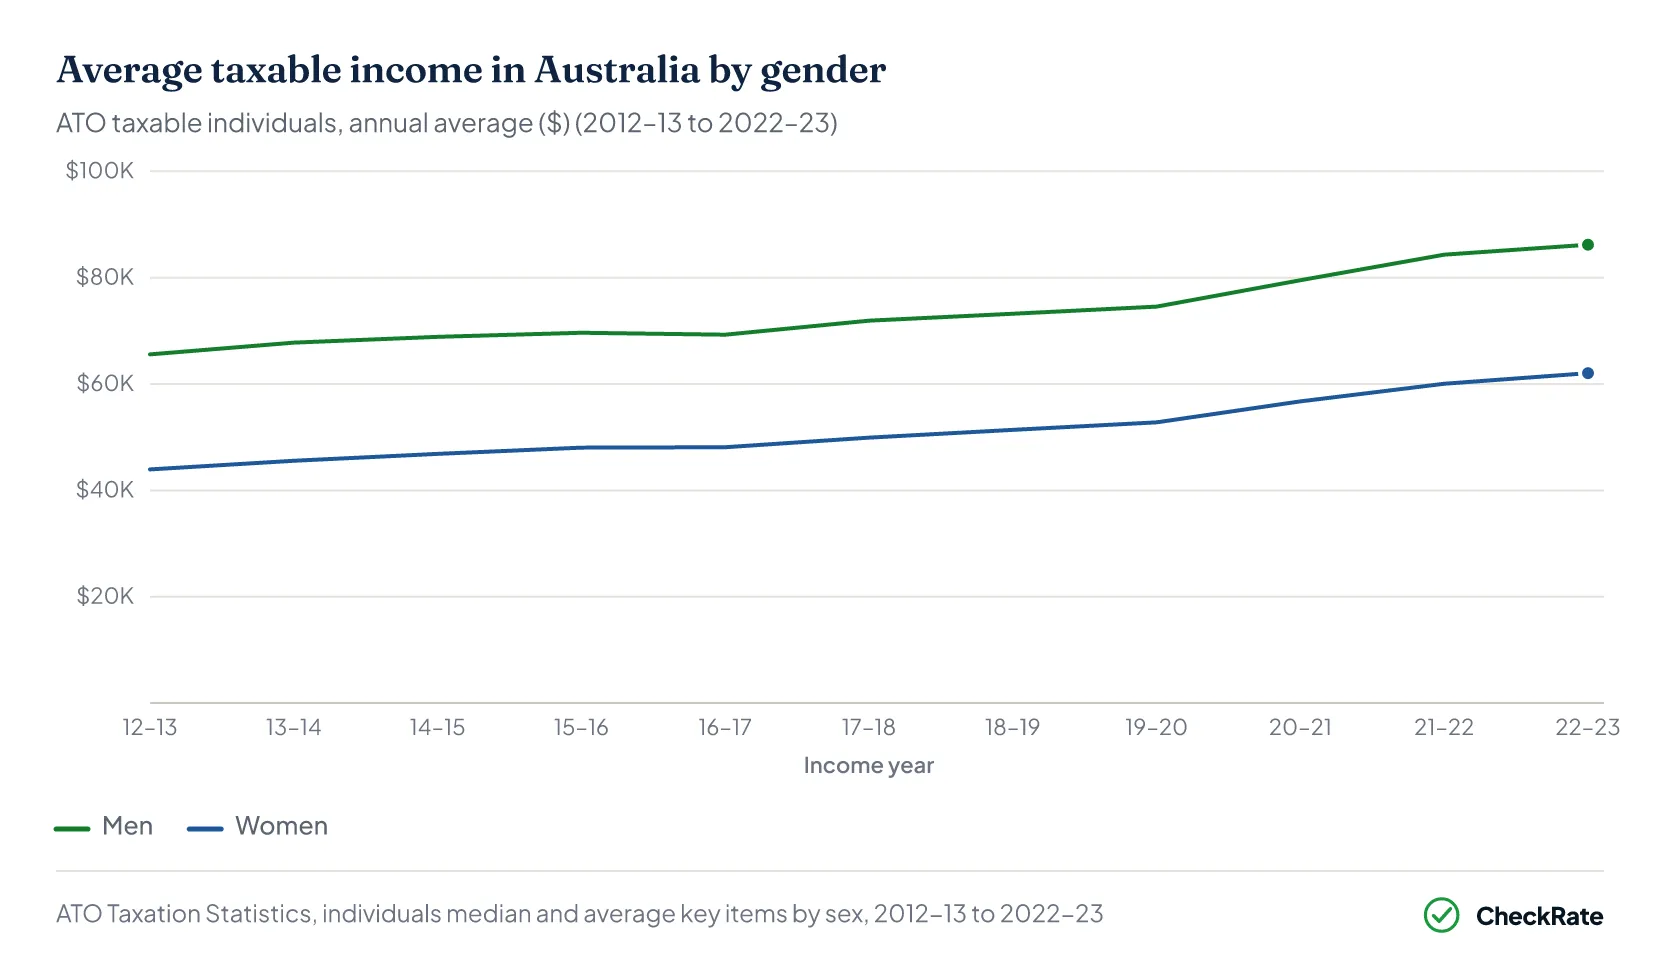
The gap in average taxable income between men and women has narrowed slightly as a percentage, but widened in dollar terms. In 2022–23, average taxable income was $86,199 for men and $62,046 for women. That was a gap of $24,153. A decade earlier, in 2012–13, average taxable income was $65,578 for men and $43,944 for women. That was a gap of $21,634.
Are more Australians moving into higher tax brackets?
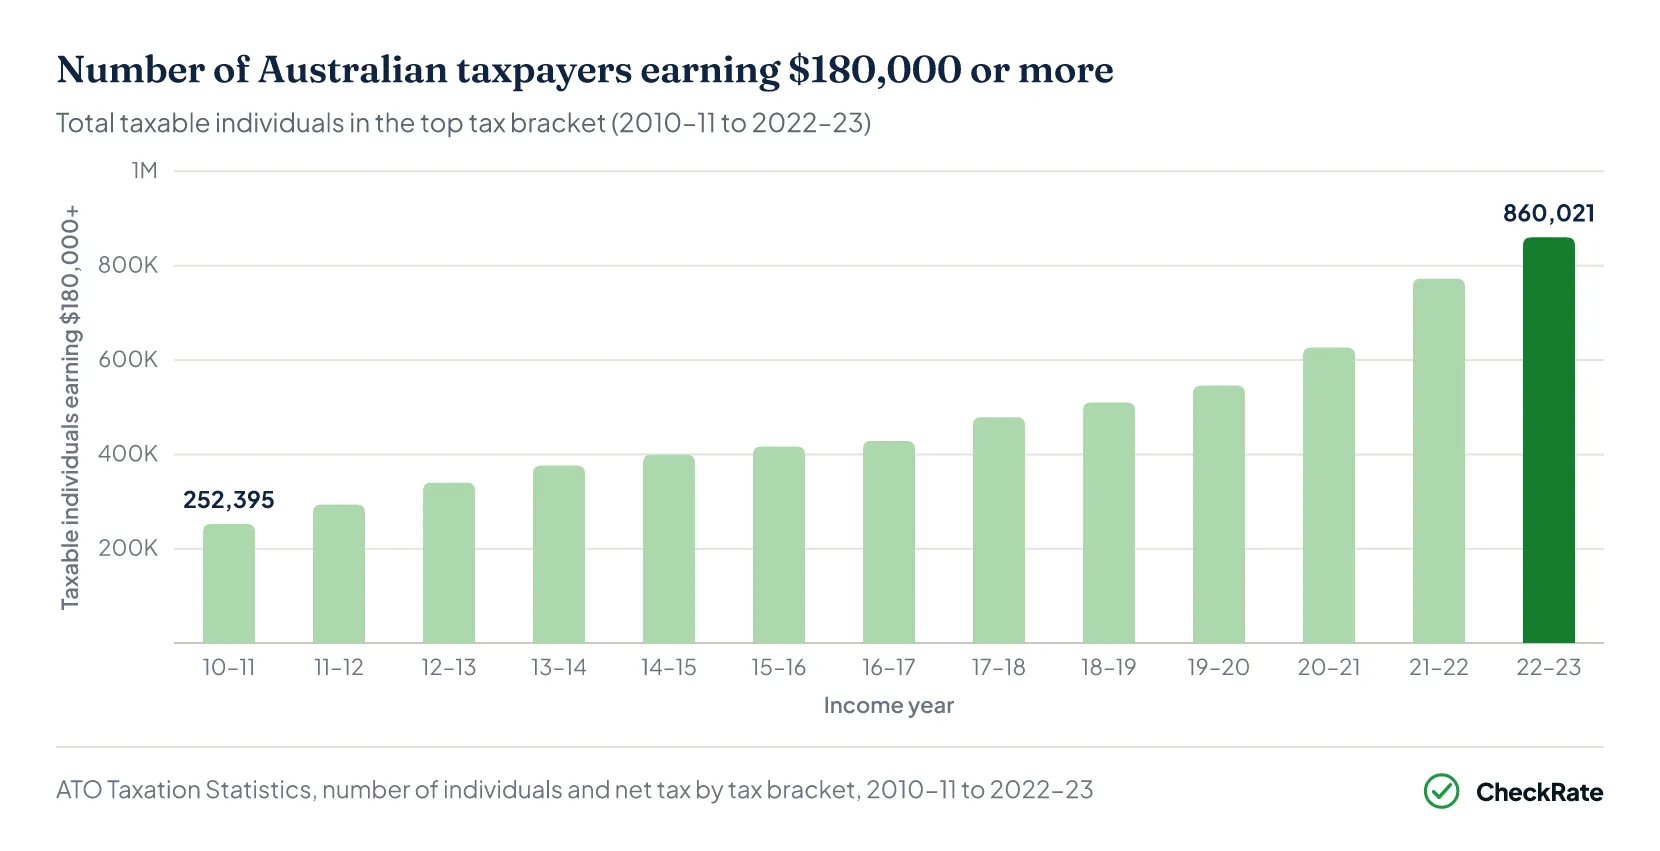
The number of taxable individuals earning above $180,000 grew from 252,395 in 2010–11 to 860,021 in 2022–23, a rise of 241%. Over the same period, the total taxable population grew by just 27%. The share of taxpayers in the top bracket climbed from 2.0% to 5.3%.
Some of this growth reflects real wage increases. Bracket creep also plays a role. This happens when wages rise in dollar terms, often because of inflation, and more taxpayers move into higher tax brackets even if their spending power has not increased by the same amount.
The Stage 3 tax cuts from 1 July 2024 partly addressed this by reducing the 32.5% marginal tax rate to 30% and changing some bracket thresholds. However, the longer-term trend shows more Australians moving into higher tax brackets over time.
What are the current income tax brackets in Australia for 2025–26?
Following the Stage 3 tax cuts from 1 July 2024, the 2025–26 income tax rates are: • 0% on income up to $18,200 • 16% on income from $18,201 to $45,000 • 30% on income from $45,001 to $135,000 • 37% on income from $135,001 to $190,000 • 45% on income above $190,000 Most taxpayers also pay the 2% Medicare levy. The main change was the reduction in the tax rate for income between $45,001 and $135,000. This rate fell from 32.5% to 30%.
How does the gender pay gap affect the definition of "high income"?
In 2022–23, the average taxable income for men was $86,199. For women, it was $62,046, meaning the male average was 39% higher. As a result, the same salary can sit in a different place depending on which group is being compared. About 25% of male taxable individuals earned more than $120,000, compared with about 12% of female taxable individuals.
Section 07 · Income vs wealth
High income vs high wealth in Australia
Income and wealth are different measures, and the data show a clear gap between them.
Average household net worth was $1.04 million in 2019–20, but the median sat at $579,200. This gap shows that wealth is concentrated more heavily at the top.
The Gini coefficient, which measures inequality on a scale from 0 to 1, also shows this difference. Household net worth had a Gini coefficient of 0.606 in 2022–23, compared with 0.307 for income. This means wealth is distributed roughly twice as unevenly as income in Australia.
Income — individual taxable income, ATO 2022–23
- Average taxable income
$74,240 — all 16.1M individual returns
- Median taxable income
$55,868 — half of all filers earn below this
- Income Gini
0.307 (2022–23, ABS)
- Avg vs median gap
33% — average is 33% above median
Wealth — household net worth, ABS 2019–20
- Average household net worth
$1.04m — all households including zero-wealth
- Median household net worth
$579,200 — 75% of households had some debt
- Wealth Gini
0.606 (2022–23, ABS)
- Avg vs median gap
80% — average is 80% above median
Is high income the same as wealth in Australia?
A high income and wealth are not always the same thing. A household with two strong salaries and a large mortgage may rank well on income while having relatively little net wealth.
A retiree may have a modest current income but hold substantial assets in property and superannuation.
Annual taxable income can also rise in a single year due to a property sale, a redundancy payment or a capital gain. This may not reflect a person's usual earnings. For this reason, income data from one year should not be treated as a permanent measure of financial status.
Can someone have a high income but low wealth?
Yes. A person who has recently moved into a well-paying role may still have student debt, a large mortgage, or both. Their income may put them in the top 10%, but their net worth, meaning assets minus debts, could still sit below the national median of $579,200. This is especially common among younger professionals in high-cost cities such as Sydney, where salaries and housing costs are both high.
Why is wealth inequality so much higher than income inequality?
Income is earned from year to year and is spread more broadly through wages. Wealth builds over a lifetime through property growth, investment returns, superannuation and business ownership. It also tends to grow faster for people who already have more. The wealth Gini of 0.606, compared with the income Gini of 0.307, reflects this compounding effect. For most Australian households, the family home is the largest single asset. As property prices have grown faster than wages over the past two decades, homeownership has become more concentrated among older and higher-income groups.
Find your position in the income distribution
Enter a gross (before-tax) income to see where it sits among 12.6 million Australians with a taxable income. Based on ATO data for 2022–23.
Income percentile finder
See where your gross income sits among Australian taxable individuals — your percentile, how many people earn less and more, and which milestones you have passed.
References
- Fair Work Commission: High Income Threshold Amounts · library.fairwork.gov.au
- ATO, Division 293 tax on concessional contributions by high-income earners (QC36272) · ato.gov.au
- ATO, Tax rates – Australian resident (QC 73320) · ato.gov.au
- ABS Employee Earnings, August 2025 (Cat. No. 6333.0) · Australian Bureau of Statistics
- ATO, Taxation statistics 2022-23, Individuals Table 16: percentile distribution of taxable individuals, by taxable income and sex · ato.gov.au
- ABS 2021 Census QuickStats: median household income, mortgage and rent, Greater Sydney and Rest of NSW · Australian Bureau of Statistics
- ABS Household Income and Wealth, Australia, 2019-20 · Australian Bureau of Statistics
- ABS Measuring What Matters: Household Income and Wealth · Australian Bureau of Statistics