


Published
Section 01 · December 2025 headline
What share of Australian business credit came from non-bank lenders in December 2025?
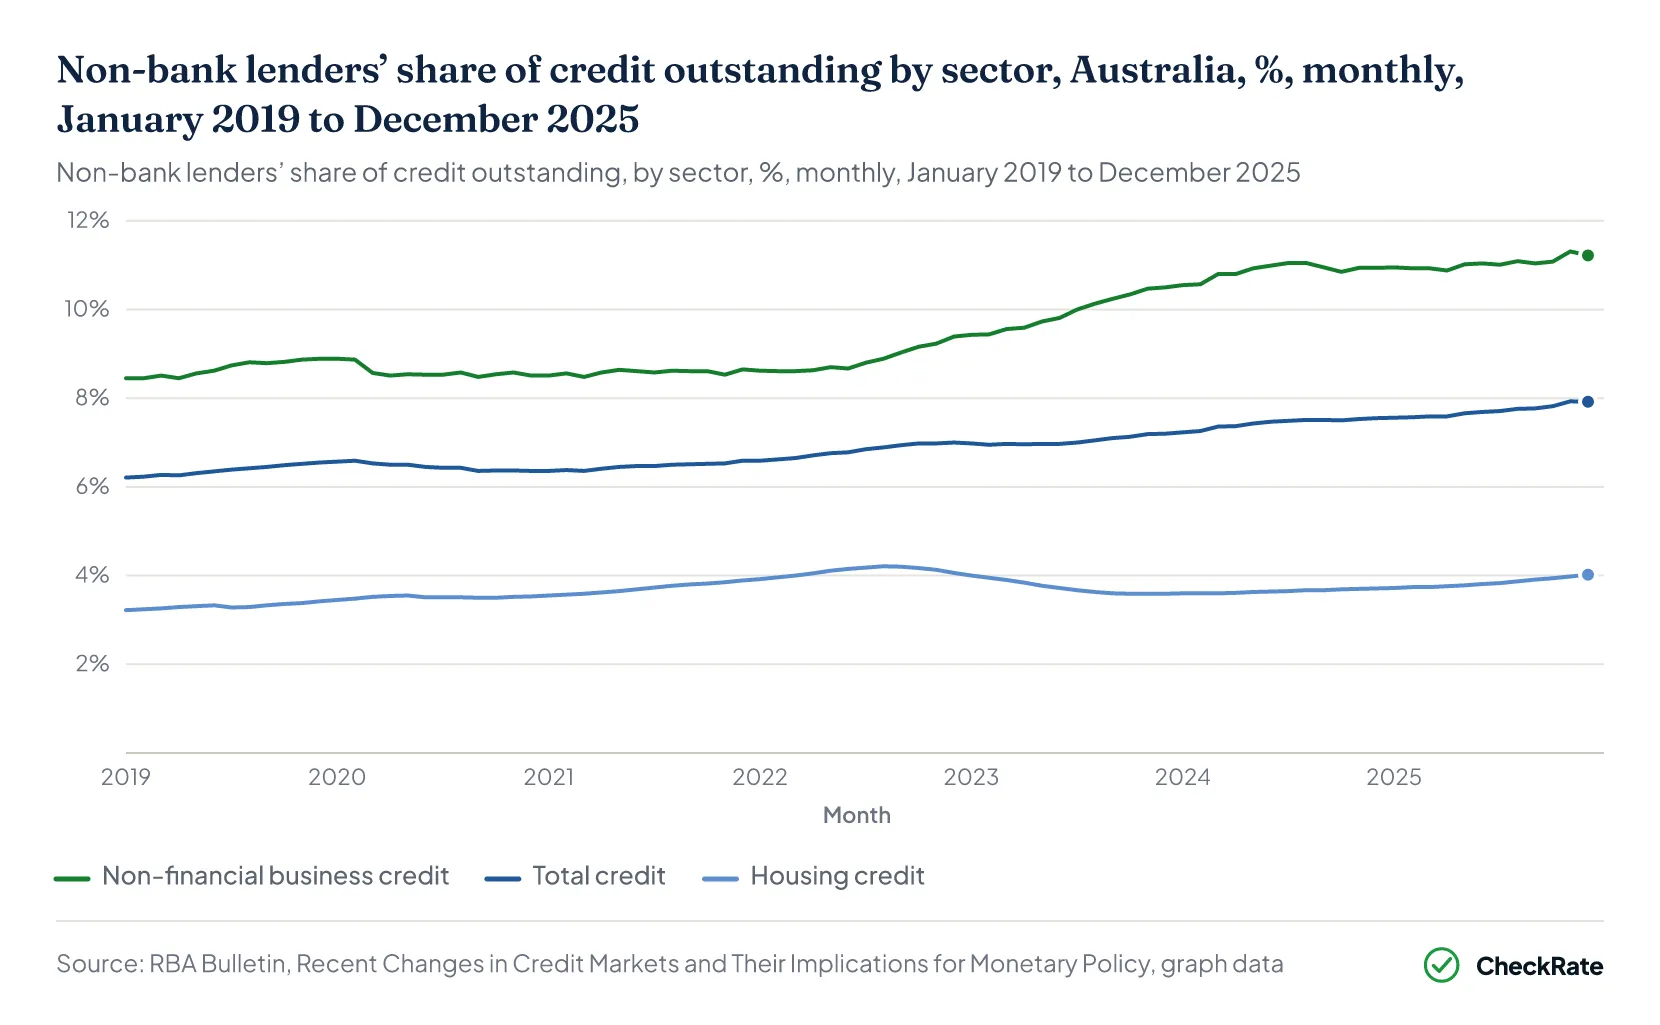
Non-bank lenders accounted for 11.2% of non-financial business credit in Australia in December 2025, according to the Reserve Bank of Australia (RBA)1. Their share of housing credit was 4.0% and their share of total credit was 7.9%.
The RBA's total credit measure includes housing, non-financial business and personal credit1.
These sector shares use the RBA's financial aggregates measure, which is seasonally adjusted and adjusted for breaks in reporting1.
In January 2019, non-bank lenders accounted for 8.4% of non-financial business credit, 3.2% of housing credit and 6.2% of total credit1.
The non-bank share of non-financial business credit reached 11.3% in November 2025, the highest monthly share among the 84 months from January 2019 to December 20251.
The RBA states that the non-bank share of business lending has grown strongly since 2022, especially for smaller loans to small and medium enterprises1.
| Non-bank lenders' share of credit outstanding by sector, Australia, %, January 2019, December 2022 and December 2025 | |||
|---|---|---|---|
| Sector | January 2019 (%) | December 2022 (%) | December 2025 (%) |
| Non-financial business credit | 8.4 | 9.4 | 11.2 |
| Housing credit | 3.2 | 4.1 | 4.0 |
| Total credit | 6.2 | 7.0 | 7.9 |
Source · RBA, Bulletin, February 2026, Graph 11 data.
Section 02 · By business size
Which business loan segment in Australia had the highest non-bank share in December 2025?
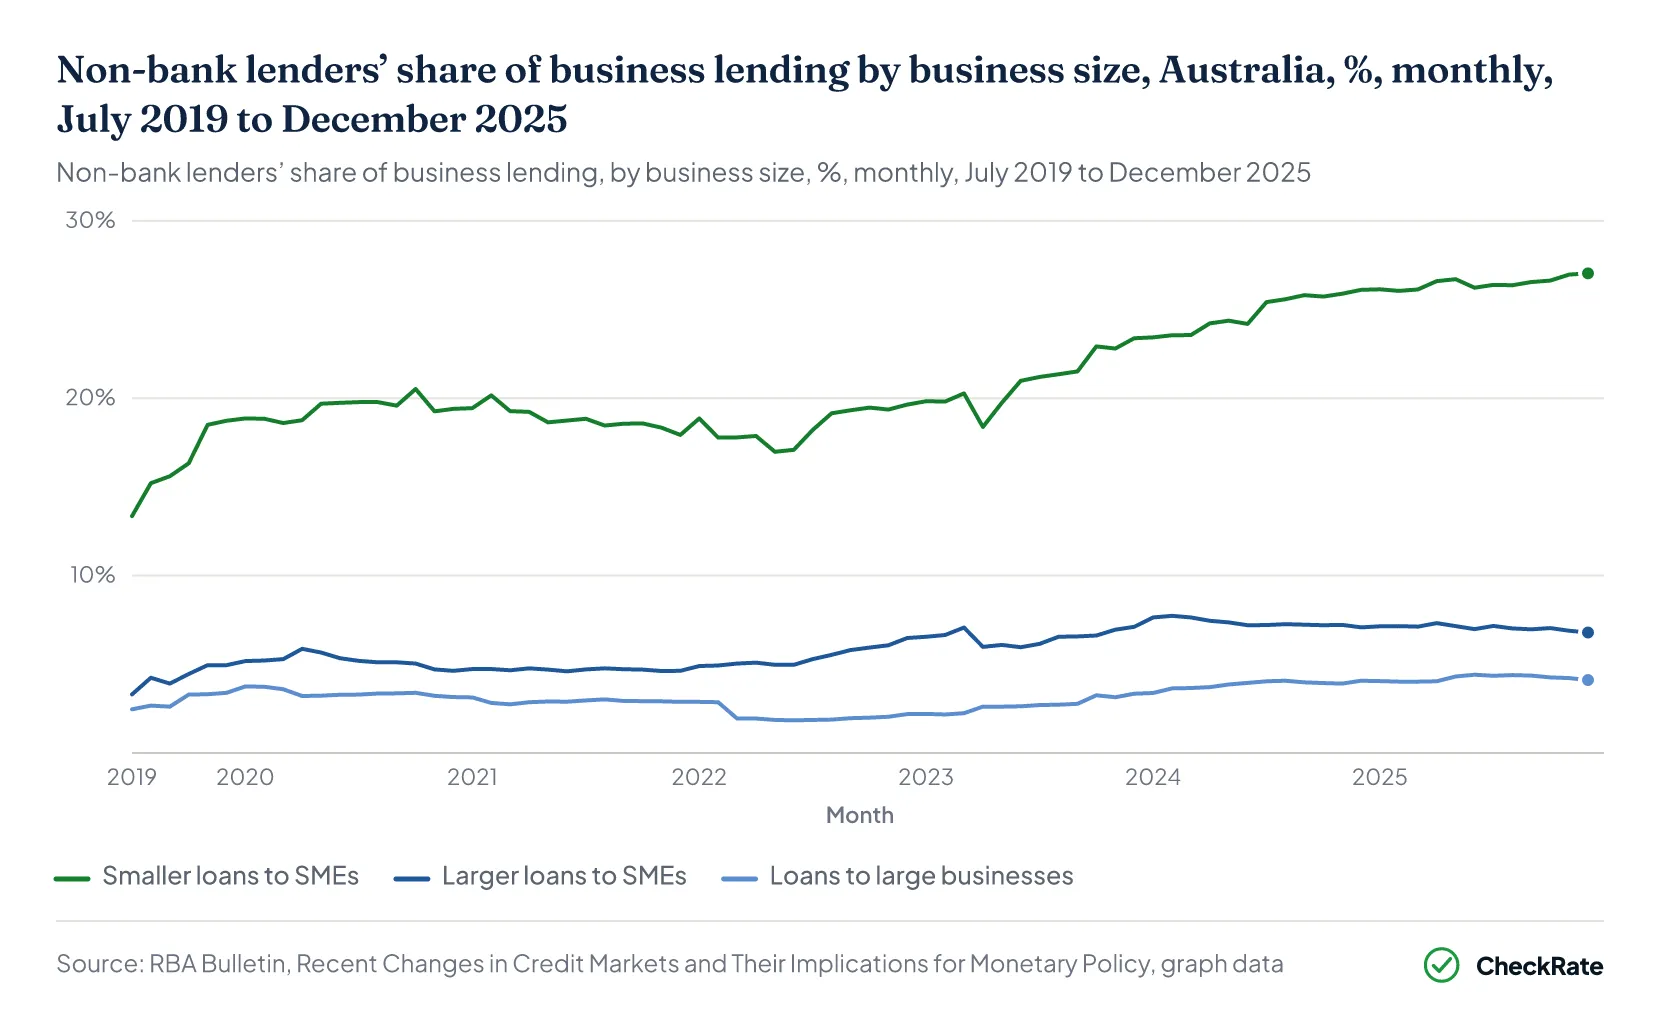
Smaller loans to small and medium enterprises (SMEs) had the highest non-bank share in December 2025, at 27.0%1. The share was 6.8% for larger SME loans and 4.1% for loans to large businesses.
For these figures, small and medium enterprises are businesses with annual revenue of less than $75 million2. Smaller loans to SMEs are those where the lender's total exposure to the business is less than $1.5 million. Larger loans to SMEs are lender exposures of $1.5 million or more, and large businesses have annual revenue of $75 million or more.
The shares by business size exclude loans to financial businesses and are not seasonally adjusted or adjusted for breaks1.
The RBA also reports business loans outstanding across the three segments, for lenders with $2 billion or more of business credit2. In August 2025, smaller loans to SMEs totalled $168.0 billion, larger loans to SMEs totalled $514.6 billion and loans to large businesses totalled $545.3 billion. Smaller loans to SMEs accounted for 13.7% of the $1,228.0 billion across the three segments.
| Non-bank lenders' share of business lending outstanding by segment, Australia, %, July 2019, December 2022 and December 2025 | |||
|---|---|---|---|
| Segment | July 2019 (%) | December 2022 (%) | December 2025 (%) |
| Smaller loans to SMEs | 13.3 | 19.6 | 27.0 |
| Larger loans to SMEs | 3.3 | 6.5 | 6.8 |
| Loans to large businesses | 2.5 | 2.2 | 4.1 |
Source · RBA, Bulletin, February 2026, Graph 11 data.
| Business loans outstanding by segment, lenders with $2 billion or more of business credit, Australia, $ billion, August 2025 | ||
|---|---|---|
| Segment | Loans outstanding ($ billion) | Share of the three segments (%) |
| Smaller loans to SMEs | 168.0 | 13.7 |
| Larger loans to SMEs | 514.6 | 41.9 |
| Loans to large businesses | 545.3 | 44.4 |
| Three segments | 1,228.0 | 100.0 |
Source · RBA, Bulletin, October 2025, Graph 8 data; RBA, Statistical Table D2.
Lending outstanding to small and medium businesses by size and industry is set out in the SME lending statistics article.
Section 03 · Since 2019
How has the non-bank share of business lending in Australia changed since 2019?
The non-bank share of non-financial business credit rose from 8.4% in January 2019 to 11.2% in December 2025, an increase of 2.8 percentage points1. Between January 2022 and December 2025, the non-bank share of non-financial business credit rose from 8.6% to 11.2%.
The non-bank share of smaller loans to SMEs rose from 13.3% in July 2019 to 27.0% in December 2025, an increase of 13.7 percentage points1. Over the same period, the share of larger SME loans rose from 3.3% to 6.8%, while the share of loans to large businesses rose from 2.5% to 4.1%. Between January 2022 and December 2025, the non-bank share of smaller loans to SMEs rose from 18.9% to 27.0%.
The share of larger SME loans reached a monthly high of 7.7% in February 2024 among the 78 months from July 2019 to December 20251. The share of loans to large businesses reached a monthly low of 1.8% in June 2022.
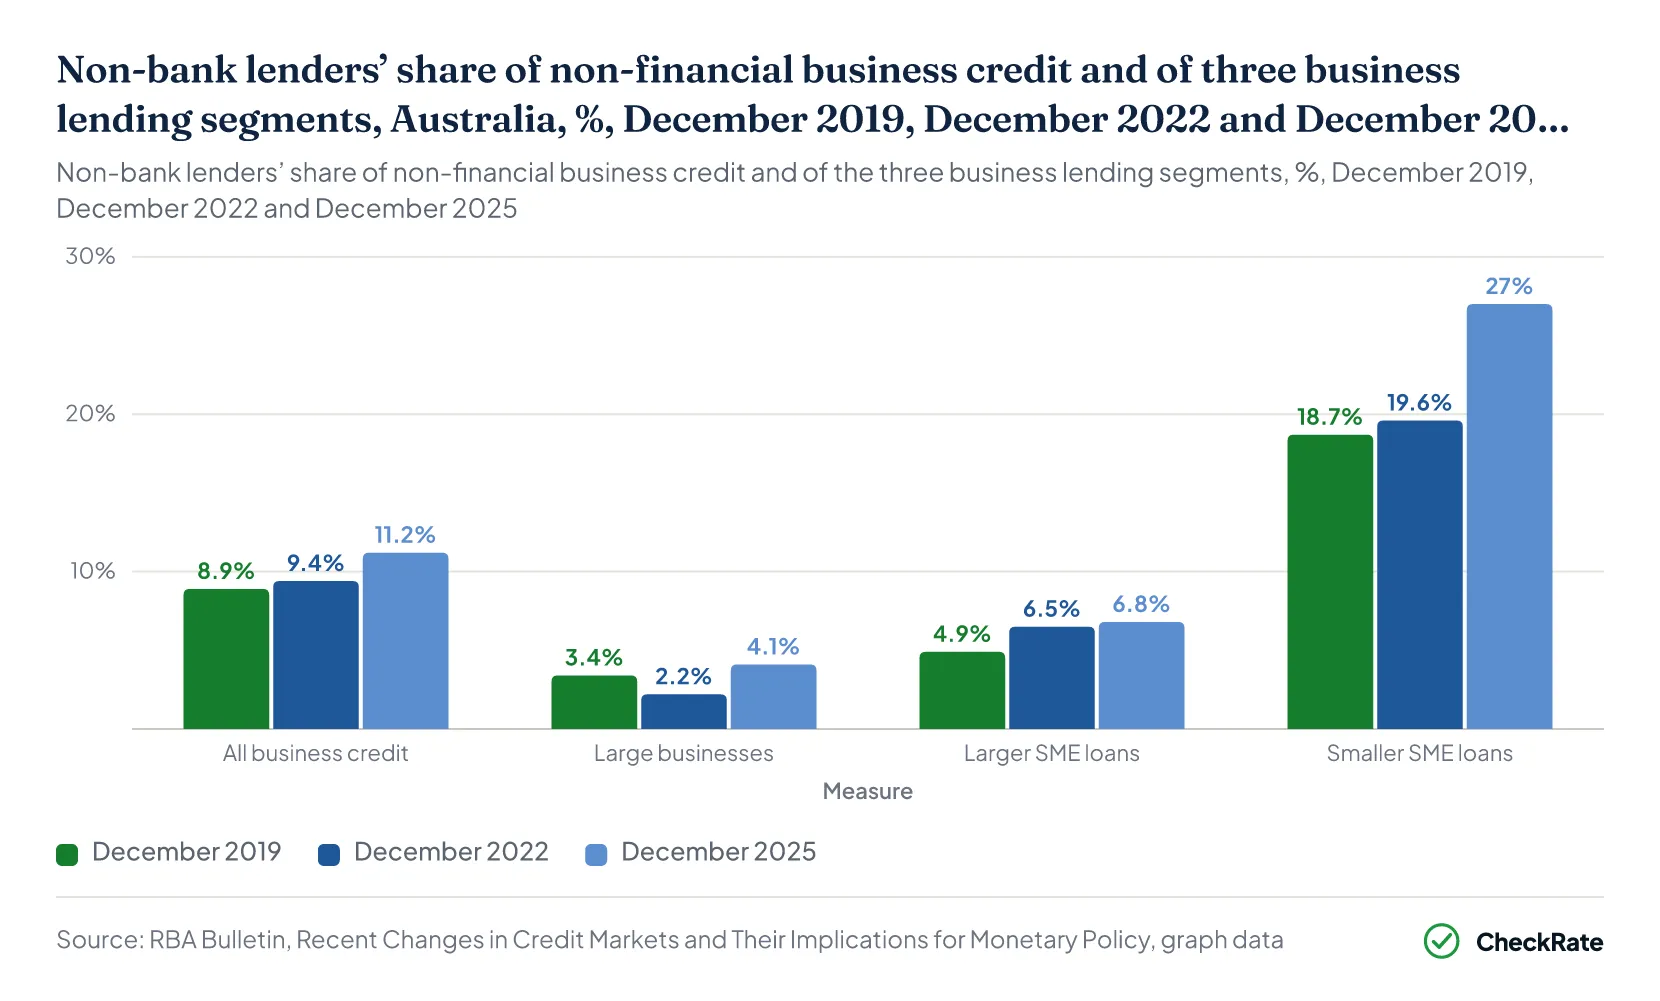
| Non-bank lenders' share of credit and of business lending outstanding, Australia, %, December of each year, 2019 to 2025 | ||||||
|---|---|---|---|---|---|---|
| Month | Non-financial business credit (%) | Housing credit (%) | Total credit (%) | Loans to large businesses (%) | Larger loans to SMEs (%) | Smaller loans to SMEs (%) |
| December 2019 | 8.9 | 3.4 | 6.6 | 3.4 | 4.9 | 18.7 |
| December 2020 | 8.5 | 3.5 | 6.4 | 3.2 | 4.6 | 19.4 |
| December 2021 | 8.6 | 3.9 | 6.6 | 2.9 | 4.6 | 17.9 |
| December 2022 | 9.4 | 4.1 | 7.0 | 2.2 | 6.5 | 19.6 |
| December 2023 | 10.5 | 3.6 | 7.2 | 3.3 | 7.1 | 23.4 |
| December 2024 | 10.9 | 3.7 | 7.5 | 4.1 | 7.1 | 26.1 |
| December 2025 | 11.2 | 4.0 | 7.9 | 4.1 | 6.8 | 27.0 |
Source · RBA, Bulletin, February 2026, Graph 11 data.
Section 04 · Credit outstanding
How much non-financial business credit is outstanding in Australia?
Non-financial business credit outstanding in Australia was $1,440.6 billion in July 20263. The RBA's break-adjusted growth rate was 10.6% over the 12 months to July 2026 and 0.9% for the month4.
Non-financial business credit was $1,303.2 billion in July 2025 and $858.7 billion in July 20193.
The credit levels are not adjusted for breaks in reporting. The published growth rates are adjusted, and the RBA describes them as a better measure of change3.
Owner-occupier housing credit was $1,764.7 billion in July 2026, the largest of the four components of total credit excluding financial businesses3. Investor housing credit was $868.5 billion and other personal credit was $166.6 billion. Together with non-financial business credit, these brought total credit excluding financial businesses to $4,240.4 billion. Its break-adjusted growth rate was 8.4% over the 12 months to July 20264.
Non-financial business credit recorded the fastest 12-month growth rate among the four components of total credit excluding financial businesses in July 2026, at 10.6%, compared with 10.1% for investor housing credit and 6.1% for owner-occupier housing credit4.
The RBA's business credit measure grew at a six-month annualised rate of 10.7% in December 2025, compared with an average of 3.9% since the global financial crisis (GFC), cited in the RBA's February 2026 Bulletin article1. Business credit accounted for 33.5% of total credit in December 2025.
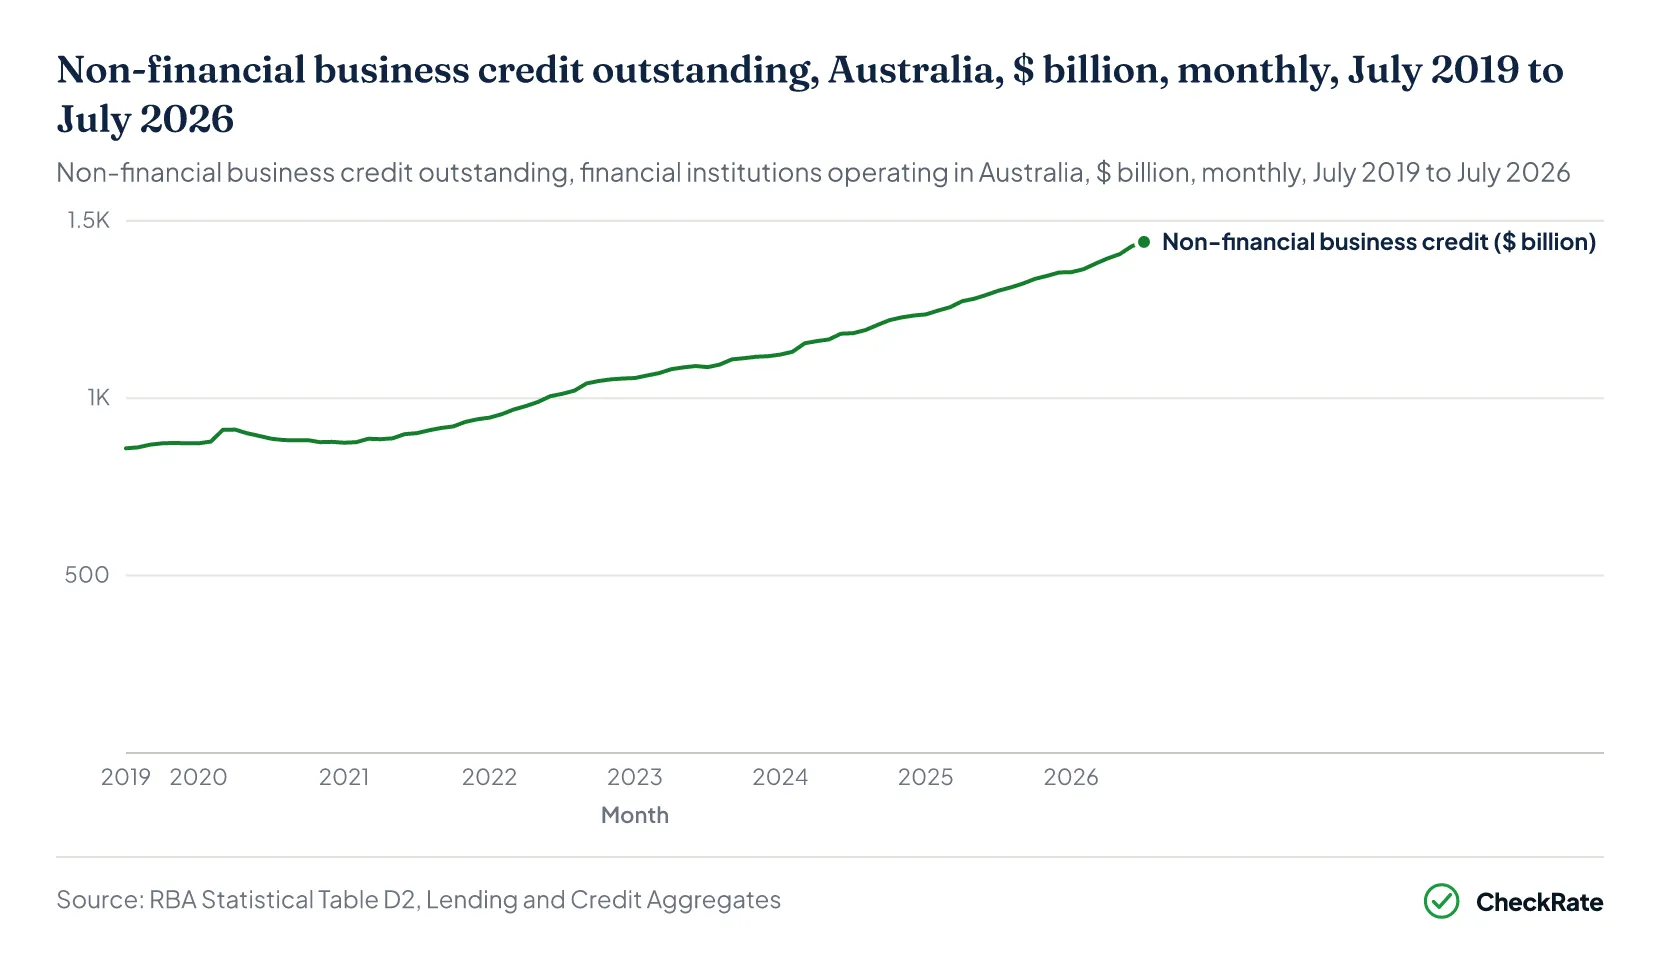
| Credit outstanding by sector and the RBA's 12-month growth rate, Australia, $ billion and %, July 2025 and July 2026 | |||
|---|---|---|---|
| Sector | July 2025 ($ billion) | July 2026 ($ billion) | 12-month growth to July 2026 (%) |
| Owner-occupier housing | 1,658.8 | 1,764.7 | 6.1 |
| Investor housing | 789.5 | 868.5 | 10.1 |
| Other personal | 156.6 | 166.6 | 4.7 |
| Non-financial business | 1,303.2 | 1,440.6 | 10.6 |
| Total credit excluding financial businesses | 3,908.1 | 4,240.4 | 8.4 |
Source · RBA, Statistical Tables D2 (levels) and D1 (growth), published 31 August 2026.
The interest rates businesses pay on their loans are set out in the business loan interest rates article.
Section 05 · System size
How large are non-bank lenders in Australia's financial system?
Non-bank lenders accounted for 6% of financial system assets in Australia, according to the RBA's March 2026 Financial Stability Review5. Available estimates put private credit at less than 2% of financial system assets.
The RBA reported strong growth in non-bank business and housing lending, supported by favourable capital-market funding conditions up to early 20265. Funding conditions for non-bank lenders tightened in March 2026 as financial market volatility increased.
The RBA reported in March 2023 that registered financial corporations accounted for about half of non-bank lenders' assets in Australia6.
| Measures of the size of non-bank lending in Australia, RBA figures published February and March 2026 | ||
|---|---|---|
| Measure | Value | RBA source |
| Non-bank lenders' share of financial system assets | 6% | Financial Stability Review, March 2026 |
| Private credit share of financial system assets, available estimates | Less than 2% | Financial Stability Review, March 2026 |
| Private credit outstanding, RBA estimate, December 2025 | Around $50 billion | Bulletin, February 2026 |
| Non-bank share of total credit, December 2025 | 7.9% | Bulletin, February 2026, Graph 11 data |
| Non-bank share of non-financial business credit, December 2025 | 11.2% | Bulletin, February 2026, Graph 11 data |
| Non-bank share of housing credit, December 2025 | 4.0% | Bulletin, February 2026, Graph 11 data |
Source · RBA, Financial Stability Review, March 2026; RBA, Bulletin, February 2026.
Section 06 · Definitions
Which lenders count as non-bank lenders in Australia?
A non-bank lender is a lender that is restricted from offering deposits5. Non-bank lending is undertaken by registered financial corporations and by some managed investment funds, including hedge funds6.
Non-bank corporations that extend credit and have debt assets of more than $50 million must register with the Australian Prudential Regulation Authority (APRA) as registered financial corporations and report their financial position and lending activity6.
Registered financial corporations fall into two groups6. Securitisers originate loans and package them into asset-backed securities, while non-securitisers keep the loans on their balance sheets. Registered financial corporations lend mainly for residential housing and cars, but also lend to businesses and commercial property developers.
The RBA states that many non-bank lenders specialise in segments where banks are less active or inactive, including automotive finance, unsecured SME finance and early-stage construction finance1. Non-bank lenders face fewer prudential regulatory constraints than banks because they do not take deposits.
Private credit is a form of non-bank lending typically facilitated by asset managers and funded by investors such as superannuation funds, insurance firms and family offices1. It typically provides lending to larger businesses.
| Types of non-bank lender in Australia as the RBA describes them, 2023 and 2026 | |||
|---|---|---|---|
| Type | What it does | Main lending | How it is funded |
| Registered financial corporation, securitiser | Originates loans and packages them into asset-backed securities | Residential mortgages and car loans | Warehouse facilities during origination, then the securitisation market |
| Registered financial corporation, non-securitiser | Keeps loans on its balance sheet | Includes property development, personal lending and some business lending | Mostly loans and equity, including from specialist lenders, high net worth individuals and family offices |
| Managed investment fund, including private credit | Acts as an asset manager lending on behalf of investors | Typically larger businesses; concentrated in real estate | Investors such as superannuation funds, insurance firms and family offices |
Source · RBA, Bulletin, March 2023, Non-bank Lending in Australia and the Implications for Financial Stability; RBA, Bulletin, February 2026.
Commercial property exposures of banks and other deposit-taking institutions are set out in the commercial property lending statistics article.
Section 07 · Data coverage
What does official data on non-bank business lending in Australia not cover?
The RBA states that its figures likely underestimate the non-bank share of lending, particularly in areas where smaller non-bank lenders are more active, such as SME lending. Its more detailed collections cover only lenders with $2 billion or more of business loans1. Most non-bank lenders are registered financial corporations subject to reporting requirements, but some lenders are not well captured by current reporting frameworks.
The credit aggregates cover credit provided by financial institutions operating in Australia but do not include cross-border or non-intermediated lending3. From April 2023, lending to warehouse trusts was removed from business credit to avoid double counting loans from non-bank lenders that are separately included in housing or business credit.
The RBA also states that publication of the credit aggregates and some other statistical tables may be delayed while the Direct to APRA reporting system is decommissioned4.
Section 08
Non-bank business lending: quick answers
Is non-bank business lending growing in Australia?
Non-bank lenders' share of non-financial business credit rose from 8.4% in January 2019 to 11.2% in December 2025. The RBA also states that non-bank business lending has grown strongly since 2022, particularly for smaller loans to small and medium enterprises.
Which businesses borrow most from non-bank lenders?
Smaller loans to small and medium enterprises, where the lender's exposure is less than $1.5 million, had the highest non-bank share of the three business lending segments the RBA reports, at 27.0% in December 2025. Larger loans to SMEs had a non-bank share of 6.8%, compared with 4.1% for loans to large businesses.
How fast is non-financial business credit growing in Australia?
The RBA's break-adjusted growth rate for non-financial business credit was 10.6% over the 12 months to July 2026, when $1,440.6 billion was outstanding. The RBA's business credit measure grew at a six-month annualised rate of 10.7% in December 2025, compared with its post-GFC average of 3.9%.
What is the difference between a bank and a non-bank lender?
A non-bank lender is restricted from offering deposits, and non-bank lending is undertaken by registered financial corporations and by some managed investment funds. Non-bank corporations that extend credit and have debt assets of more than $50 million must register with APRA and report their lending. The RBA states that non-bank lenders face fewer prudential regulatory constraints than banks because they do not take deposits.
How big is private credit in Australia?
The RBA estimates private credit outstanding at around $50 billion in December 2025 but notes gaps in the available data. The RBA's Financial Stability Review of March 2026 states that available estimates put private credit at less than 2% of financial system assets.
References
- RBA Bulletin, Recent Changes in Credit Markets and Their Implications for Monetary Policy · Reserve Bank of Australia ↑ b c d e f g h i j k l m n o p q r s t u
- RBA Bulletin, Small Business Economic and Financial Conditions · Reserve Bank of Australia ↑ b c d
- RBA, Lending and Credit Aggregates, Statistical Table D2 · Reserve Bank of Australia ↑ b c d e
- RBA, Growth in Selected Financial Aggregates, Statistical Table D1 · Reserve Bank of Australia ↑ b c d
- RBA, Financial Stability Review, March 2026, chapter 3: Resilience of the Australian Financial System · Reserve Bank of Australia ↑ b c
- RBA Bulletin, Non-bank Lending in Australia and the Implications for Financial Stability · Reserve Bank of Australia ↑ b c d e
- ABS, Lending Indicators, June quarter 2026 · Australian Bureau of Statistics ↑