

Published
Section 01 · March 2026
How much commercial property lending do Australian banks have outstanding?
Authorised deposit-taking institutions (ADIs) had $487.6 billion of commercial property exposures at 31 March 2026, according to the Australian Prudential Regulation Authority (APRA)1. Exposures grew by $39.2 billion, or 8.7%, over the year to 31 March 2026, and by $7.5 billion, or 1.6%, over the March 2026 quarter. The March 2026 figures cover 120 reporting institutions.
Commercial property exposure limits, which include undrawn commitments, were $525.8 billion at 31 March 2026, $38.2 billion above actual exposures of $487.6 billion1.
Exposures located in Australia totalled $442.7 billion at 31 March 2026, or 90.8% of total commercial property exposures1. Overseas exposures totalled $44.9 billion, or 9.2%, at the same date.
APRA defines commercial property exposures as "facilities for the development, acquisition and improvement of real estate, where the servicing and repayment of the facility is dependent on cash flows generated by the property itself or other properties owned by the borrower"2. Home loans to owner-occupiers and loans to individuals investing in residential property are excluded, as are loans to construction companies that are repaid by third parties.
Section 02 · By sector
Which property sectors do banks lend most to?
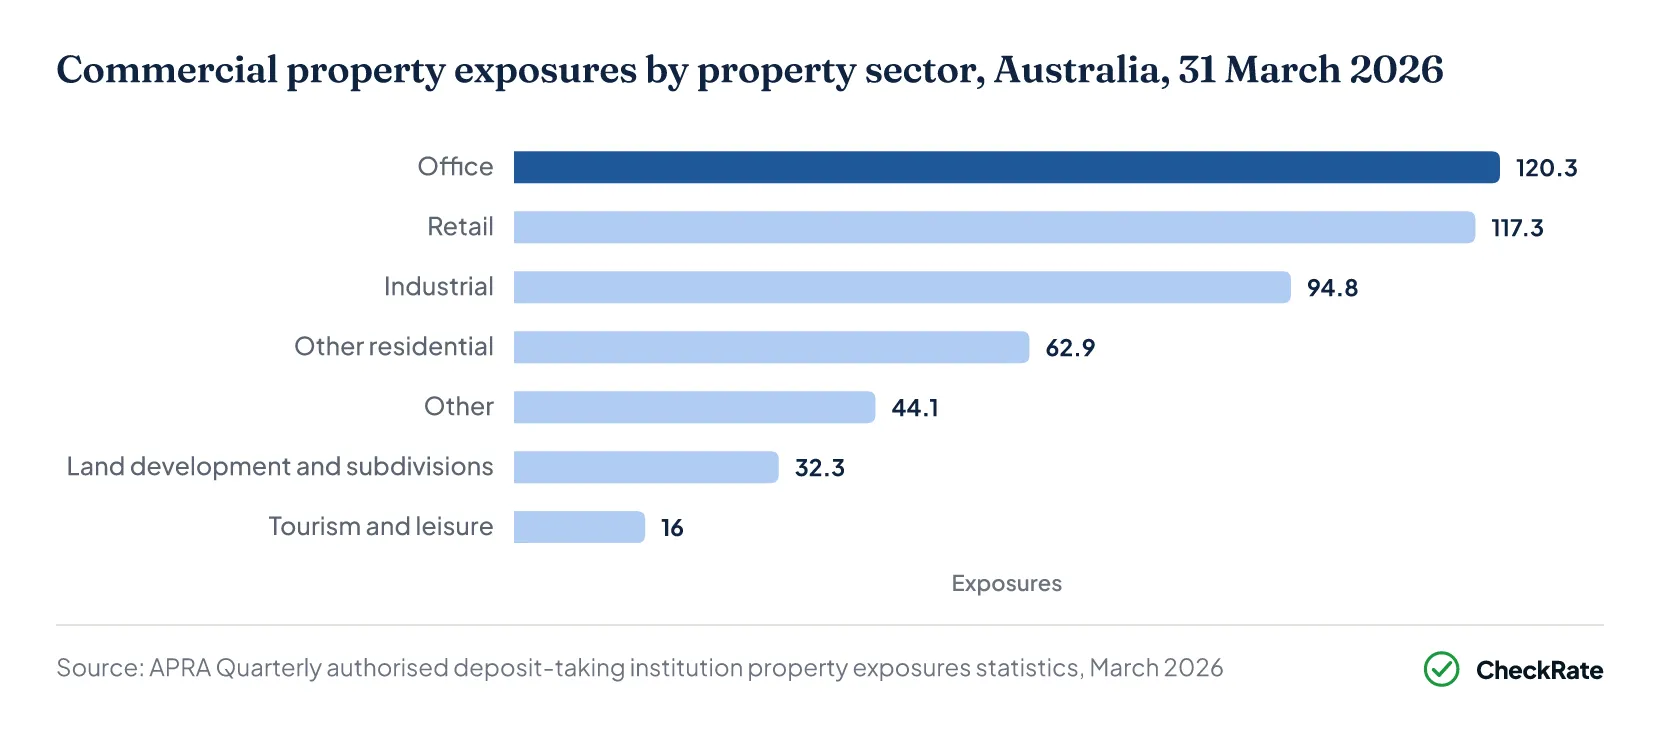
Office property had the largest commercial property exposures of the seven sectors APRA reports, at $120.3 billion at 31 March 2026, equivalent to 24.7% of total exposures1. Retail property recorded the second-largest exposures, at $117.3 billion, or 24.1% of the total exposures. Industrial property recorded the third-largest exposures, at $94.8 billion, or 19.4%. Together, the three property sectors accounted for 68.2% of the total exposures. Office property exposures were $2.9 billion higher than retail property exposures, based on the unrounded figures.
Other residential property, which APRA defines as residential property lending excluding loans to individuals and families, accounted for $62.9 billion, or 12.9% of the total exposures1. Land development and subdivisions accounted for $32.3 billion, or 6.6%. These two sectors accounted for $95.2 billion, or 19.5% of the total exposures. Tourism and leisure property accounted for $16.0 billion, or 3.3%, and property in sectors not listed separately accounted for $44.1 billion, or 9.0%.
| Commercial property exposures and limits by property sector, all ADIs, Australia, 31 March 2026 | |||||
|---|---|---|---|---|---|
| Property sector | Exposures ($ billion) | Limits ($ billion) | Share of exposures (%) | Change over the year ($ billion) | Change (%) |
| Office | 120.3 | 127.5 | 24.7 | 1.2 | 1.0 |
| Retail | 117.3 | 126.8 | 24.1 | 7.4 | 6.7 |
| Industrial | 94.8 | 102.8 | 19.4 | 8.1 | 9.4 |
| Other residential | 62.9 | 68.6 | 12.9 | 9.5 | 17.9 |
| Other | 44.1 | 48.9 | 9.0 | 4.4 | 11.0 |
| Land development and subdivisions | 32.3 | 34.2 | 6.6 | 7.5 | 30.2 |
| Tourism and leisure | 16.0 | 17.0 | 3.3 | 1.2 | 8.0 |
| All sectors | 487.6 | 525.8 | 100.0 | 39.2 | 8.7 |
Source · APRA, Quarterly authorised deposit-taking institution property exposures statistics, March 2026, Table 1a
Section 03 · Growth by sector
How fast is lending to each property sector growing?
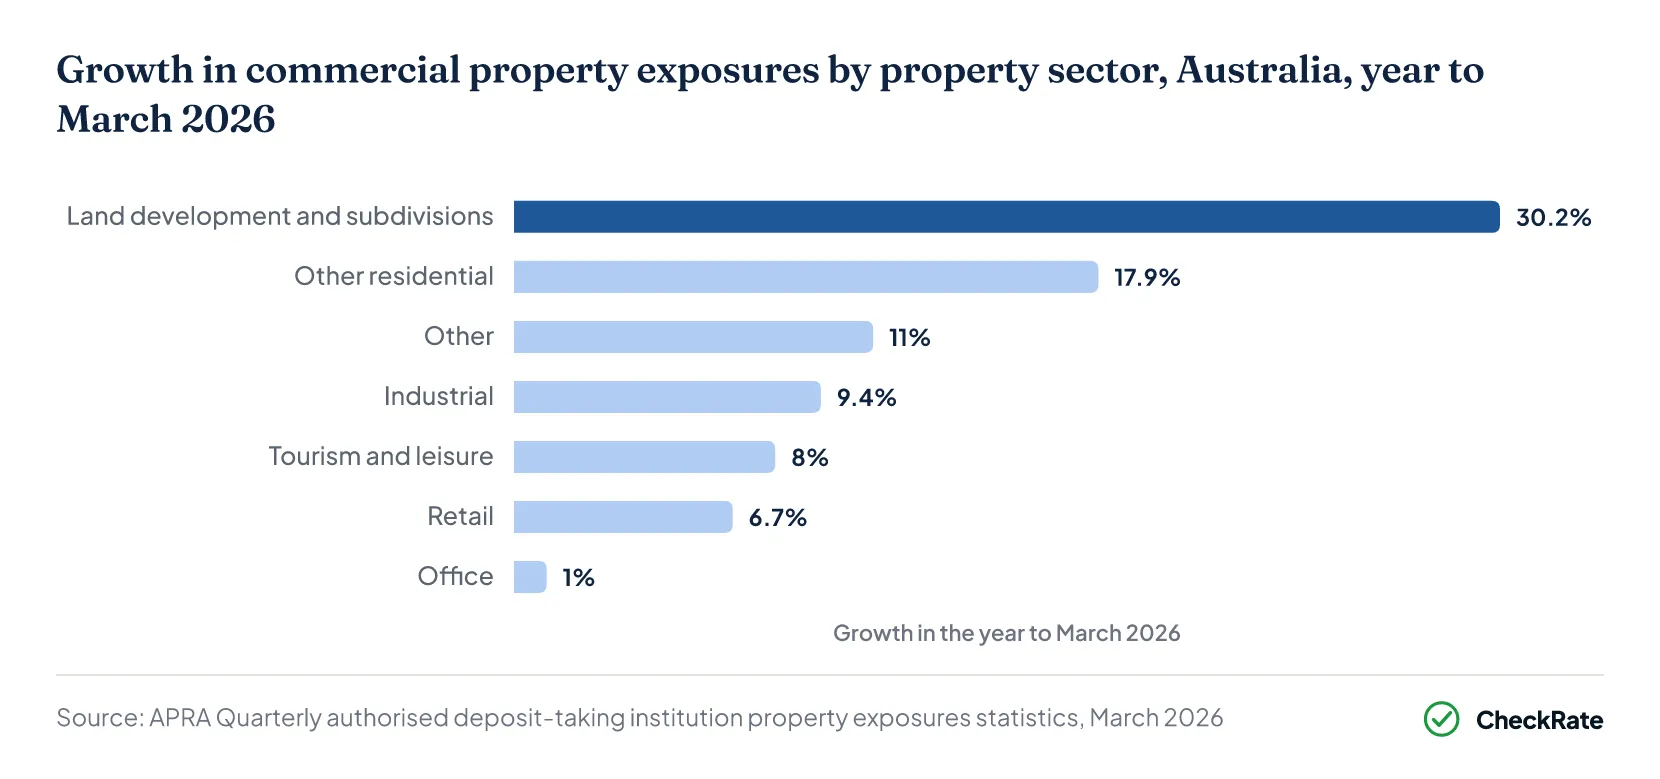
Land development and subdivisions recorded the fastest growth in exposures among the seven property sectors over the year to 31 March 2026, at 30.2%, rising from $24.8 billion at 31 March 2025 to $32.3 billion1. Other residential property recorded the second-fastest growth, at 17.9%, rising from $53.4 billion at 31 March 2025 to $62.9 billion at 31 March 2026. Property in sectors not listed separately grew 11.0% over the year, while industrial property grew 9.4%, from $86.7 billion to $94.8 billion. Tourism and leisure property grew 8.0% and retail property grew 6.7%, both below the 8.7% growth in all commercial property exposures.
Office property recorded the slowest growth among the seven property sectors, at 1.0%, rising from $119.1 billion to $120.3 billion over the year1. The increase in office property exposures was $1.2 billion. Other residential lending and land development and subdivisions together grew 21.8% over the year, from $78.1 billion to $95.2 billion.
Section 04 · Office
How much have banks lent against office property?
Office property exposures were $120.3 billion at 31 March 2026, with exposure limits of $127.5 billion1. Office property exposures reached their highest quarterly level from March 2004 to March 2026 in September 2025, at $120.9 billion. They were $119.7 billion at 31 December 2025.
Office property's share of commercial property exposures fell from 32.0% at 31 March 2021 to 24.7% at 31 March 20261.
Office property exposures grew 20.0% over those five years, from $100.2 billion at 31 March 2021 to $120.3 billion at 31 March 20261. Total commercial property exposures grew 55.6% over the same five years. Industrial property exposures grew 116.7%, from $43.7 billion to $94.8 billion.
The four major banks had $87.5 billion of office property exposures at 31 March 2026, or 72.7%1. Foreign branch banks had $26.2 billion, or 21.8%.
The Reserve Bank of Australia (RBA) reported in its March 2026 Financial Stability Review that demand for prime office space was supporting higher valuations and rents in the office sector3. Lower-grade office properties were among the markets that remained weaker, although conditions in those markets had been stable.
Section 05 · By lender
Which banks hold the commercial property exposures?
The four major banks had $369.4 billion of commercial property exposures at 31 March 2026, equivalent to 75.7% of all ADI exposures1. Foreign branch banks had $86.4 billion, or 17.7%. Other domestic banks had $24.8 billion, or 5.1%. Foreign subsidiary banks had $6.6 billion, or 1.4%. Credit unions and building societies had $0.4 billion, or 0.1%.
The major banks' exposures grew 10.0% over the year to March 20261, while their share of all ADI exposures rose from 74.8% at 31 March 2021 to 75.7% at 31 March 2026. Foreign branch banks' exposures grew 2.9% over the year, while their share fell from 17.9% to 17.7% over the same five years.
The RBA's March 2026 Financial Stability Review reported that commercial property loans had risen as a share of Australian banks' assets "in recent years", after more than a decade of decline following the global financial crisis3. The RBA attributed the rise partly to growth in lending by the major banks.
The lender mix also varied by property sector. Foreign branch banks accounted for 53.1% of all tourism and leisure property exposures at 31 March 2026, at $8.5 billion1. The four major banks accounted for 82.6% of land development and subdivisions exposures and 81.6% of other residential exposures at the same date.
| Commercial property exposures by type of ADI, Australia, 31 March 2026 | ||
|---|---|---|
| Type of ADI | Exposures ($ billion) | Share (%) |
| Major banks | 369.4 | 75.7 |
| Foreign branch banks | 86.4 | 17.7 |
| Other domestic banks | 24.8 | 5.1 |
| Foreign subsidiary banks | 6.6 | 1.4 |
| Credit unions and building societies | 0.4 | 0.1 |
| All ADIs | 487.6 | 100.0 |
Source · APRA, Quarterly authorised deposit-taking institution property exposures statistics, March 2026, Tables 3a, 4a, 5a, 6a and 8
Section 06 · Borrowers
Who borrows against commercial property in Australia?
Medium businesses accounted for the largest share of the three business sizes in lending outstanding to the rental, hiring and real estate services industry at 30 June 2026, at 48.2%, or $207.3 billion4. Large businesses accounted for 42.2%, or $181.6 billion. Small businesses accounted for 9.5%, or $41.0 billion. Lending to the industry across all three business sizes totalled $429.9 billion at banks and registered financial corporations with $2 billion or more of business credit.
APRA reports commercial property exposures by property sector and by location, not by type of borrower. It does not publish how much is owed by property trusts, developers or private investors.
The RBA measure classifies loans by the borrower's industry and includes lending that is not secured by commercial property. APRA instead classifies exposures by the property that repays them. The two totals are not comparable.
Foreign banks continued lending to owners of Australian commercial property, according to the RBA's March 2026 Financial Stability Review3. Net purchases of Australian commercial property by foreign investors increased further in 2025.
| Business lending outstanding to the rental, hiring and real estate services industry by business size, Australia, 30 June 2026 | ||
|---|---|---|
| Business size | Lending outstanding ($ billion) | Share (%) |
| Small business | 41.0 | 9.5 |
| Medium business | 207.3 | 48.2 |
| Large business | 181.6 | 42.2 |
| All business sizes | 429.9 | 100.0 |
Source · RBA, Lending to Business by Business Size and Industry (Statistical Table D14.1)
How much small and medium businesses borrow across all industries is covered in the SME lending statistics article.
Section 07 · Non-performing
How much commercial property lending is non-performing?
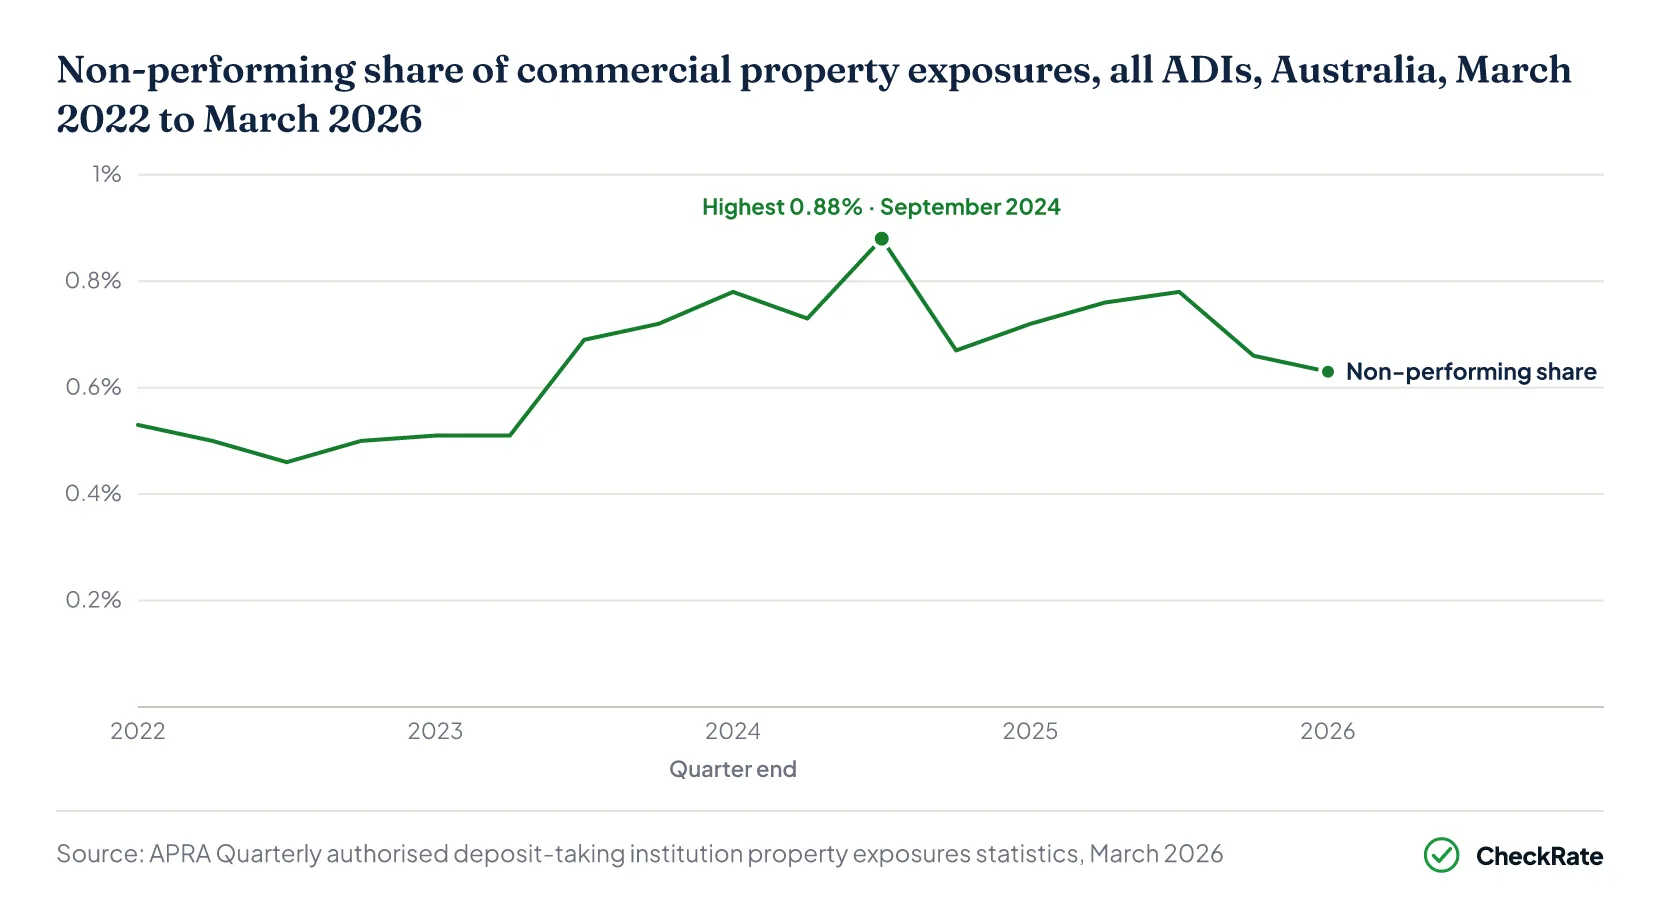
Non-performing commercial property exposures were $3.1 billion at 31 March 2026, equivalent to 0.63% of total commercial property exposures1. The share was 0.72% at 31 March 2025 and 0.66% at 31 December 2025. It reached 0.88% in September 2024, the highest level from March 2022 to March 2026. Its lowest level over the same period was 0.46%, in September 2022.
A non-performing exposure is one in default under prudential standard APS 2202. APRA has published the measure for commercial property since the March 2022 quarter, replacing an impaired exposures measure that excluded exposures 90 days or more past due1. At 31 March 2026, ADIs had $0.3 billion in specific provisions for non-performing exposures, equal to 10.5% of the total. Specific provisions and security together equalled 119.8% of the non-performing exposures.
Of the $3.1 billion in non-performing exposures, $2.7 billion, or 89.9%, was located in Australia at 31 March 20261. Other domestic banks had the highest non-performing share among the three largest lender groups at the same date, at 1.07%, compared with 0.67% for major banks and 0.30% for foreign branch banks. The RBA's March 2026 Financial Stability Review described the non-performing share of banks' commercial property loans as low by historical standards3.
| Non-performing commercial property exposures, all ADIs, Australia, March quarters 2022 to 2026 with the highest and lowest quarters | ||
|---|---|---|
| Quarter end | Non-performing exposures ($ billion) | Share of total exposures (%) |
| March 2022 | 1.9 | 0.53 |
| September 2022 | 1.7 | 0.46 |
| March 2023 | 2.0 | 0.51 |
| March 2024 | 3.3 | 0.78 |
| September 2024 | 3.8 | 0.88 |
| March 2025 | 3.3 | 0.72 |
| March 2026 | 3.1 | 0.63 |
Source · APRA, Quarterly authorised deposit-taking institution property exposures statistics, March 2026, Table 1a
Section 08 · Since 2004
How has commercial property lending changed since 2004?
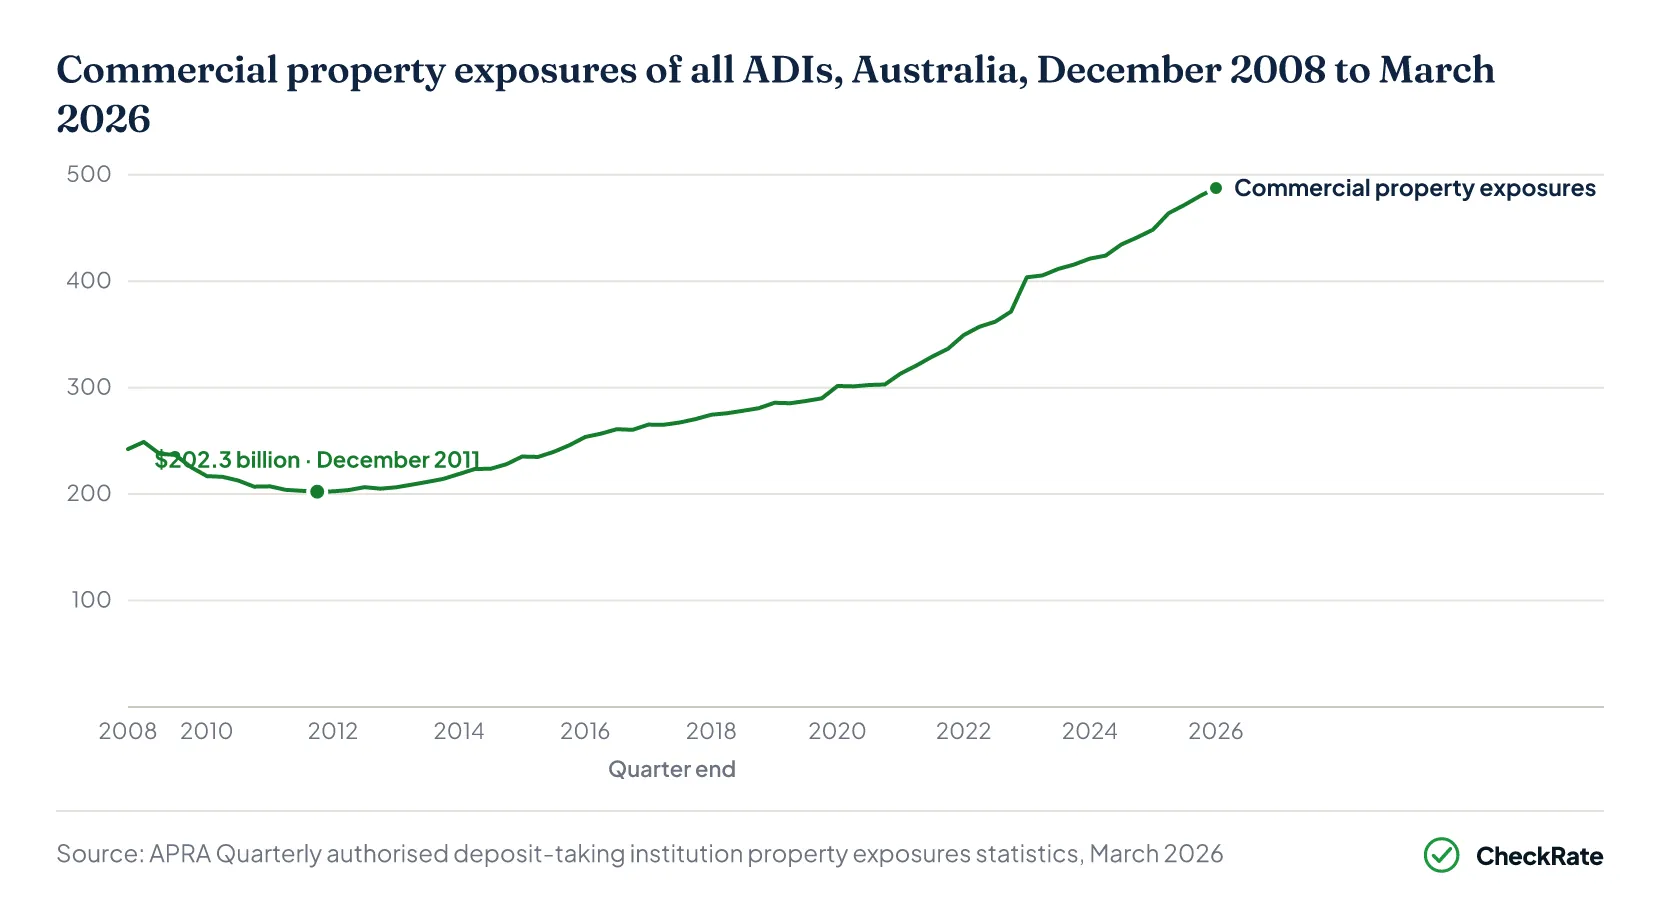
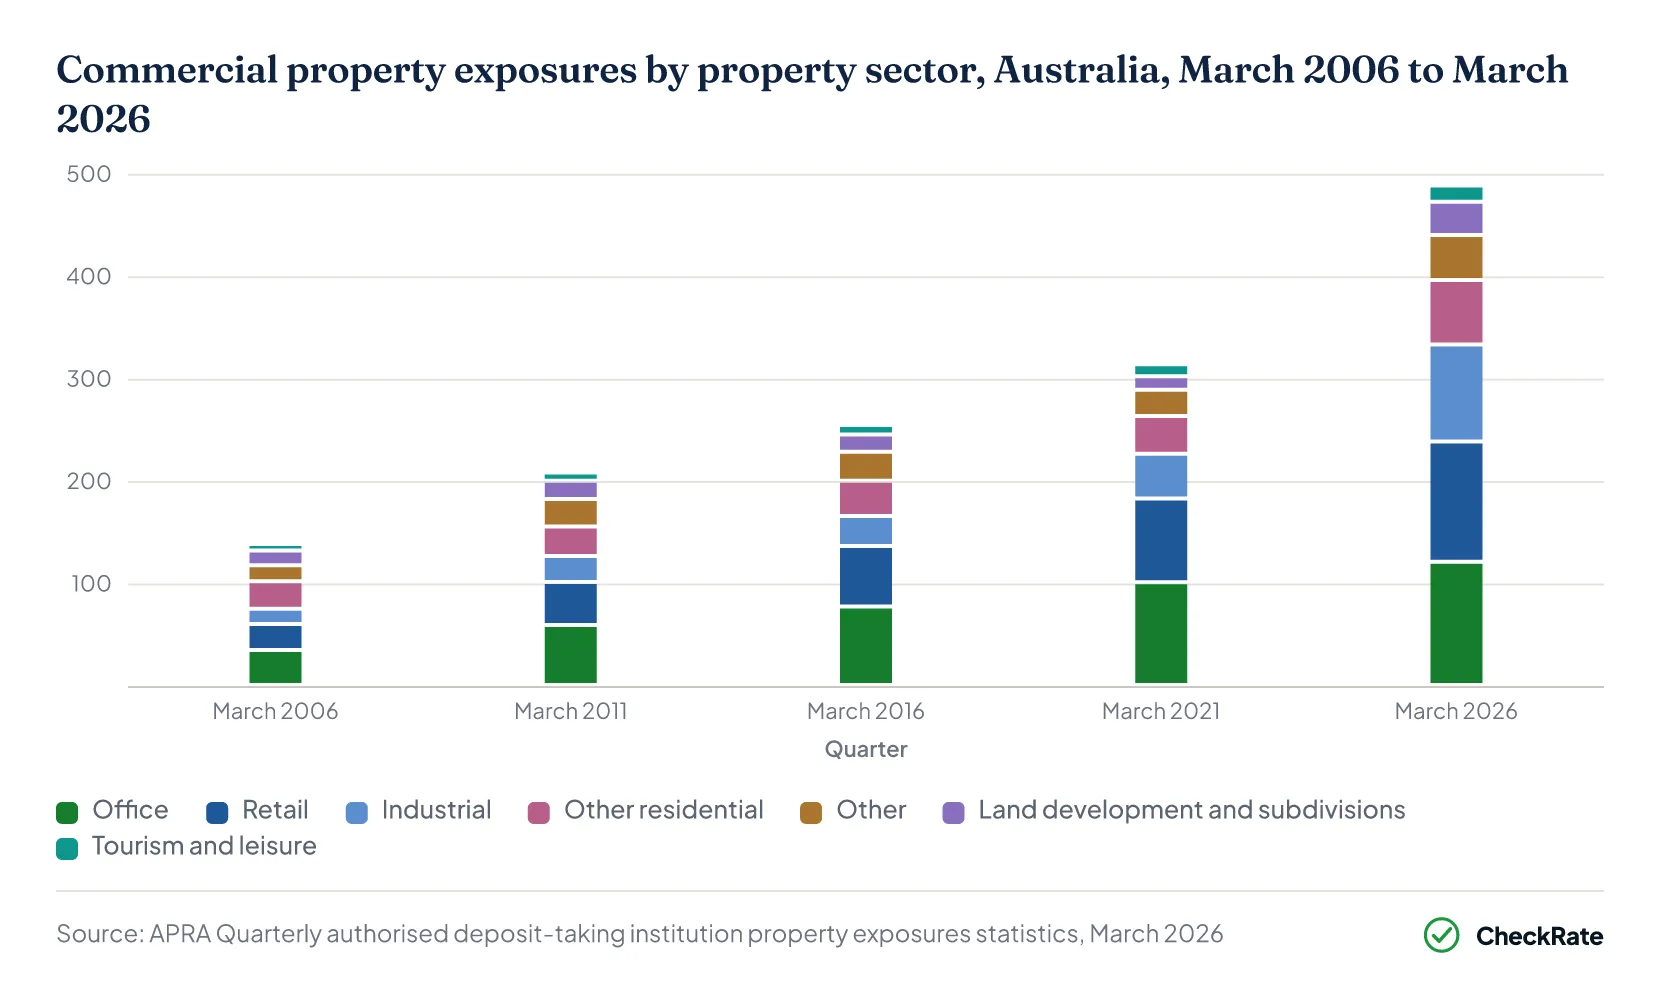
Commercial property exposures grew from $96.4 billion at 31 March 2004 to $487.6 billion at 31 March 2026, an increase of 406.1% over 22 years1. The 2026 figure was the highest quarterly total over that period. Over the decade from March 2016, exposures grew 92.2% from $253.7 billion to $487.6 billion.
Exposures reached $249.0 billion at 31 March 20091. They then fell 18.7%, to $202.3 billion at 31 December 2011. Commercial property exposures did not return to their March 2009 level until March 2016. Commercial property exposures grew in 51 of the 57 quarters from March 2012 to March 2026. Land development and subdivisions were 9.1% of exposures in 2009, compared with 6.6% in March 2026.
Industrial property's share of commercial property exposures rose from 10.9% at 31 March 2006 to 19.4% at 31 March 20261. The retail property share rose from 18.5% to 24.1% over the same period, while the office property share was almost unchanged, at 24.8% and 24.7%.
| Commercial property exposures, limits and the shares of the three largest sectors, all ADIs, Australia, selected March quarters 2006 to 2026 | |||||
|---|---|---|---|---|---|
| Quarter end | Exposures ($ billion) | Limits ($ billion) | Office share (%) | Retail share (%) | Industrial share (%) |
| March 2006 | 137.7 | 163.6 | 24.8 | 18.5 | 10.9 |
| March 2009 | 249.0 | 286.4 | 26.2 | 17.9 | 11.8 |
| March 2011 | 207.3 | 233.2 | 28.2 | 20.3 | 12.2 |
| March 2013 | 206.4 | 242.4 | 29.2 | 21.8 | 12.1 |
| March 2016 | 253.7 | 304.7 | 30.2 | 23.2 | 11.5 |
| March 2019 | 285.8 | 334.7 | 30.7 | 25.6 | 12.5 |
| March 2021 | 313.3 | 362.5 | 32.0 | 26.1 | 14.0 |
| March 2023 | 403.7 | 437.3 | 28.4 | 24.6 | 16.5 |
| March 2025 | 448.4 | 483.7 | 26.6 | 24.5 | 19.3 |
| March 2026 | 487.6 | 525.8 | 24.7 | 24.1 | 19.4 |
Source · APRA, Quarterly authorised deposit-taking institution property exposures statistics, March 2026, Table 1a
The interest rates businesses pay on their loans, by business size, are covered in the business loan interest rates article.
Section 09
Commercial property lending: quick answers
How large are Australian banks' commercial property exposures?
Commercial property exposures of Australian banks and other authorised deposit-taking institutions were $487.6 billion at 31 March 2026, according to the Australian Prudential Regulation Authority. Commercial property exposure limits, which include undrawn commitments, were $525.8 billion at the same date.
What counts as a commercial property exposure?
A commercial property exposure is a loan or other facility for developing, buying or improving real estate, where repayment depends on the income the property earns from rent or sale, or on other properties the borrower owns. Home loans to owner-occupiers and loans to individuals investing in residential property are excluded.
References
- APRA, Quarterly authorised deposit-taking institution property exposures statistics, March 2026 · apra.gov.au ↑ b c d e f g h i j k l m n o p q r s t u v w
- APRA, Glossary, Quarterly Authorised Deposit-taking Institution Property Exposures Statistics, June 2022 · apra.gov.au ↑ b
- RBA, Financial Stability Review, March 2026, chapter 2: Resilience of Australian Households and Businesses · Reserve Bank of Australia ↑ b c d
- RBA, Lending to Business: Business Finance Outstanding by Business Size and Industry, Statistical Table D14.1 · Reserve Bank of Australia ↑