


Published
Section 01 · June 2026
What is the total lending outstanding to small and medium businesses in Australia?
Lending outstanding to small businesses was $208.0 billion at 30 June 2026, while medium businesses had $584.9 billion outstanding, bringing combined SME lending to $792.8 billion, according to the Reserve Bank of Australia (RBA) Lending to Business data.1 Lending outstanding to large businesses was $820.6 billion, taking total business lending at the reporting lenders to $1,613.4 billion. The reporting lenders are the banks and registered financial corporations with $2 billion or more of business credit that report to the Australian Prudential Regulation Authority (APRA) and the RBA.
Of the total, small businesses accounted for 12.9% of business lending outstanding at the reporting lenders, medium businesses accounted for 36.2% and large businesses accounted for 50.9%.1
Before April 2023, all reporting lenders applied common size definitions. Small businesses had lender exposure below $1 million and turnover below $50 million, while medium businesses had exposure of $1 million or more and turnover below $50 million. Businesses with turnover of $50 million or more were classified as large.1
Banks using APRA-approved internal credit risk models adopted the definitions in APRA's prudential standards APS 112 and APS 113 in April 2023, and all other reporting lenders followed in June 2024.1
The size totals include lending to financial businesses. Excluding this lending, outstanding business finance was $181.9 billion for small businesses, $559.8 billion for medium businesses and $594.6 billion for large businesses, or $1,336.4 billion in total.1
| Business lending outstanding by business size, Australia, 30 June 2026 | |||
|---|---|---|---|
| Business size | Total ($ billion) | Excluding financial businesses ($ billion) | Share of total (%) |
| Small business | 208.0 | 181.9 | 12.9 |
| Medium business | 584.9 | 559.8 | 36.2 |
| Large business | 820.6 | 594.6 | 50.9 |
| All business | 1,613.4 | 1,336.4 | 100.0 |
Source · RBA, Lending to Business by Business Size and Interest Rate Type (Statistical Table D14)
Section 02 · Growth
How fast is lending to small and medium businesses growing?
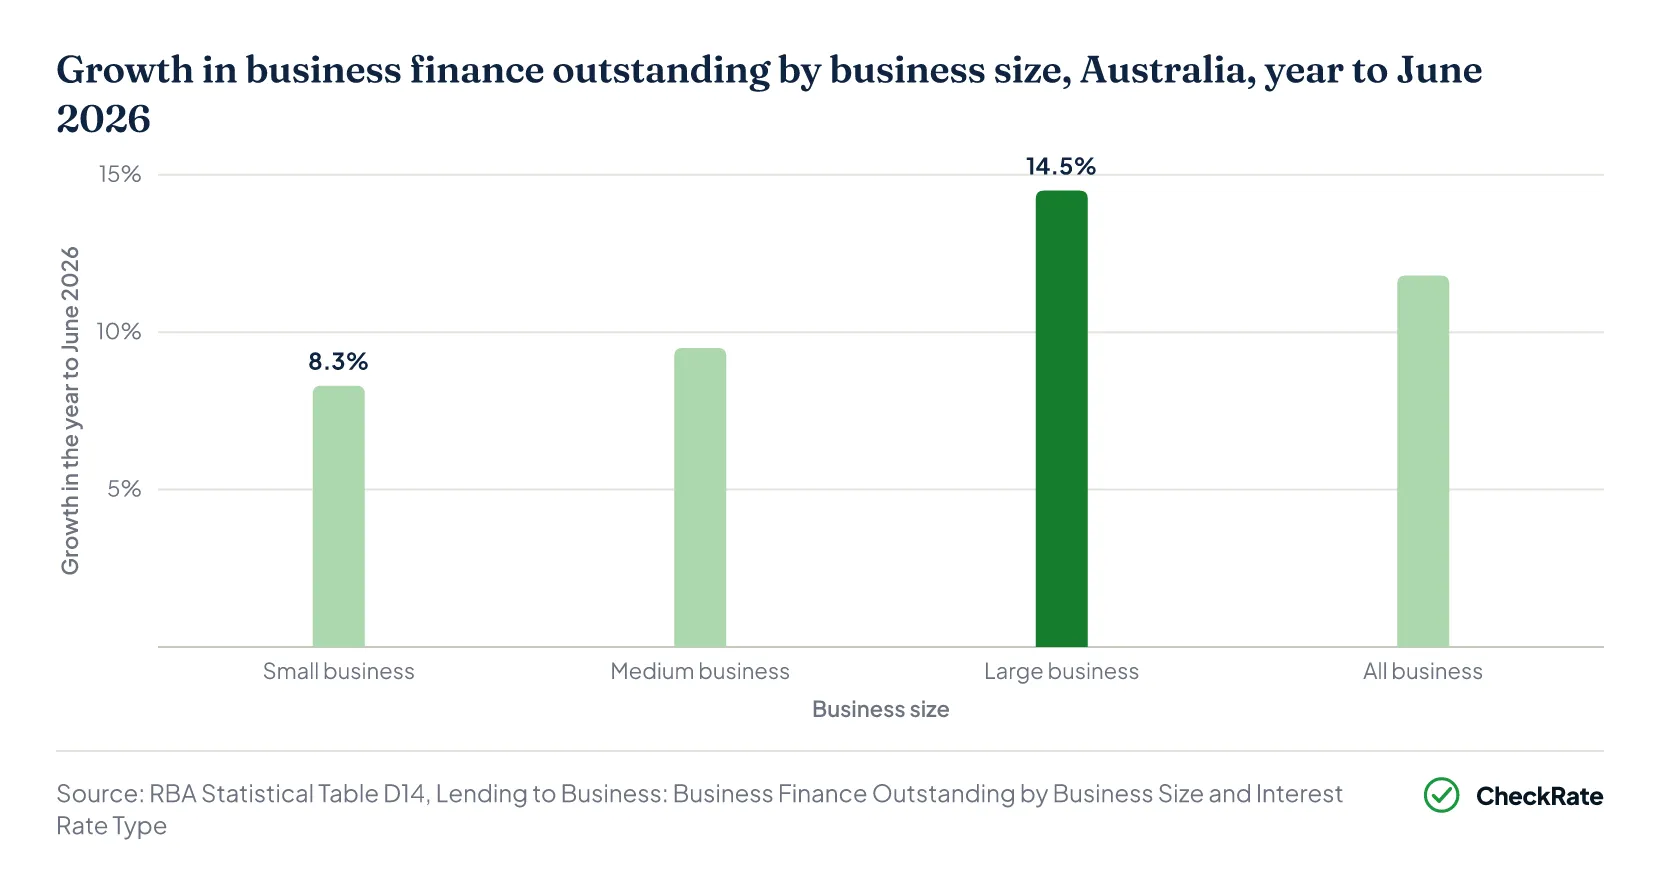
Lending to small businesses grew 8.3% in the year to 30 June 2026, from $192.1 billion to $208.0 billion, an increase of $15.9 billion.1 Lending to medium businesses grew 9.5%, from $534.2 billion to $584.9 billion, an increase of $50.6 billion, while lending to large businesses grew 14.5%, an increase of $104.0 billion. Combined lending to small and medium businesses grew 9.2%, or $66.5 billion, while total business lending at the reporting lenders grew 11.8%, or $170.5 billion.
Credit to non-financial businesses was $1,439.1 billion at 31 July 2026, seasonally adjusted, and grew 10.6% over the year to July 2026, according to the RBA's Financial Aggregates.2 Total credit excluding lending to financial businesses grew 8.4% over the same period and housing credit grew 7.4%.3
Credit to non-financial businesses accounted for 33.9% of the $4,240.9 billion of total credit excluding lending to financial businesses at 31 July 2026.2
The RBA's October 2025 Bulletin found that growth in SME lending was concentrated in larger loans.4
Section 03 · By industry
Which industries account for the most lending to small and medium businesses?
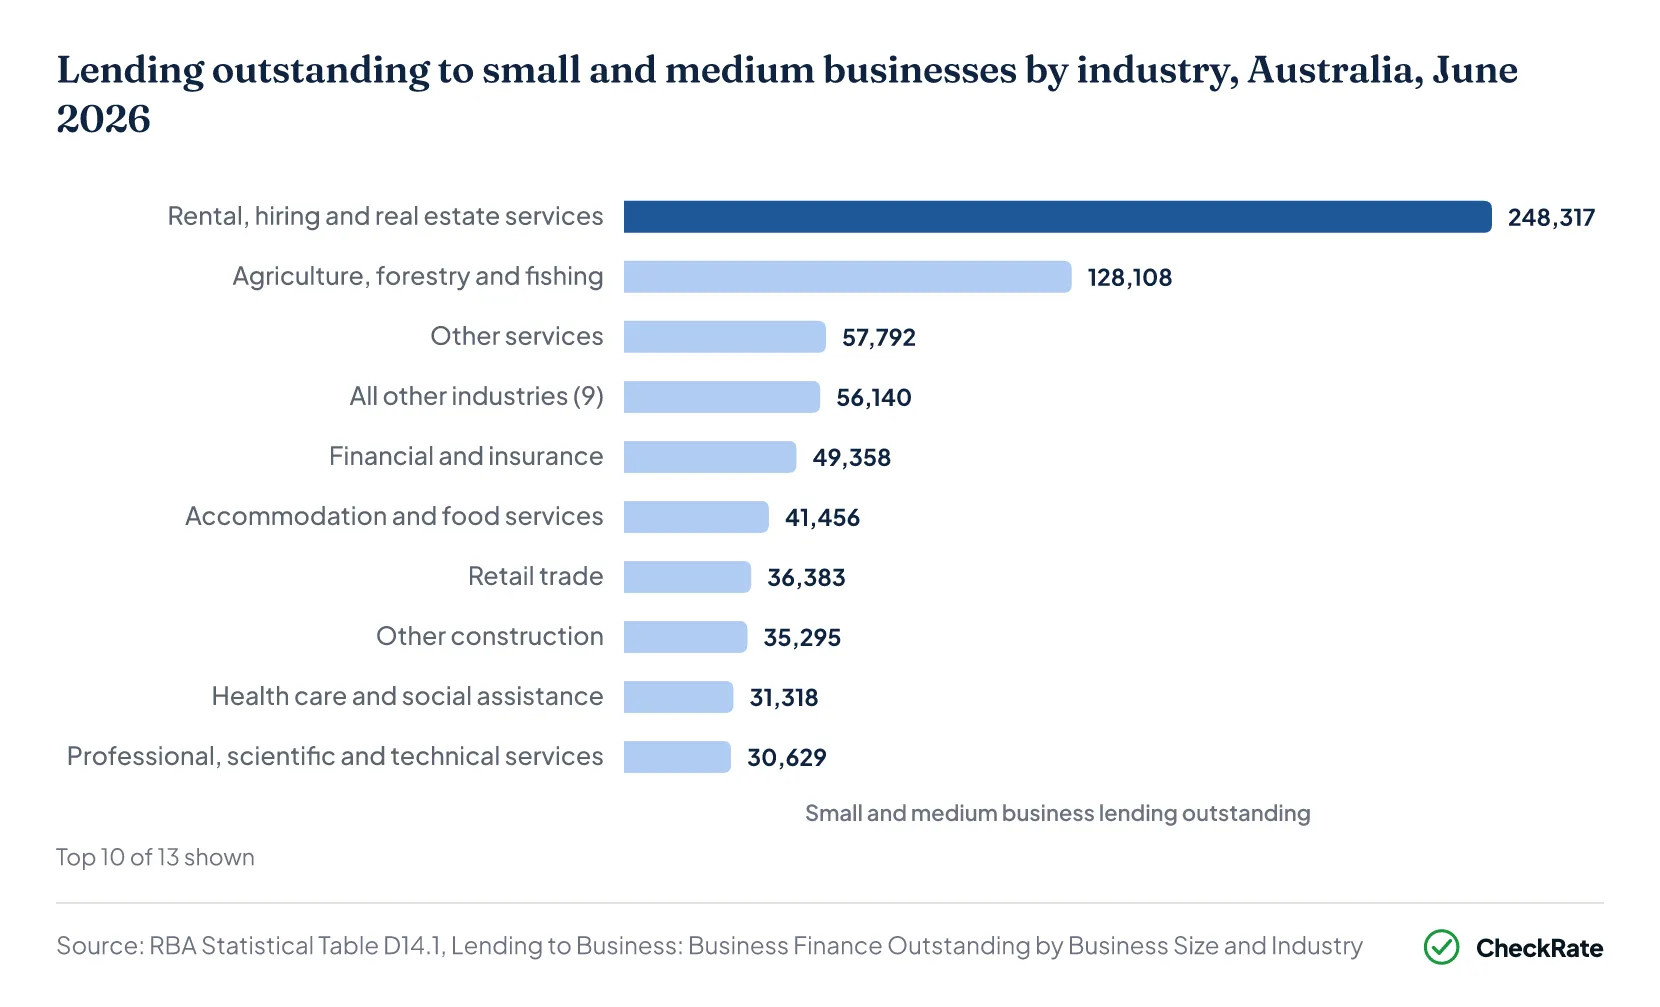
Rental, hiring and real estate services had the most lending to small and medium businesses, at $248.3 billion at 30 June 2026.5 It accounted for 31.4% of the $791.1 billion of SME lending classified by industry. Agriculture, forestry and fishing was next at $128.1 billion, or 16.2%, followed by other services at $57.8 billion. The two largest industries together accounted for $376.4 billion, or 47.6%, of SME lending by industry.
For small businesses alone, the largest amount was also in rental, hiring and real estate services at $41.0 billion. Other services followed at $33.3 billion, then financial and insurance services at $25.8 billion.5
SMEs made up 84.5% of lending to agriculture, forestry and fishing and 57.8% of lending to rental, hiring and real estate services at 30 June 2026.5 Among industries with more than $20 billion in total business lending, the smallest SME shares were in information media and telecommunications at 10.9%, electricity, gas, water and waste services at 12.5%, and mining at 15.4%.
Financial and insurance services had the most lending to large businesses at $206.9 billion. SMEs accounted for 19.3% of lending to that industry.5
| Lending outstanding to small and medium businesses by industry, Australia, 30 June 2026 | |||||
|---|---|---|---|---|---|
| Industry | Small ($ billion) | Medium ($ billion) | Small and medium ($ billion) | Share of SME lending (%) | SME share of the industry's lending (%) |
| Rental, hiring and real estate services | 41.0 | 207.3 | 248.3 | 31.4 | 57.8 |
| Agriculture, forestry and fishing | 12.9 | 115.2 | 128.1 | 16.2 | 84.5 |
| Other services | 33.3 | 24.4 | 57.8 | 7.3 | 100.0 |
| Financial and insurance | 25.8 | 23.6 | 49.4 | 6.2 | 19.3 |
| Accommodation and food services | 5.5 | 36.0 | 41.5 | 5.2 | 62.2 |
| Retail trade | 9.9 | 26.5 | 36.4 | 4.6 | 59.6 |
| Other construction | 16.7 | 18.6 | 35.3 | 4.5 | 68.6 |
| Health care and social assistance | 11.2 | 20.1 | 31.3 | 4.0 | 56.1 |
| Professional, scientific and technical services | 13.8 | 16.8 | 30.6 | 3.9 | 67.4 |
| Manufacturing | 7.8 | 18.5 | 26.4 | 3.3 | 40.4 |
| Transport, postal and warehousing | 8.1 | 17.5 | 25.6 | 3.2 | 31.8 |
| Wholesale trade | 4.1 | 20.3 | 24.4 | 3.1 | 44.1 |
| All other industries (9) | 17.6 | 38.5 | 56.1 | 7.1 | 27.9 |
| All industries | 207.7 | 583.4 | 791.1 | 100.0 | 50.1 |
Source · RBA, Lending to Business by Business Size and Industry (Statistical Table D14.1)
Section 04 · Security
How much small-business lending is secured by residential property?
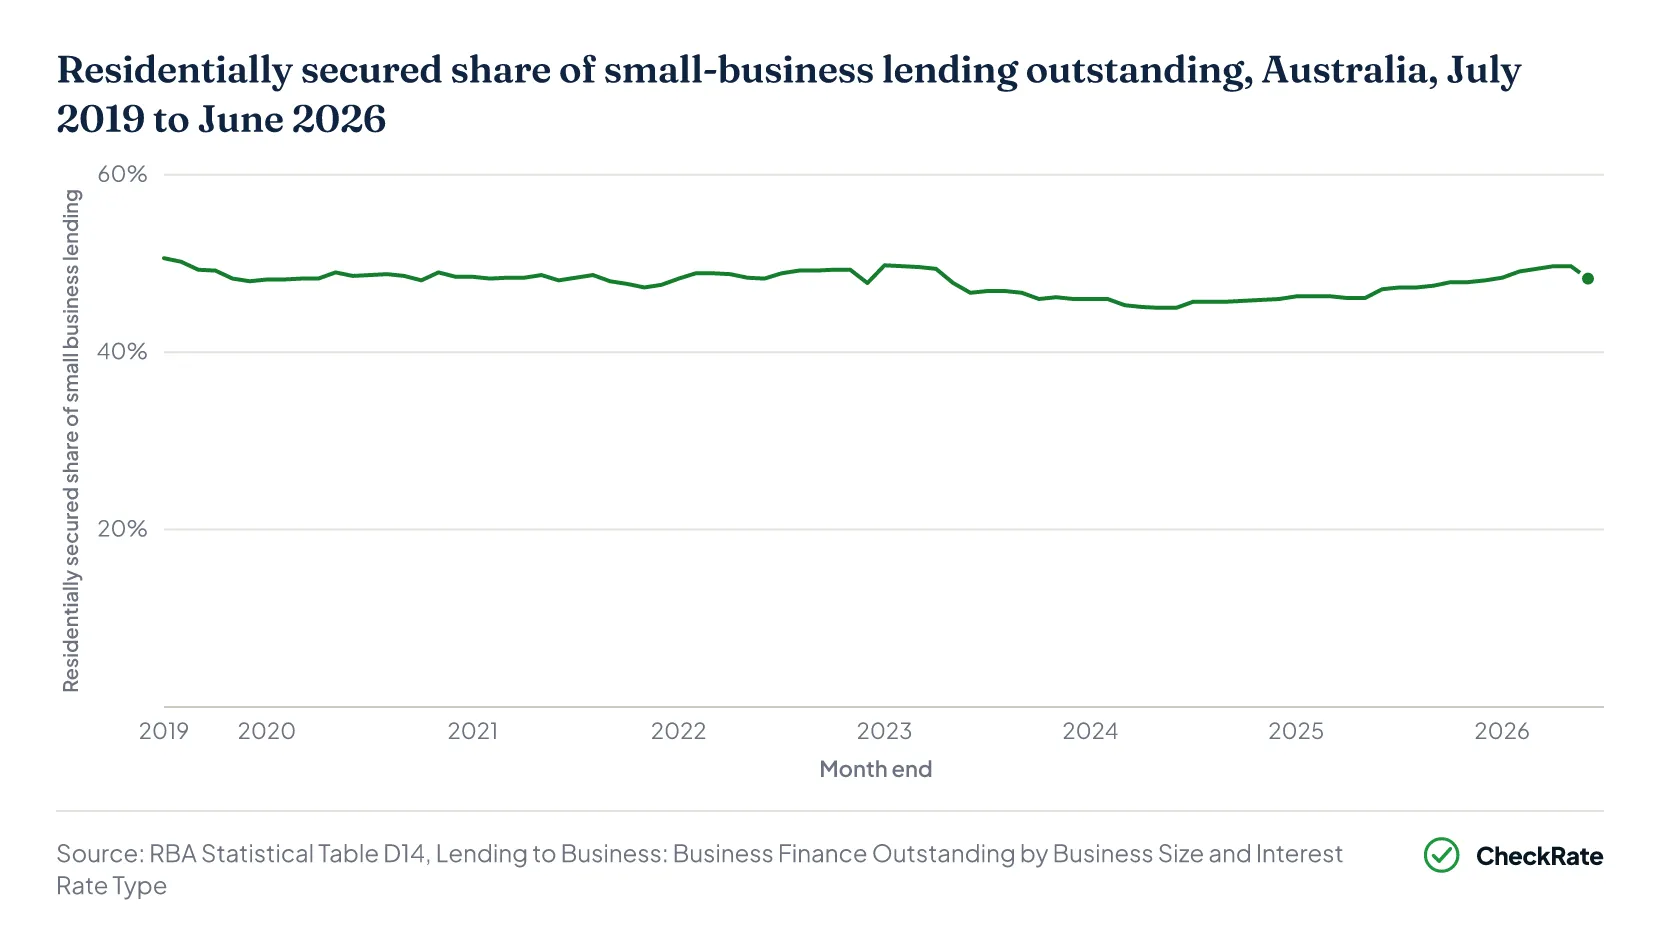
Loans secured by residential property made up $100.4 billion, or 48.3%, of the $208.0 billion of lending outstanding to small businesses at 30 June 2026.1 The residentially secured share of small-business lending was highest in July 2019, at 50.6%, and lowest in May and June 2024, at 45.0%, over the period from July 2019 to June 2026.
Residentially secured lending to small businesses grew 11.1% over the year to June 2026, while lending secured in other ways or unsecured grew 5.8%, to $107.6 billion.1 The RBA reports residentially secured lending for small businesses only, not for medium or large businesses.
The RBA's October 2025 Bulletin reported that around half of smaller SME loans were secured by assets other than residential property, including vehicles and equipment.4 The unsecured share of SME credit remained below 5% in the years to October 2025, and new loans secured by residential property were on average 4.5 times as large as loans secured in other ways.
Section 05 · Fixed and variable
What share of business lending has a fixed interest rate?
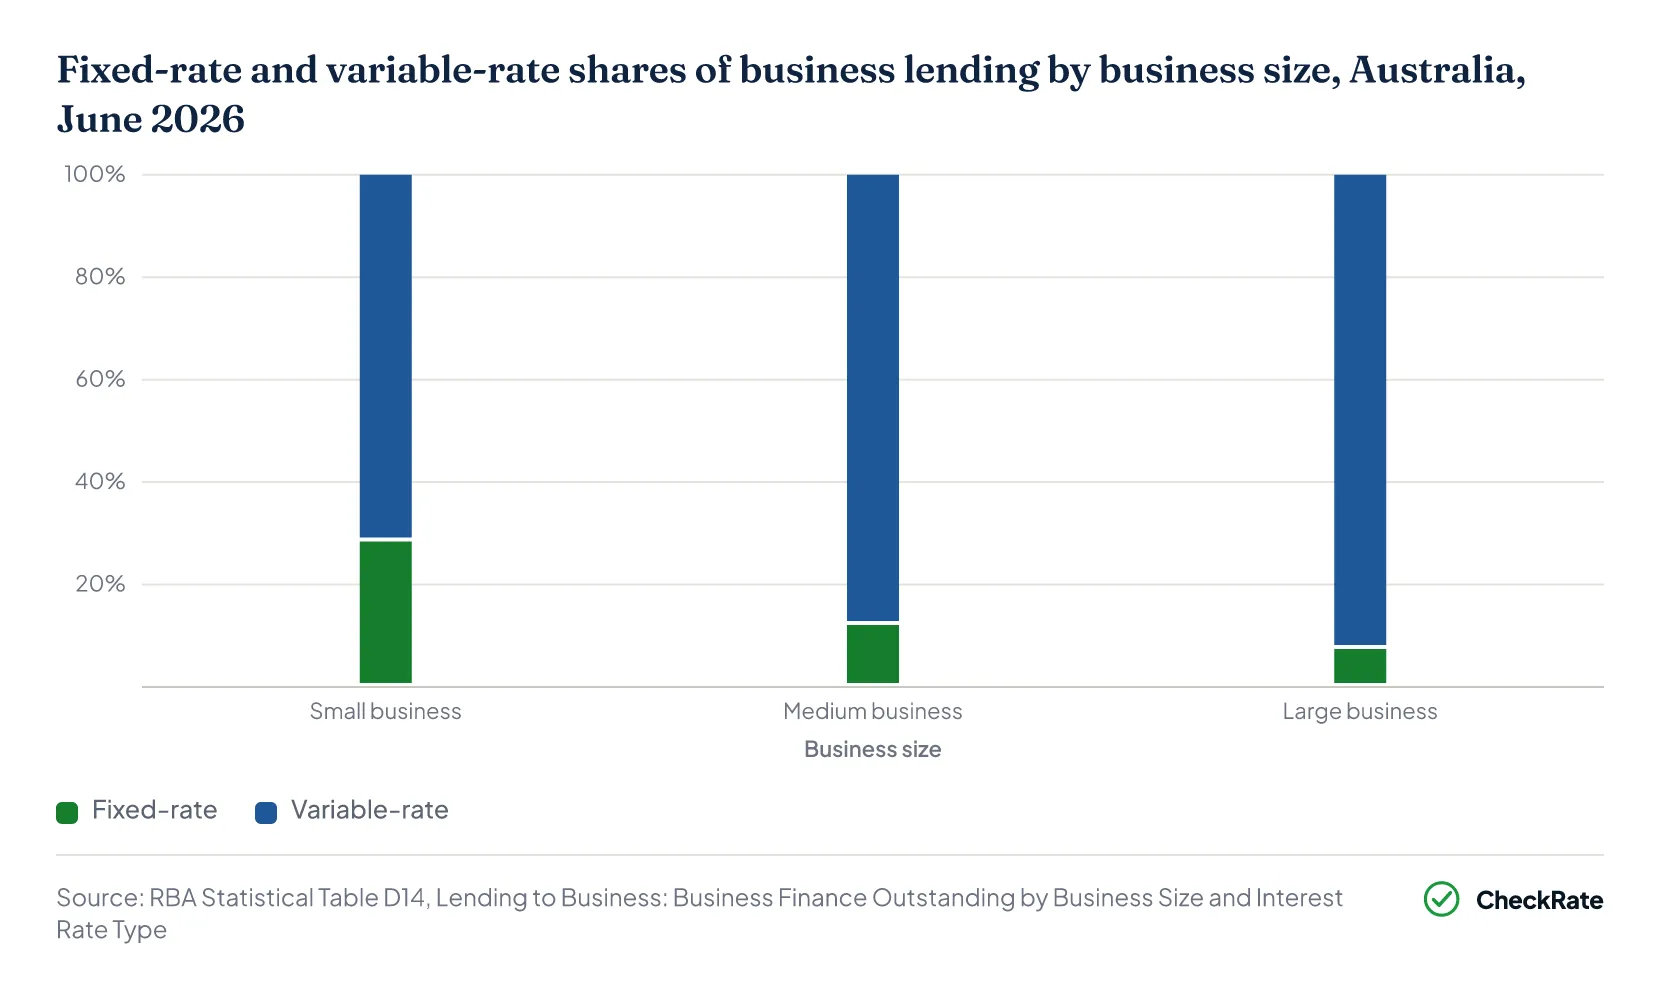
Fixed-rate loans made up 28.4% of lending outstanding to small businesses at 30 June 2026, compared with 12.1% for medium businesses and 7.4% for large businesses.1 For small businesses, this equalled $59.1 billion of the $208.0 billion outstanding. Medium businesses had $70.7 billion of fixed-rate lending outstanding and large businesses had $60.6 billion.
In July 2019, the fixed-rate shares were 34.6% for small businesses, 28.9% for medium businesses and 14.3% for large businesses.1
Over the year to June 2026, fixed-rate lending to small businesses grew 8.3%, from $54.6 billion to $59.1 billion, and variable-rate lending also grew 8.3%, to $148.9 billion.1 Fixed-rate lending to medium businesses grew 3.2% over the same period, while fixed-rate lending to large businesses grew 14.1%.
Section 06 · Interest rates
What interest rates do small and medium businesses pay on their loans?
Small businesses paid an average interest rate of 7.46% on their outstanding loans in July 2026, medium businesses paid 6.21% and large businesses paid 5.74%, according to the RBA's Business Lending Rates data.6 New loans funded during the month averaged 7.44% for small businesses, 6.26% for medium businesses and 5.54% for large businesses.
The average rate on outstanding small-business loans was 1.72 percentage points higher than the rate for large businesses in July 2026.6 Outstanding small-business loans secured by residential property averaged 6.98% over the same month.
| Average business loan interest rates by business size, Australia, July 2026 | ||
|---|---|---|
| Business size | Outstanding loans (% p.a.) | New loans funded in the month (% p.a.) |
| Small business | 7.46 | 7.44 |
| Medium business | 6.21 | 6.26 |
| Large business | 5.74 | 5.54 |
Source · RBA, Business Lending Rates (Statistical Table F7)
The gap between small-business and large-business rates, how business loan rates move with the cash rate, and fixed-rate and variable-rate lending are covered in the business loan interest rates article.
Section 07 · Since 2019
How has lending to small and medium businesses changed since 2019?
Lending outstanding to small businesses grew 44.0% between July 2019 and June 2026, from $144.4 billion to $208.0 billion, while medium-business lending grew 113.9%, from $273.4 billion to $584.9 billion.1 These comparisons span changes in business-size definitions in April 2023 and June 2024, so the figures by business size are not fully like for like across the period. Total business lending at the reporting lenders grew 73.1% over the same period, from $932.2 billion to $1,613.4 billion. Lending outstanding to small businesses was lowest in May 2022, at $137.1 billion, and highest in June 2026, at $208.0 billion.
The definition changes moved lending between the size categories without changing the overall total.
In April 2023, lending classified as medium business rose from $337.8 billion to $411.1 billion in a single month, and lending classified as large business fell from $701.7 billion to $625.0 billion.1 Total business lending rose $10.4 billion in the same month. A second shift occurred in June 2024, when all other reporting lenders adopted the APS definitions. That month, small-business lending rose $5.8 billion, medium-business lending rose $12.9 billion and large-business lending fell $3.3 billion.
The share of business lending in each size category also shifted over the period, and the definition changes mean the shares are not a like-for-like comparison. Small businesses' share of business lending fell from 15.5% in July 2019 to 12.9% in June 2026.1 Medium businesses' share rose from 29.3% to 36.2%, and large businesses' share fell from 55.2% to 50.9%.
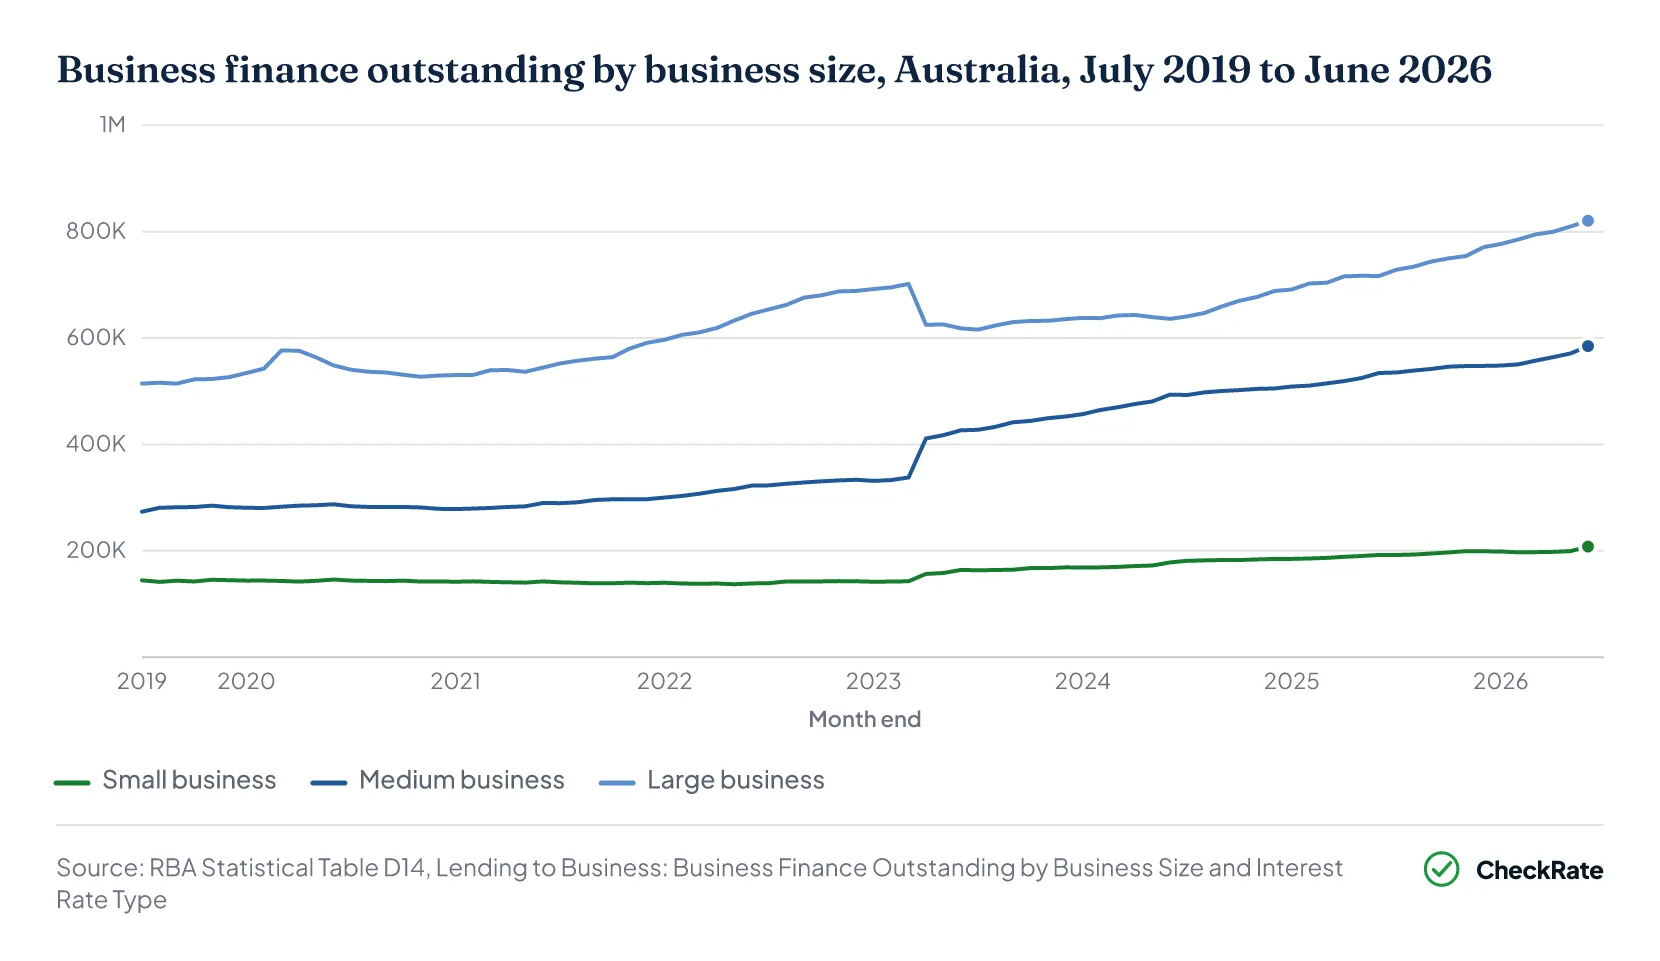
| Business lending outstanding by business size, Australia, June each year 2020 to 2026 and July 2019 | |||||
|---|---|---|---|---|---|
| Month end | Small ($ billion) | Medium ($ billion) | Large ($ billion) | All business ($ billion) | SME share (%) |
| Jul 2019 | 144.4 | 273.4 | 514.3 | 932.2 | 44.8 |
| Jun 2020 | 145.9 | 287.4 | 548.5 | 981.8 | 44.1 |
| Jun 2021 | 142.4 | 289.8 | 544.4 | 976.6 | 44.3 |
| Jun 2022 | 138.6 | 322.5 | 645.7 | 1,106.8 | 41.7 |
| Jun 2023 | 164.0 | 426.5 | 618.2 | 1,208.6 | 48.9 |
| Jun 2024 | 178.1 | 493.7 | 636.1 | 1,307.8 | 51.4 |
| Jun 2025 | 192.1 | 534.2 | 716.6 | 1,442.9 | 50.3 |
| Jun 2026 | 208.0 | 584.9 | 820.6 | 1,613.4 | 49.1 |
Source · RBA, Lending to Business by Business Size and Interest Rate Type (Statistical Table D14)
Section 08
SME lending: quick answers
How much of Australia's business lending goes to small and medium businesses?
Small and medium businesses accounted for 49.1% of the $1,613.4 billion of business lending outstanding at 30 June 2026 across banks and registered financial corporations with $2 billion or more of business credit, according to the Reserve Bank of Australia. Lending to small businesses was $208.0 billion and lending to medium businesses was $584.9 billion.
What counts as a small business in RBA lending statistics?
Since June 2024, all reporting lenders have classified businesses by size under the Australian Prudential Regulation Authority's prudential standards APS 112 and APS 113. Before April 2023, a business was classified as small when the lender's exposure to it was less than $1 million and its turnover was less than $50 million.
Is lending to small businesses growing faster than lending to large businesses?
No. Lending to small businesses grew 8.3% in the year to June 2026, compared with 9.5% for medium businesses and 14.5% for large businesses, according to the Reserve Bank of Australia. Credit to non-financial businesses across all lenders grew 10.6% in the year to July 2026.
How much small-business lending is not secured by residential property?
Small-business lending secured in other ways or unsecured totalled $107.6 billion at 30 June 2026, equal to 51.7% of the $208.0 billion outstanding, according to the Reserve Bank of Australia. The residentially secured share was 48.3%, compared with 50.6% in July 2019.
Which industry has the most SME lending in Australia?
Rental, hiring and real estate services recorded the largest amount of lending outstanding to small and medium businesses among the 21 industries the Reserve Bank of Australia reports, at $248.3 billion at 30 June 2026, or 31.4% of SME lending classified by industry. Agriculture, forestry and fishing was second, at $128.1 billion.
How much business credit is there in Australia?
Credit to non-financial businesses across all lenders was $1,439.1 billion at 31 July 2026, seasonally adjusted, according to the Reserve Bank of Australia's Financial Aggregates. This accounted for 33.9% of the $4,240.9 billion of total credit excluding lending to financial businesses.
References
- RBA, Lending to Business: Business Finance Outstanding by Business Size and Interest Rate Type, Statistical Table D14 · Reserve Bank of Australia ↑ b c d e f g h i j k l m n o
- RBA, Lending and Credit Aggregates, Statistical Table D2 · Reserve Bank of Australia ↑ b
- RBA, Growth in Selected Financial Aggregates, Statistical Table D1 · Reserve Bank of Australia ↑
- RBA Bulletin, Small Business Economic and Financial Conditions · Reserve Bank of Australia ↑ b
- RBA, Lending to Business: Business Finance Outstanding by Business Size and Industry, Statistical Table D14.1 · Reserve Bank of Australia ↑ b c d
- RBA, Business Lending Rates: Statistical Table F7 · Reserve Bank of Australia ↑ b