First-home buyer affordability by state
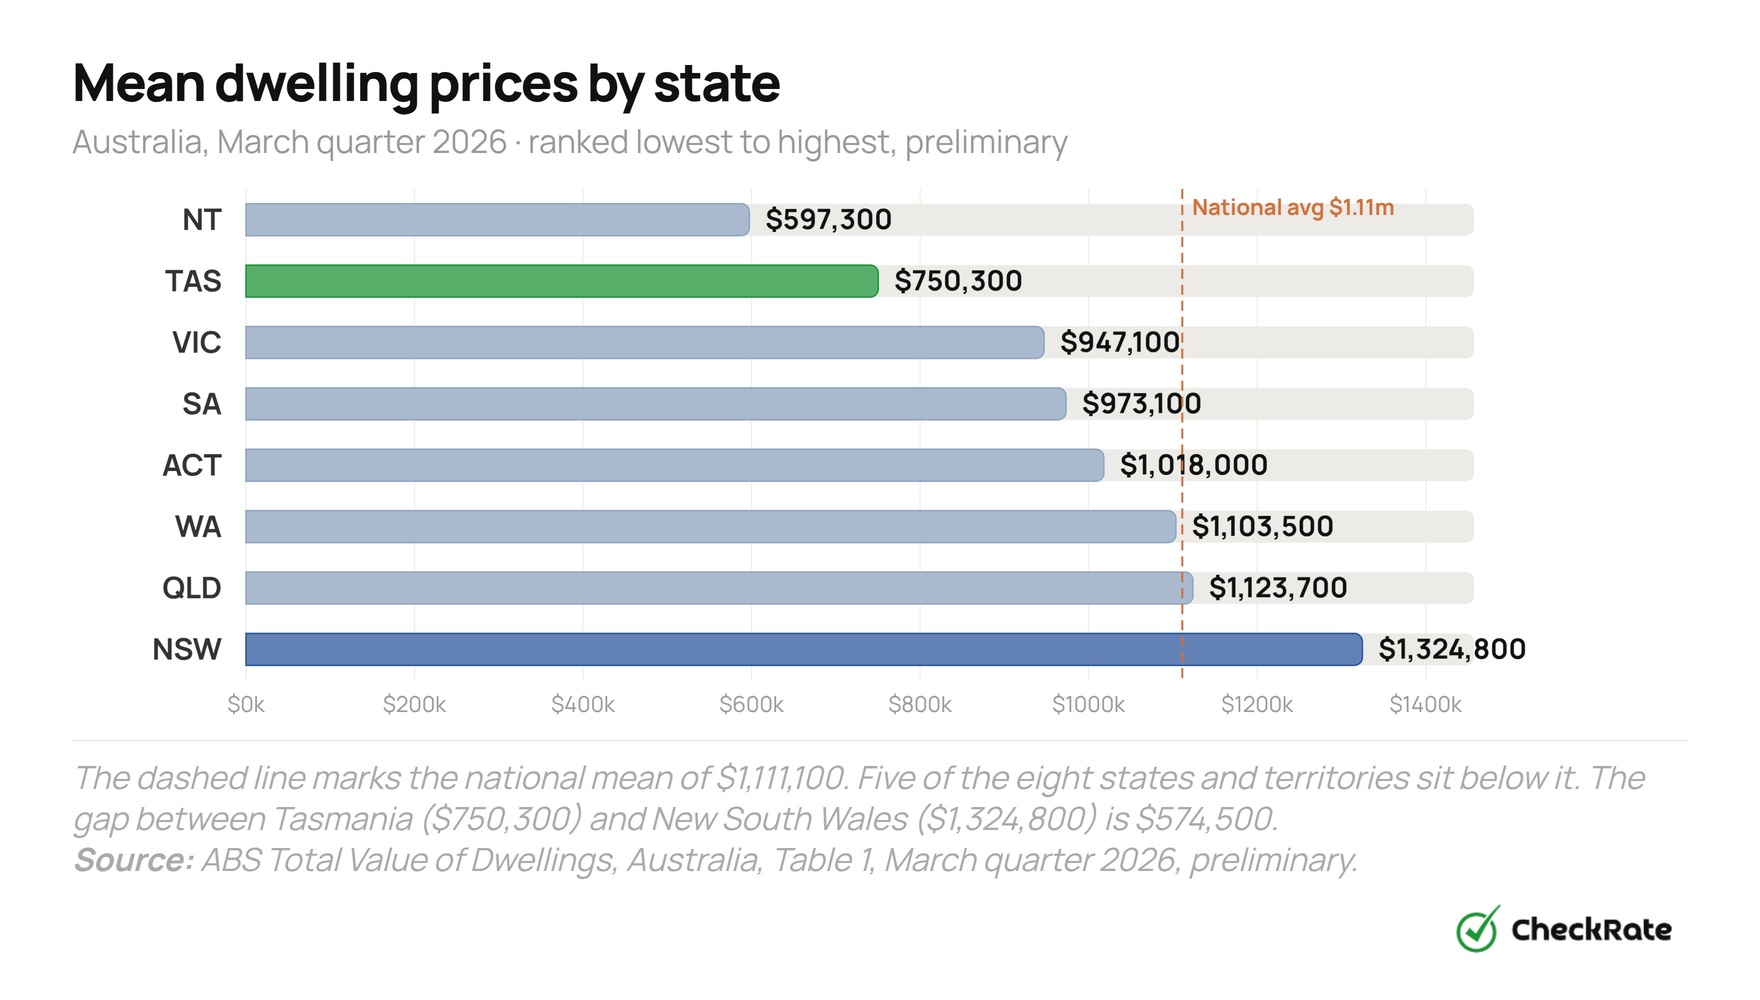
Tasmania had a mean dwelling price of $750,300 in the March quarter 2026, the lowest of any state and 32.5% below the national average of $1,111,100. Victoria was next at $947,100, followed by South Australia at $973,100. New South Wales recorded the highest mean price at $1,324,800, roughly 76% above Tasmania.
When territories are included, the Northern Territory was cheaper at $597,300, and the Australian Capital Territory sat at $1,018,000. The March quarter 2026 figures are preliminary and subject to revision.
The ABS mean dwelling price is based on the estimated value and number of residential dwellings in each jurisdiction. It is not the same as the median price of homes sold during the quarter.
Queensland recorded the sharpest price rise of any state. The mean dwelling price grew from $422,400 in March 2012 to $1,123,700 in March 2026, an increase of about 166%. It moved from being the third most affordable state in 2012 to being more expensive than Western Australia and Victoria by 2026.
First-home buyers tend to purchase lower-priced properties within a market, so their average loan sizes are typically smaller than the state mean price would suggest. The Northern Territory is included for completeness.
| State or territory | Mean dwelling price | vs. national avg | Avg FHB loan | FHB loan count |
|---|---|---|---|---|
| Northern Territory | $597,300 | −46.3% | $491,700 | 181 |
| Tasmania ★ | $750,300 | −32.5% | $485,300 | 556 |
| Victoria | $947,100 | −14.8% | $562,200 | 8,489 |
| South Australia | $973,100 | −12.4% | $580,600 | 1,633 |
| Australian Capital Territory | $1,018,000 | −8.4% | $574,700 | 862 |
| Western Australia | $1,103,500 | −0.7% | $607,300 | 3,515 |
| Queensland | $1,123,700 | +1.1% | $635,600 | 5,284 |
| New South Wales | $1,324,800 | +19.2% | $695,200 | 6,558 |
| Australia | $1,111,100 | — | $614,000 | 27,078 |
| ★ Cheapest state on both measures. Mean dwelling prices: ABS Total Value of Dwellings, Australia, Table 1, March quarter 2026, preliminary. Average FHB loan: derived as total commitment value ÷ number of commitments, using ABS Lending Indicators, Australia, Table 24, March quarter 2026, original series. | ||||

Average first-home buyer loans by state
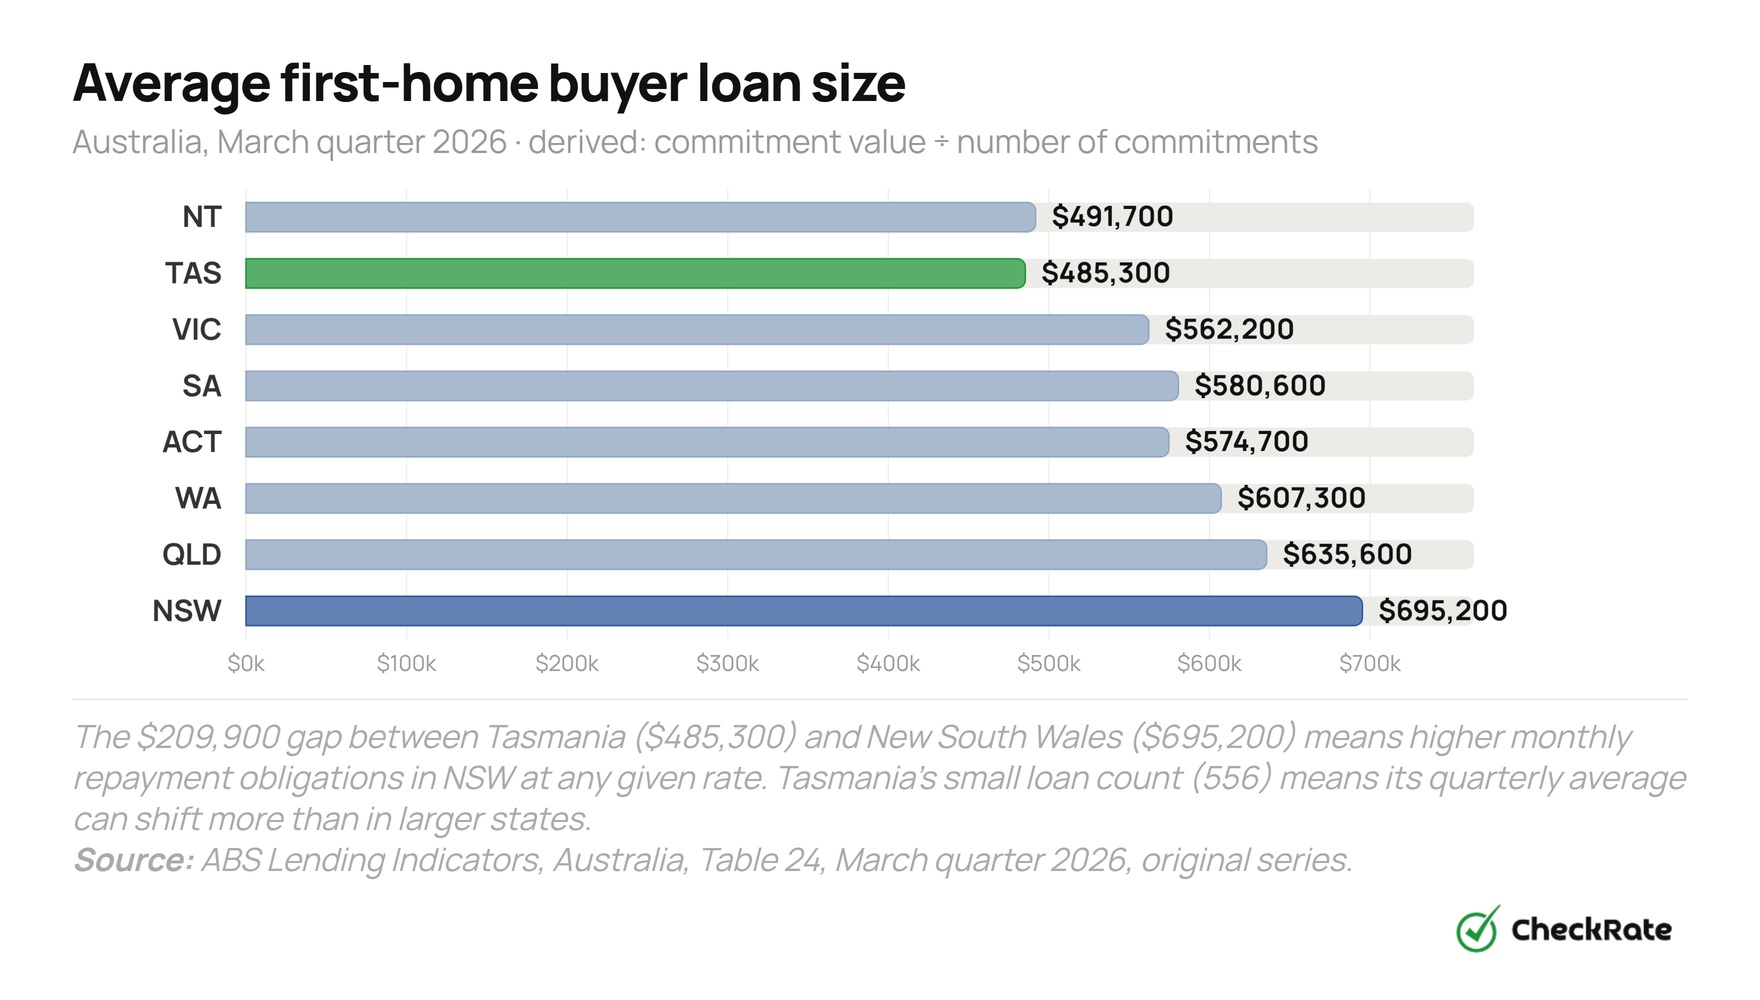
Tasmania had the smallest derived average first-home buyer loan of any state at $485,300 in the March quarter 2026, followed by Victoria at $562,200 and the ACT at $574,700. New South Wales recorded the largest average loan amount at $695,200, a difference of $209,900 from Tasmania.
The average loan is calculated by dividing total first-home buyer owner-occupier commitment value by the number of commitments.
The loan size ranking mostly follows the price ranking, but not exactly. The ACT had a higher mean dwelling price than South Australia, at $1,018,000 compared with $973,100, yet ACT first-home buyers recorded a slightly smaller average loan size, at $574,700 compared with $580,600.
This may reflect differences in the types of properties first-home buyers purchased, the locations they bought in, the sizes of their deposits, or the use of government schemes. The ABS lending data does not isolate these factors.
Nationally, first-home buyers recorded an average loan size of $614,000 across 27,078 new loan commitments in the March quarter 2026. This is a single-quarter snapshot, not an annual total.
Weekly earnings by state and territory
The ACT recorded the highest full-time adult ordinary time earnings at $2,248.40 per week in November 2025, followed by Western Australia at $2,193.20. Tasmania recorded the lowest of any state at $1,821.20 per week, a difference of $427.20 per week or about $22,200 a year compared with the ACT.
Lower dwelling prices in Tasmania are accompanied by lower local earnings, which affects the relationship between prices and incomes in that market. Western Australia's higher earnings similarly sit alongside its higher mean dwelling price. The price-to-income ratio in Section 04 captures this relationship for each state.
All earnings figures are drawn from the ABS series for full-time adult ordinary time earnings, persons, original (not seasonally adjusted). This is the most consistent state-level series available. It excludes part-time workers, overtime, and irregular payments.
| State or territory | Weekly earnings (Nov 2025) | Annual est. (×52) | vs. ACT (highest) |
|---|---|---|---|
| Tasmania | $1,821.20 | $94,702 | −19.0% |
| South Australia | $1,935.10 | $100,625 | −13.9% |
| Northern Territory | $1,942.30 | $101,000 | −13.6% |
| Queensland | $1,994.50 | $103,714 | −11.3% |
| Victoria | $2,013.70 | $104,712 | −10.4% |
| New South Wales | $2,084.00 | $108,368 | −7.3% |
| Western Australia | $2,193.20 | $114,046 | −2.5% |
| Australian Capital Territory ★ | $2,248.40 | $116,917 | — |
| ★ Highest-earning jurisdiction. Annual estimate = weekly figure × 52; does not include overtime or bonuses. Not seasonally adjusted. Source: ABS Average Weekly Earnings, Australia, November 2025. | |||
House prices compared with income by state
New South Wales had the highest price-to-income ratio of any state at 12.2 in the March quarter 2026. This means the mean dwelling price was equivalent to about 12 years of full-time adult gross ordinary-time earnings.
Tasmania had the lowest state ratio at 7.9. The national ratio was 10.6, up from 6.7 in 2012.
The ratio is calculated by dividing the ABS mean dwelling price by estimated annual full-time adult ordinary-time earnings. It is a derived figure, not a published official statistic, and should be read as a broad price-to-income proxy. It does not account for household income, tax, living costs, deposits, borrowing capacity or interest rates.
Every state recorded an increase between 2012 and 2026, though the pace varied considerably. Queensland's ratio rose from 5.9 to 10.8, an increase of more than 80%. New South Wales rose from 7.5 to 12.2.
The Northern Territory was the exception. Its ratio moved from 6.3 to 5.9, as mean dwelling price growth was slower relative to full-time earnings growth over the period.
- 2012
- 2026
- NSW
- VIC
- QLD
- SA
- WA
- TAS
- ACT
How first-home buyer affordability has changed by state
The national mean dwelling price rose from $488,600 in March 2012 to $1,111,100 in March 2026, an increase of about 127%. Full-time adult ordinary time earnings grew by between about 41% and 58%, depending on the state, over the same period, meaning dwelling prices rose at roughly two to three times the pace of wage growth across most markets.
Queensland recorded the largest state-level price increase at about 166%, followed by South Australia (about 158%), Tasmania (about 146%), and New South Wales (about 142%). Western Australia rose by about 107% and Victoria by about 89%.
The Northern Territory recorded much slower growth, with its mean dwelling price rising from $464,600 in 2012 to $597,300 in 2026, an increase of about 29%. This is reflected in its price-to-income ratio, which changed little compared with every state's increase over the same period.
- NSW
- VIC
- QLD
- SA
- WA
- TAS
First-home buyer lending trends in Australia, 2011 to 2025
First-home buyer owner-occupier loan commitments nationally peaked at 162,808 in 2021, before falling to 119,464 by 2025. The 2025 figure remained above the pre-pandemic range of roughly 82,000 to 103,000 per year recorded in the early 2010s.
Average loan sizes moved differently from loan volumes. The national average first-home buyer loan size, calculated from total commitment value divided by the number of commitments, rose from $314,500 in 2011 to $568,500 in 2025, an increase of about 81%.
Between 2021 and 2023, the number of new first-home buyer loans fell sharply while average loan sizes continued to rise. This shows that loan volumes and average borrowing amounts can move in different directions, although the lending data does not isolate the causes.
| Year | FHB loan commitments | Total value ($m) | Avg loan size | YoY change in avg loan |
|---|---|---|---|---|
| 2011 | 85,741 | $26,964m | $314,500 | — |
| 2012 | 91,826 | $29,084m | $316,700 | +0.7% |
| 2014 | 89,371 | $30,206m | $338,000 | +4.2% |
| 2016 | 81,817 | $28,614m | $349,700 | −0.4% |
| 2018 | 103,256 | $38,406m | $371,900 | +5.6% |
| 2020 | 137,720 | $57,257m | $415,700 | +5.2% |
| 2021 (peak volume) | 162,808 | $73,312m | $450,300 | +8.3% |
| 2022 | 118,749 | $57,304m | $482,600 | +7.2% |
| 2023 | 111,094 | $55,652m | $500,900 | +3.8% |
| 2024 | 117,118 | $62,442m | $533,200 | +6.4% |
| 2025 | 119,464 | $67,918m | $568,500 | +6.6% |
| Selected years shown. Avg loan = total value ÷ number of commitments. Owner-occupier FHB new loan commitments. Source: ABS Lending Indicators, Australia, Table 24, first-home buyer owner-occupier new loan commitments, original series. | ||||
First-home buyer grants and concessions by state
The federal Home Guarantee Scheme was expanded from 1 October 2025 to remove income caps, remove the annual cap on places, and raise property price caps across all states and territories.
Under the scheme, eligible first-home buyers can purchase with a deposit from 5%, with the government guaranteeing part of the loan to the lender. This can remove the requirement for lenders mortgage insurance, depending on the buyer, lender and property.
Federal property price caps under the scheme range from $600,000 in the Northern Territory to $1.5 million in NSW capital city and regional centre areas. Tasmania's $700,000 cap is the lowest among the states.
State and territory governments also provide first-home buyer grants and duty concessions, but the settings are not directly comparable. Some schemes offer cash grants for new homes only, while others reduce or waive transfer duty on established homes, new homes or vacant land.
Eligibility rules, property price caps, residence requirements and income limits vary by jurisdiction.
The table below includes settings current or announced as at July 2026. Measures in transition are labelled separately. Policy settings may have changed since publication, so current details should be checked with the relevant state revenue office or Housing Australia.
| State or territory | Federal 5% scheme cap | State grant or duty concession headline |
|---|---|---|
| New South Wales | $1,500,000 (capital city & regional centres) | No transfer duty on existing homes ≤$800,000; reduced rate to $1m. First Home Owner Grant $10,000 for eligible new homes. |
| Victoria | $950,000 (capital city & Geelong) | Duty exemption or concession on homes ≤$750,000. First Home Owner Grant $10,000 for eligible new homes up to $750,000. |
| Queensland | $1,000,000 (capital city, Gold Coast, Sunshine Coast) | First home concession saves up to $24,525 on homes below $800,000. First Home Owner Grant $30,000 for eligible new homes, continued for eligible contracts signed from 1 July 2026. Full duty concession to nil on eligible new homes or vacant land from 1 May 2025. |
| Western Australia | $850,000 (capital city) | First Home Owner Grant up to $10,000 for eligible new homes. Current duty: no duty on homes up to $500,000; concessional rate up to $700,000 (Metro/Peel). Budget measures announced 7 May 2026 would raise these to $600,000 and $800,000 respectively, pending Parliament and system implementation (estimated 28 July 2026). |
| South Australia | $900,000 (capital city) | First Home Owner Grant up to $15,000 for eligible new homes. Eligible contracts from 4 June 2026 may receive relief equivalent to full stamp duty on new or established homes or vacant land. |
| Tasmania | $700,000 (capital city) | Duty exemption on established homes ≤$750,000 applied to settlements between 18 Feb 2024 and 30 June 2026 only. The exemption has not been extended; standard duty rates apply from 1 July 2026. First Home Owner Grant reduced to $20,000 from 1 July 2026 (was $30,000). |
| Australian Capital Territory | $1,000,000 | Home Buyer Concession Scheme: zero duty up to $1,020,000 (from 1 July 2025), with income threshold from $250,000 for buyers with no dependent children. First Home Owner Grant ceased 1 July 2019. |
| Northern Territory | $600,000 (Darwin cap $750,000 from 1 July 2026) | First Home Owner Grant $50,000 for eligible new homes (1 Oct 2024 to 30 Sept 2027). Established-home grant of $10,000 ended 30 Sept 2025. |
| Settings current or announced as at July 2026. Sources: Australian Treasury; Housing Australia; Revenue NSW; State Revenue Office Victoria; Queensland Revenue Office; RevenueWA; RevenueSA; State Revenue Office Tasmania; ACT Revenue Office; Northern Territory Government. | ||
Which state is most affordable for first-home buyers overall?▾
Why is Queensland more expensive than Victoria and Western Australia now?▾
What do the figures show for the Northern Territory?▾
What is the 5% deposit scheme and who is eligible?▾
Which states compare best for first-home buyers?
Tasmania had the lowest mean dwelling price at $750,300, the smallest average first-home buyer loan at $485,300, and the lowest price-to-income ratio at 7.9 of any state in the March quarter 2026.
| State | Mean price (Mar '26) | Avg FHB loan (Mar '26) | Price-to-income (2026) | Weekly earnings (Nov '25) | Federal scheme cap |
|---|---|---|---|---|---|
| Tasmania ★ | $750,300 | $485,300 | 7.9 | $1,821 | $700,000 |
| Victoria | $947,100 | $562,200 | 9.0 | $2,014 | $950,000 |
| South Australia | $973,100 | $580,600 | 9.7 | $1,935 | $900,000 |
| Western Australia | $1,103,500 | $607,300 | 9.7 | $2,193 | $850,000 |
| Queensland | $1,123,700 | $635,600 | 10.8 | $1,995 | $1,000,000 |
| New South Wales | $1,324,800 | $695,200 | 12.2 | $2,084 | $1,500,000 |
| ★ Lowest state on mean dwelling price, average first-home buyer loan size and price-to-income ratio. ACT and NT excluded from state-only comparison. Sources: ABS Total Value of Dwellings, Table 1, Mar qtr 2026; ABS Lending Indicators, Table 24, Mar qtr 2026; ABS Average Weekly Earnings, Nov 2025; Housing Australia Home Guarantee Scheme caps from 1 October 2025. | |||||
Tasmania recorded the lowest mean dwelling price, the smallest average first-home buyer loan, and the lowest price-to-income ratio of any state. Its weekly earnings were also the lowest of any state at $1,821.20 per week in November 2025, which is why the income measure is included in the comparison.
Victoria ranked second on mean dwelling price at $947,100 and second on price-to-income ratio at 9.0, with weekly earnings of $2,013.70.
Western Australia and South Australia recorded the same price-to-income ratio of 9.7, but through different combinations of prices and earnings. Western Australia had a higher mean dwelling price at $1,103,500 and higher weekly earnings at $2,193.20. South Australia had a lower mean dwelling price at $973,100 and lower weekly earnings at $1,935.10.
New South Wales recorded the highest mean dwelling price, the largest average first-home buyer loan, and the highest price-to-income ratio of any state. Its mean dwelling price was $1,324,800, while its average first-home buyer loan was $695,200.
Government support does not follow the same ranking as prices, loans or earnings. Queensland's $30,000 First Home Owner Grant was continued for eligible contracts signed from 1 July 2026, while Tasmania's grant was scheduled to reduce to $20,000 from 1 July 2026. Federal scheme property price caps also vary by state, from $700,000 in Tasmania to $1.5 million in NSW capital city and regional centre areas.
Loan repayments are not shown in the comparison table. At the same interest rate and loan term, different average loan sizes would produce different repayment amounts.
References
- 1ABS: Total Value of Dwellings, Australia, March quarter 2026. Table 1: mean price of residential dwellings by state and territory, preliminary. Released June 2026.
- 2ABS: Lending Indicators, Australia, March quarter 2026. Table 24: first-home buyer owner-occupier new loan commitments, numbers and values, by state. Original series. Released May 2026.
- 3ABS: Average Weekly Earnings, Australia, November 2025. Full-time adult ordinary time earnings, persons, original series, by state and territory. Released February 2026.
- 4Australian Treasury: Supporting people into home ownership. Home Guarantee Scheme policy details, including the 5% Deposit Scheme expansion from 1 October 2025.
- 5Housing Australia: First home buyers to receive unlimited places and higher property price caps from 1 October 2025. Scheme details and property price cap changes.
- 6Revenue NSW: First Home Buyers Assistance Scheme. Transfer duty exemptions and concessions for eligible first-home buyers.
- 7Revenue NSW: First Home Owner (New Homes) Grant. First Home Owner Grant details for eligible new homes.
- 8State Revenue Office Victoria: First home buyer duty exemption or concession. Duty exemption and concession details for eligible first-home buyers.
- 9State Revenue Office Victoria: Understanding the First Home Owner Grant. First Home Owner Grant details for eligible new homes.
- 10Queensland Revenue Office: First home owner grant. First Home Owner Grant details.
- 11Queensland Revenue Office: First home owner grant eligibility. Eligibility details, including continuation of the $30,000 grant for eligible contracts signed from 1 July 2026.
- 12Queensland Revenue Office: Home grants and concessions. First-home buyer grants and transfer duty concessions.
- 13RevenueWA: About the First Home Owner Grant. First Home Owner Grant details and 2026–27 duty threshold update.
- 14RevenueWA: Duties fact sheet, First Home Owner Rate. First home owner rate of duty and pending 2026–27 threshold changes.
- 15RevenueSA: First Home Owner Grant. First Home Owner Grant details.
- 16RevenueSA: 2026–27 State Budget. Stamp duty relief for eligible first-home buyers from 4 June 2026.
- 17State Revenue Office, Tasmania: First Home Owner Grant. First Home Owner Grant settings, including the announced reduction from 1 July 2026.
- 18State Revenue Office Tasmania: First home buyers. First-home buyer duty relief and grant information.
- 19ACT Revenue Office: First Home Owner Grant. Confirmation that First Home Owner Grant payments ceased for transactions from 1 July 2019.
- 20Northern Territory Government: First Home Owner Grant. $50,000 grant for new homes from 1 October 2024 to 30 September 2027.
- 21Northern Territory Government: Buying or building a new home, HomeGrown Territory. HomeGrown Territory Grant details and application timing.
Data Snapshots