

Updated
- Sydney price-to-income
- 11.79×
- The highest figure of any Australian capital city
- Darwin price-to-income
- 5.60×
- The lowest figure of any Australian capital city
- Above the 30% benchmark
- 8 of 8
- All capitals exceed the 30% benchmark at the serviceability-style rate
- Sydney deposit timeline
- 15.7yrs
- Years to save a 20% deposit at 15% of income; 7.5 years in Darwin
 Most affordable states for first-home buyers in 2026Tasmania had a mean dwelling price of $750,300 in the March quarter 2026, the lowest of any state and 32.5% below the national average of $1,111,100. Victoria was next at $947,100, followed by South A…
 Average council rates in Australia: what ratepayers pay by stateAustralian councils and the ACT government collected $25.1 billion in municipal rates in 2024–25, up 49% over the previous decade. This figure covers all rateable land, including residential, commerci…
 Average rent in Australia 2026: rent by state and cityAustralian rent inflation eased to 3.8% year-on-year in February 2026, down from a peak of 7.8% in August 2023. The pace of rent growth has roughly halved over the past 30 months, although rents thems…
Section 01 · Established house price vs income
How do established house prices compare with income by capital city?
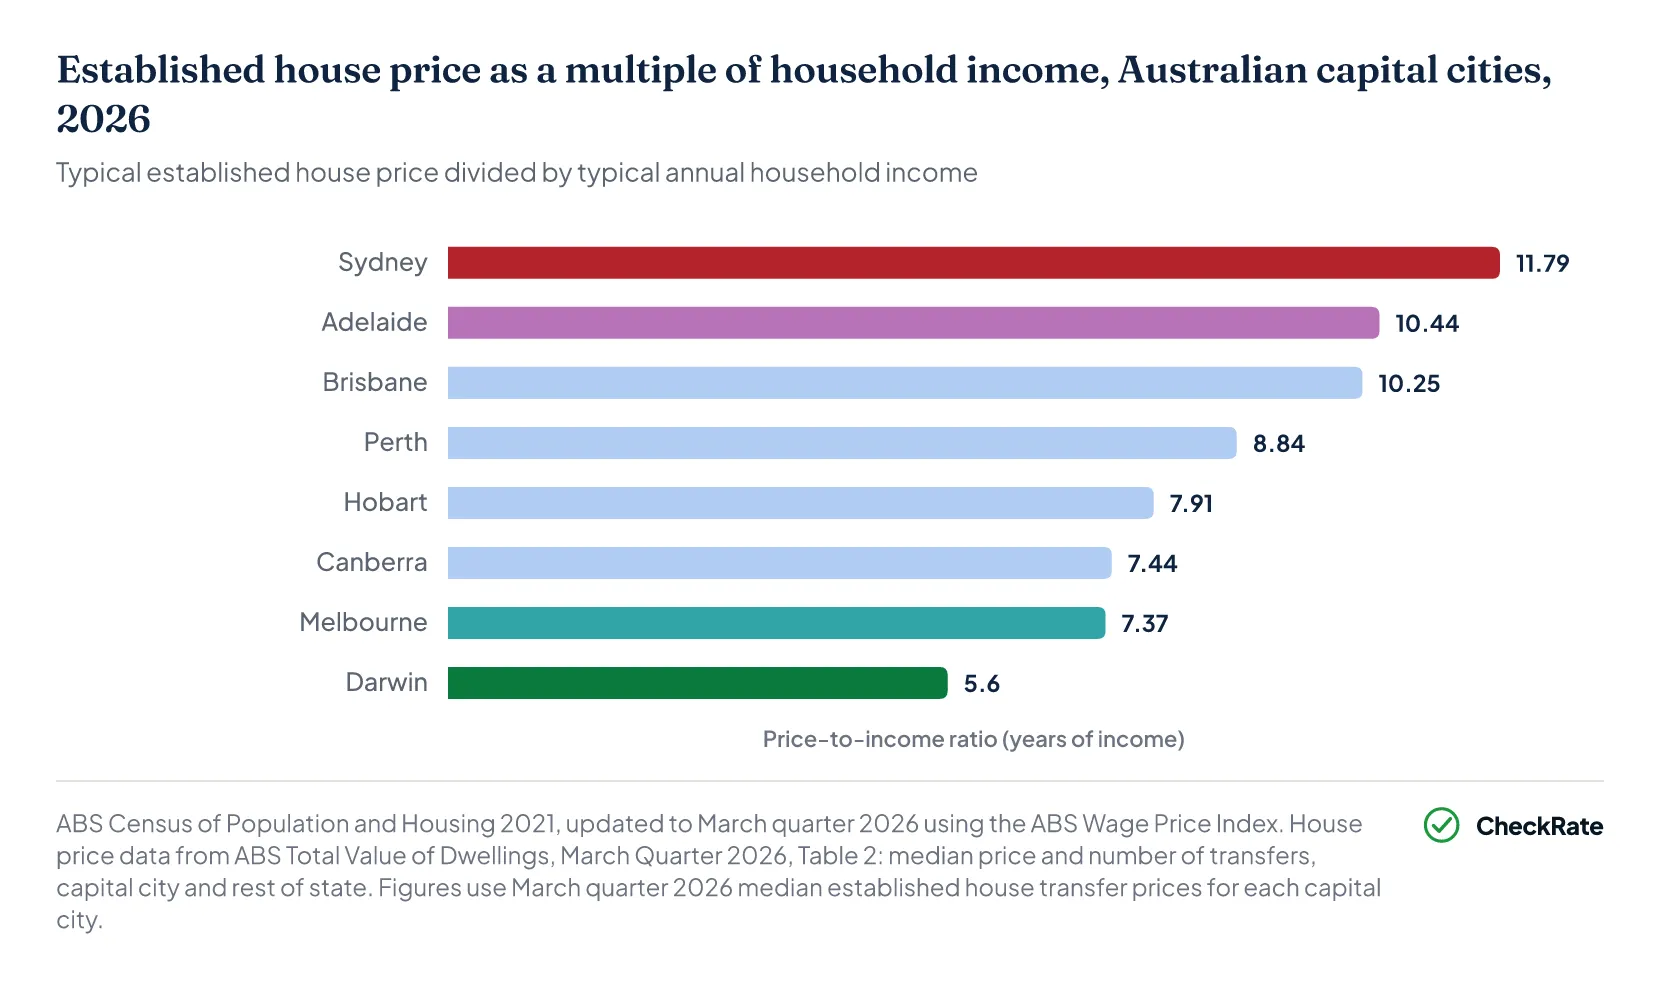
A typical established house costs between 5.60 and 11.79 times yearly household income across Australia's capital cities, with the lowest ratio in Darwin and the highest in Sydney. The measure divides the ABS March quarter 2026 median established house transfer price by household income updated from the 2021 Census using the ABS Wage Price Index, giving a single figure that compares prices against local earnings in each city.
- In Sydney, a typical established house costs 11.79 times yearly household income, the highest figure of any capital city.
- Darwin is the most affordable capital city on this measure. A typical established house there costs 5.60 times yearly household income, supported by lower house prices and higher typical household income.
- Adelaide has the second-highest ratio at 10.44 times yearly household income, followed by Brisbane at 10.25, Perth at 8.84, Hobart at 7.91, Canberra at 7.44 and Melbourne at 7.37.
- Canberra has the highest typical household income of any capital at $143,947 a year, which keeps the city at 7.44 times yearly household income even with a typical established house price of $1,071,300.
| Established house price and price-to-income ratio, Australian capital cities, 2026 | |||
|---|---|---|---|
| City | Typical established house price | Typical annual household income | Years of income |
| Sydney | $1,485,000 | $125,992 | 11.79 |
| Adelaide | $980,000 | $93,902 | 10.44 |
| Brisbane | $1,150,000 | $112,161 | 10.25 |
| Perth | $1,000,000 | $113,132 | 8.84 |
| Hobart | $740,000 | $93,538 | 7.91 |
| Canberra | $1,071,300 | $143,947 | 7.44 |
| Melbourne | $850,000 | $115,315 | 7.37 |
| Darwin | $750,000 | $133,999 | 5.60 |
Section 02 · Modelled loan payments vs income
How much income goes to home loan payments by capital city?
Modelled home loan payments range from 42.8% of typical monthly household income in Darwin to 90.2% in Sydney, and exceed the 30% comparison benchmark in all eight capital cities. The 30% threshold is commonly used as a broad housing-cost benchmark, especially for lower-income households; this article uses it as a comparison threshold, not a borrowing-capacity test. The figures model an 80% loan at a serviceability-style rate, so they sit above what many borrowers would pay at advertised rates.
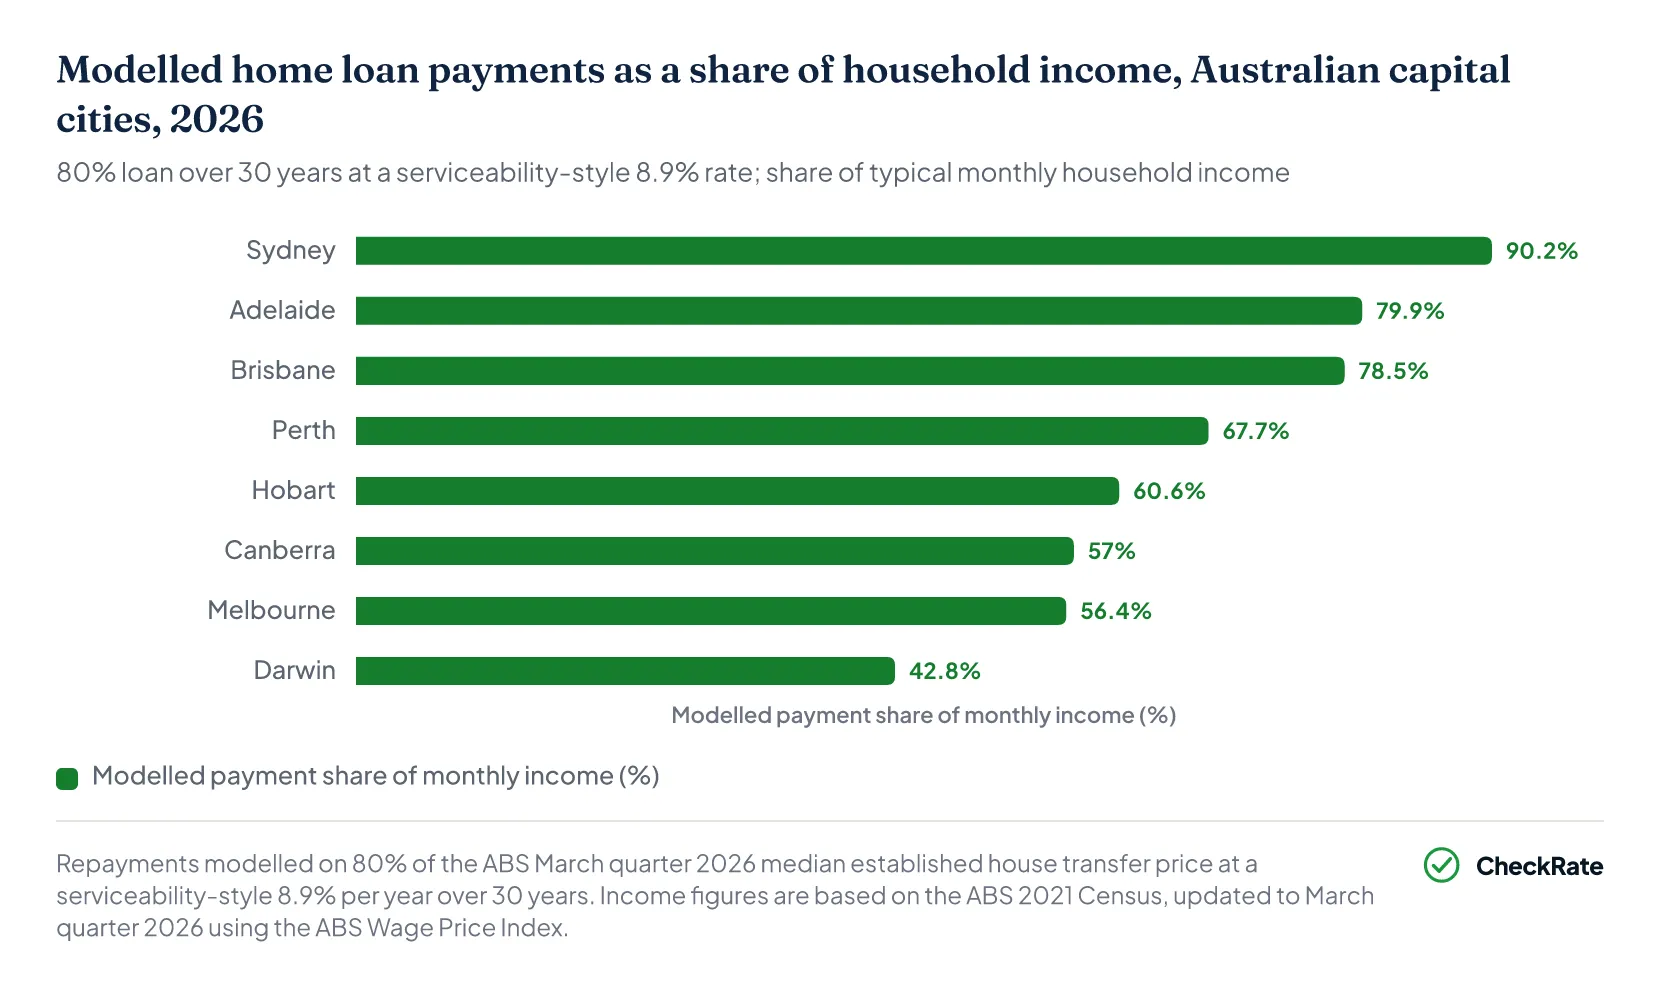
| Modelled monthly home loan payment and share of income, Australian capital cities, 2026 | |||||
|---|---|---|---|---|---|
| City | Amount borrowed | Modelled monthly payment | Monthly income | Share of pay | Above 30% benchmark? |
| Sydney | $1,188,000 | $9,474 | $10,499 | 90.2% | Yes |
| Adelaide | $784,000 | $6,252 | $7,825 | 79.9% | Yes |
| Brisbane | $920,000 | $7,336 | $9,347 | 78.5% | Yes |
| Perth | $800,000 | $6,380 | $9,428 | 67.7% | Yes |
| Hobart | $592,000 | $4,721 | $7,795 | 60.6% | Yes |
| Canberra | $857,040 | $6,834 | $11,996 | 57.0% | Yes |
| Melbourne | $680,000 | $5,423 | $9,610 | 56.4% | Yes |
| Darwin | $600,000 | $4,785 | $11,167 | 42.8% | Yes |
Section 03 · Saving a deposit
How long does it take to save a 20% deposit by city?
Saving a 20% deposit takes from 7.5 years in Darwin to 15.7 years in Sydney, a gap of 8.2 years across the eight capital cities. The estimate assumes a household saves 15% of typical yearly income, starting from zero; the spread tracks differences in established house prices and household incomes by city.
- In Sydney, a 20% deposit comes to $297,000, the largest of any capital. At a saving rate of 15% of typical yearly household income, the timeline is 15.7 years.
- In Darwin, the same deposit is $150,000, $147,000 less than Sydney's, and it takes 7.5 years to save.
- Adelaide at 13.9 years and Brisbane at 13.7 years take the second and third longest of any capital, for different reasons: Adelaide's timeline is long relative to its $980,000 established house price because its household income is the second-lowest of any capital, while Brisbane's reflects its $1,150,000 established house price, the second-highest after Sydney.
- Melbourne has the shortest timeline after Darwin at 9.8 years, 0.1 years below Canberra's 9.9 years; Canberra's larger deposit of $214,260 is offset by household income of $143,947, the highest of any capital.
- Hobart takes 10.5 years and Perth 11.8 years, placing them between Canberra's 9.9 years and Brisbane's 13.7 years.
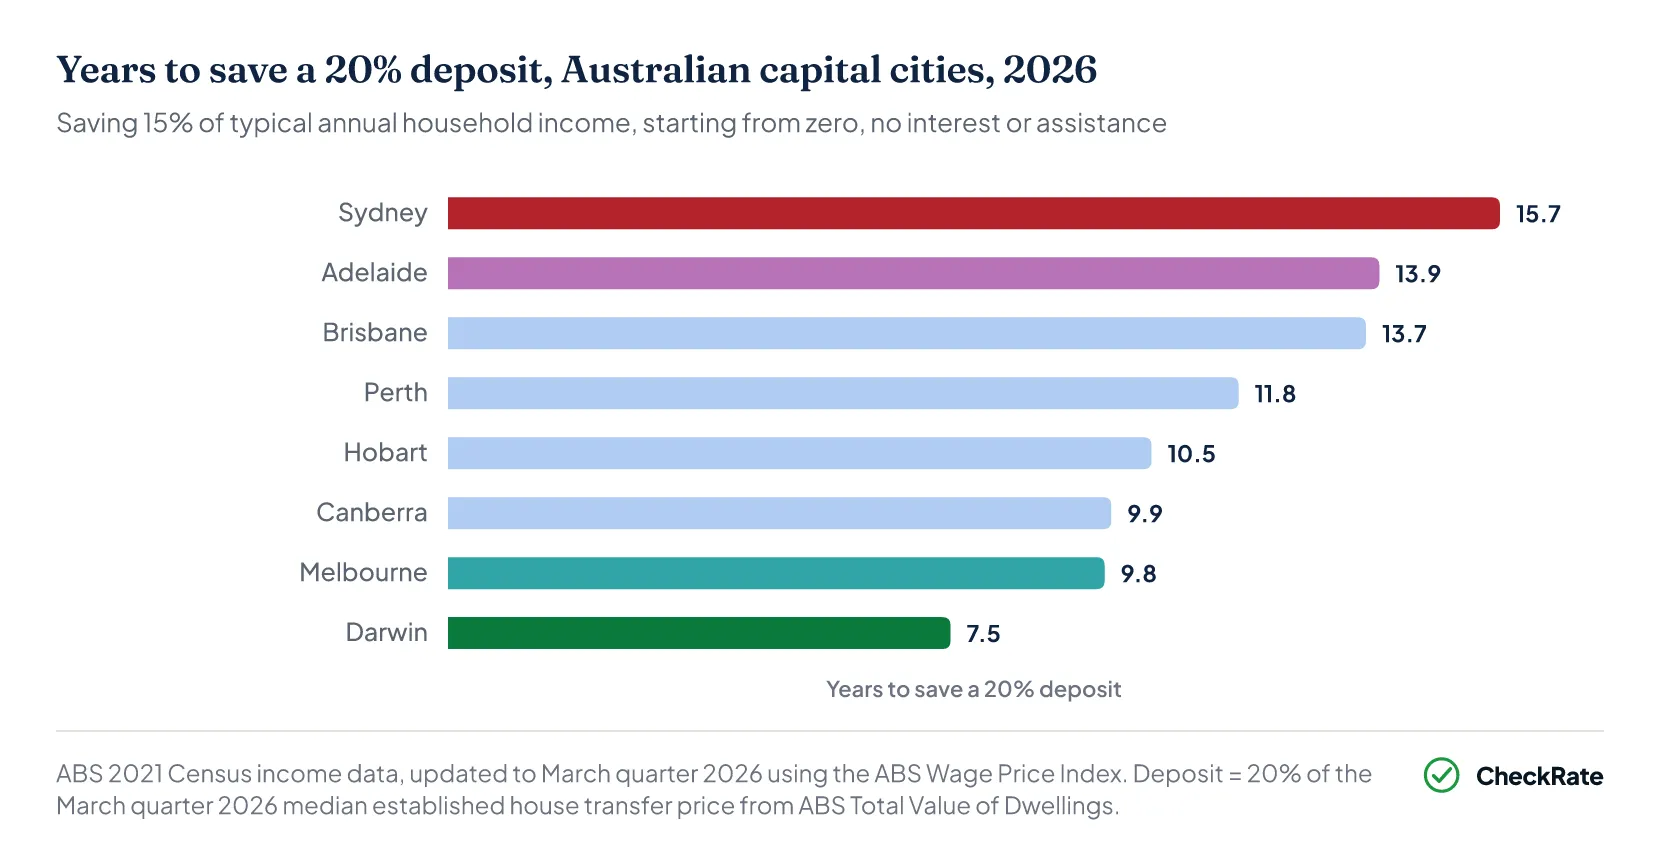
| Years to save a 20% deposit, Australian capital cities, 2026 | |||
|---|---|---|---|
| City | 20% deposit needed | Saved per year (15% of income) | Years to save |
| Sydney | $297,000 | $18,899 | 15.7 years |
| Adelaide | $196,000 | $14,085 | 13.9 years |
| Brisbane | $230,000 | $16,824 | 13.7 years |
| Perth | $200,000 | $16,970 | 11.8 years |
| Hobart | $148,000 | $14,031 | 10.5 years |
| Canberra | $214,260 | $21,592 | 9.9 years |
| Melbourne | $170,000 | $17,297 | 9.8 years |
| Darwin | $150,000 | $20,100 | 7.5 years |
Section 04 · Most affordable
Why Darwin ranks as the most affordable capital city
Darwin records the lowest figure on all three measures: a price-to-income ratio of 5.60, a modelled repayment share of 42.8%, and a 7.5-year deposit timeline. It is the only capital to rank lowest on each. Hobart has the lowest typical established house price at $740,000, $10,000 below Darwin's $750,000, but its household income of $93,538 compared with Darwin's $133,999 places it behind Darwin on affordability.
Melbourne at 9.8 years and Canberra at 9.9 years have the shortest deposit timelines after Darwin's 7.5 years. Hobart's modelled loan payment of $4,721 a month is the lowest of any capital in dollar terms, but household income of $93,538 means the payment still takes 60.6% of monthly pay.
Darwin
Lowest on all three measures. An established house costs 5.60× yearly income, modelled payments take 42.8% of pay, and the deposit takes 7.5 years to save.
Melbourne
The shortest deposit timeline after Darwin at 9.8 years. Modelled payments take 56.4% of pay, the lowest share of any capital except Darwin.
Canberra
Highest typical household income of any capital city at $143,947/yr keeps modelled payments at 57.0% of pay and the timeline at 9.9 years, with a typical established house price of $1,071,300.
Hobart
The lowest modelled monthly payment in dollar terms ($4,721/month), though on household income of $93,538 it still takes 60.6% of monthly pay.
Section 05 · Least affordable
Which Australian capital city is least affordable?
Sydney records the highest figure on all three measures: a price-to-income ratio of 11.79, a modelled repayment share of 90.2%, and a 15.7-year deposit timeline. Adelaide ranks second on each, even though its typical established house price of $980,000 sits below Perth's $1,000,000, the difference comes down to Adelaide's lower household income.
Section 06 · City comparison
Capital city affordability measures compared
Across the three measures, the same order holds: Sydney ranks least affordable and Darwin ranks most affordable, with the deposit timeline spanning 7.5 to 15.7 years, the price-to-income ratio ranging from 5.60 to 11.79, and the modelled repayment share ranging from 42.8% to 90.2%. Cities below are ordered from least to most affordable by deposit timeline; red marks the three least affordable cities on this measure, while green marks the two most affordable.
| Affordability across all three measures, Australian capital cities, 2026 | ||||||
|---|---|---|---|---|---|---|
| City | Established house price | 20% deposit | Annual saving | Years to save | Price/income | Share of monthly pay |
| Sydney | $1,485,000 | $297,000 | $18,899/yr | 15.7 yrs | 11.79× | 90.2% |
| Adelaide | $980,000 | $196,000 | $14,085/yr | 13.9 yrs | 10.44× | 79.9% |
| Brisbane | $1,150,000 | $230,000 | $16,824/yr | 13.7 yrs | 10.25× | 78.5% |
| Perth | $1,000,000 | $200,000 | $16,970/yr | 11.8 yrs | 8.84× | 67.7% |
| Hobart | $740,000 | $148,000 | $14,031/yr | 10.5 yrs | 7.91× | 60.6% |
| Canberra | $1,071,300 | $214,260 | $21,592/yr | 9.9 yrs | 7.44× | 57.0% |
| Melbourne | $850,000 | $170,000 | $17,297/yr | 9.8 yrs | 7.37× | 56.4% |
| Darwin | $750,000 | $150,000 | $20,100/yr | 7.5 yrs | 5.60× | 42.8% |
- Typical established house price
- $1.49M
- 20% deposit needed
- $297,000
- Annual saving (15% of income)
- $18,899/yr
- Years to save
- 15.7 yrs
- House price to yearly income
- 11.79×
- Modelled payments share of pay
- 90.2%%
- Typical established house price
- $980,000
- 20% deposit needed
- $196,000
- Annual saving (15% of income)
- $14,085/yr
- Years to save
- 13.9 yrs
- House price to yearly income
- 10.44×
- Modelled payments share of pay
- 79.9%%
- Typical established house price
- $1.15M
- 20% deposit needed
- $230,000
- Annual saving (15% of income)
- $16,824/yr
- Years to save
- 13.7 yrs
- House price to yearly income
- 10.25×
- Modelled payments share of pay
- 78.5%%
- Typical established house price
- $1M
- 20% deposit needed
- $200,000
- Annual saving (15% of income)
- $16,970/yr
- Years to save
- 11.8 yrs
- House price to yearly income
- 8.84×
- Modelled payments share of pay
- 67.7%%
- Typical established house price
- $740,000
- 20% deposit needed
- $148,000
- Annual saving (15% of income)
- $14,031/yr
- Years to save
- 10.5 yrs
- House price to yearly income
- 7.91×
- Modelled payments share of pay
- 60.6%%
- Typical established house price
- $1.07M
- 20% deposit needed
- $214,260
- Annual saving (15% of income)
- $21,592/yr
- Years to save
- 9.9 yrs
- House price to yearly income
- 7.44×
- Modelled payments share of pay
- 57%%
- Typical established house price
- $850,000
- 20% deposit needed
- $170,000
- Annual saving (15% of income)
- $17,297/yr
- Years to save
- 9.8 yrs
- House price to yearly income
- 7.37×
- Modelled payments share of pay
- 56.4%%
- Typical established house price
- $750,000
- 20% deposit needed
- $150,000
- Annual saving (15% of income)
- $20,100/yr
- Years to save
- 7.5 yrs
- House price to yearly income
- 5.6×
- Modelled payments share of pay
- 42.8%%
Section 07 · Why cities differ
Why do affordability gaps differ between capital cities?
Household income, not price, is what separates the closest-priced capitals. Adelaide and Perth differ by just $20,000 on price, yet land at very different price-to-income ratios, at 10.44 compared with 8.84, because Perth's typical household income runs well ahead of Adelaide's. The same pattern runs through the wider table: the cities that rank as most affordable in this comparison tend to pair moderate prices with relatively high incomes, rather than simply having the cheapest houses.
Darwin also ranks most affordably because it combines a typical established house price of $750,000 with household income of $133,999, the second-highest of any capital after Canberra and above Sydney, Melbourne, Brisbane, Perth, Adelaide and Hobart. Sydney sits at the other end of the table, with a typical established house price equal to 11.79 times yearly household income.
Section 08 · Regional areas
Are regional areas more affordable than capital cities?
Capital city established house prices in this data span $745,000, from $740,000 in Hobart to $1,485,000 in Sydney. Regional towns fall outside this capital-city comparison, and a lower regional price tag does not by itself settle whether an area is more affordable, because local incomes and access to services also vary.
- Regional towns sit outside this dataset, so this comparison cannot rank them against the capitals. The ABS source also includes rest-of-state figures, but those figures combine many different regional markets and are not used in this capital-city ranking.
- Regional areas can also differ from capital cities in wages, job availability, and access to services like hospitals, schools, and public transport. These broader trade-offs vary by location and are not captured in a price-only comparison or in this article's data.
- Some regional areas, particularly those close to a capital city or in a mining area, may have recorded price rises in recent years and may not be as affordable as a low headline price suggests.
- A broader affordability comparison includes both typical local established house prices and typical local income. This can give a clearer measure than prices alone.
References
- ABS 2021 Census of Population and Housing, All persons QuickStats · Australian Bureau of Statistics
- ABS Wage Price Index, Australia · Australian Bureau of Statistics
- ABS Total Value of Dwellings, March quarter 2026 · Australian Bureau of Statistics
- AIHW, Housing affordability (Australia's welfare) · aihw.gov.au
- RBA, Lenders' Interest Rates (Statistical Table F6) — housing rates, February 2026 · Reserve Bank of Australia
- APRA announces update to macroprudential policy settings (3 percentage point serviceability buffer) · apra.gov.au