

Published
- Total national municipal rate revenue
- $25.1bn
- 2024–25, up from $16.9 billion a decade earlier
- ACT Treasury's modelled Canberra household scenario
- $4,241
- 2025–26
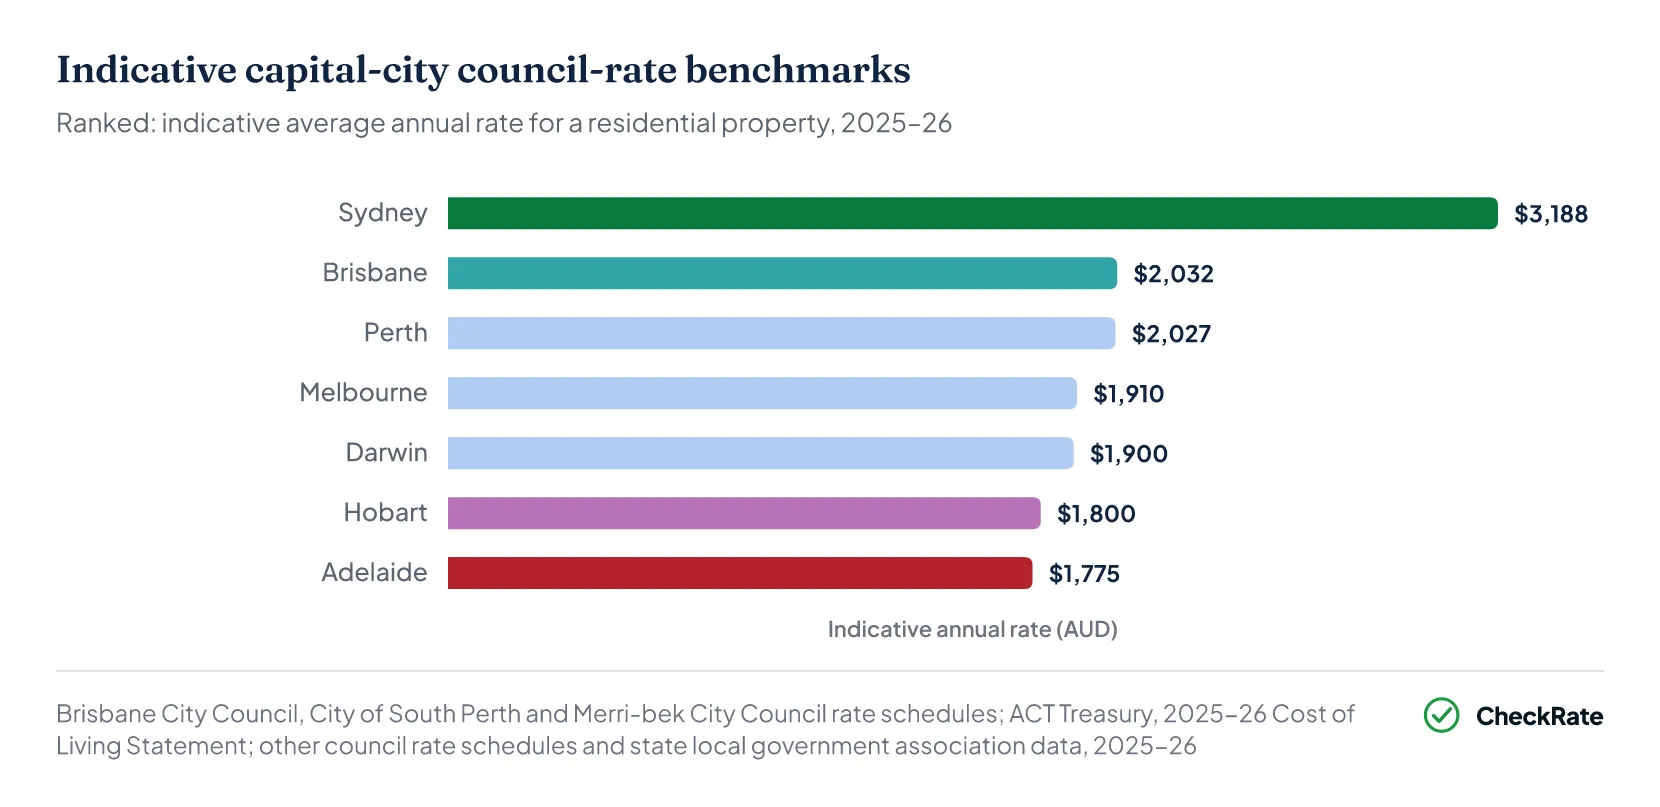
- Highest indicative capital-city average annual rate
- $3,188
- Sydney (NSW)
- Growth in national municipal rate revenue
- 48.8%
- Past 10 years, 2015–16 to 2024–25
 Stamp duty by state: how much do home buyers pay in Australia?For most home buyers, stamp duty is the single biggest upfront cost after the deposit, adding between $28,949 and $54,151 at average state dwelling prices in March quarter 2026. It is a state governme…
 How much does it cost to buy a house in Australia?Applying a 5% allowance for non-deposit upfront costs to the national median house price of $925,500 adds around $46,275 to the cash required at settlement. On the national mean dwelling price of $1,1…
 Which Australian capital city is most affordable for buying a house?A typical established house costs between 5.60 and 11.79 times yearly household income across Australia's capital cities, with the lowest ratio in Darwin and the highest in Sydney. The measure divides…
Section 01 · What is a council rate
What are council rates and how do they work in Australia?
Australian councils and the ACT government collected $25.1 billion in municipal rates in 2024–25, up 49% over the previous decade. This figure covers all rateable land, including residential, commercial, industrial and rural properties, not residential ratepayers alone. The amount an individual property owner pays depends on the property's official value, the council's rate settings and any fixed charges added to the notice.
Unlike a power or water bill, council rates are not based on how much a person uses local services. A higher-value property usually pays more, but rate revenue is pooled and spent on shared local infrastructure and services. Most properties must pay rates. Depending on the state or territory, some land may be exempt, including certain Crown, charitable, religious or educational land. Each year, a council sets a rate multiplier, applies it to each property's official value, then adds fixed charges where they apply.
Roads & footpaths
Construction, sealing, resurfacing, and ongoing maintenance of local roads, kerbing, gutters, and pedestrian paths.
Parks & open space
Maintenance of parks, ovals, playgrounds, street trees, and public green space across the local area.
Waste & recycling
Kerbside rubbish, recycling, and green waste collection, tip access, and household hazardous waste programmes.
Public libraries
Staffing, collections, digital resources, and building operations across branch and regional library networks.
Emergency management
Local flood and fire mitigation, evacuation infrastructure, emergency planning, and state emergency services levy contributions.
Community facilities
Aquatic centres, community halls, aged care services, arts facilities, childcare support, and local planning administration.
How a council rates notice is structured
Every rates notice has two main parts. The first is a variable charge based on the property's official value, which is usually set by a government valuer. The second is a set of fixed charges that can apply regardless of property value. These fixed charges, mainly waste collection and emergency services levies, help explain why a unit owner can sometimes pay a similar total bill to a nearby house owner despite owning a lower-value property.
1Variable component: scales with the property value
- General rate
Government-assessed property value × the council's rate multiplier — Varies per property
2Fixed, minimum or service-based components: may apply depending on property type, council and services used
- Waste collection charge
Set by the council; covers kerbside pickup and recycling services — Flat fee
- State emergency services levy
Collected by the council on behalf of the state government — Flat fee
- Minimum rate
Applied when the standard rate charge falls below the council's minimum (e.g. $1,206 in West Torrens, SA for 2025–26) — If applicable
3Total annual rates notice
- General rate + fixed charges
Payable annually or in quarterly instalments. Issued July–August each year.
Council rates payment options and due dates
Councils usually send rates notices at the start of each financial year, often between July and August. Notices may arrive by post or email. Most councils allow ratepayers to pay the full annual amount upfront or split the bill across quarterly instalments. Late payment can attract penalty interest.
Payment dates are indicative. Exact due dates are printed on the rates notice and vary by council. Many councils offer quarterly instalments, and some also offer monthly direct debit, though exact payment options are set by each council and jurisdiction. Many councils publish hardship policies or payment arrangement options for ratepayers experiencing payment difficulty.
Option A: annual payment
Pay the full year in a single transaction
- July – August
Rates notice issued and sent to the property owner
- August – September
Full annual amount due. Exact date is printed on the rates notice.
- Late payment
Penalty interest applies from the due date. Victoria: 10% a year. Brisbane: 12.12% a year in 2025–26, rising to 12.19% for 2026–27, charged daily.
Option B: quarterly instalments
Four equal payments spread across the financial year
- September
First instalment due
- December
Second instalment due
- March
Third instalment due
- June
Final instalment due (financial year closes)
Are council rates the same as land tax?
No. Council rates are levied by local councils on all rateable properties, including owner-occupied homes, and fund local services such as roads, parks and waste collection. Land tax is a state government charge that generally applies to investment properties and land holdings above a threshold; it does not usually apply to a principal place of residence. Both are calculated using an official property value, but they are set by different levels of government, collected separately, and used for different purposes.
Who is exempt from paying council rates?
Most properties must pay council rates, but some categories are exempt. Common exemptions include land owned by the Crown, land used for public worship such as churches, and land owned by schools and registered charities. Eligibility rules differ by state and territory, and some councils offer pensioner concessions that reduce the amount payable rather than removing the obligation entirely. Exemption and concession applications are usually handled by the relevant council and may require supporting documentation.
Section 02 · Council rates by state
Average council rates by state and capital city
Canberra's indicative figure of $4,241 is higher than every other capital-city benchmark used here, but it is not a like-for-like city average. It comes from ACT Treasury's Cost of Living Statement, which models household scenarios rather than publishing a single territory-wide rates figure. The $4,241 figure is the "Rates, PFESL, SFL, Health Levy" line for one scenario: a single, fixed-income retiree in an owner-occupied house in Cook, in the 2025–26 Budget papers. The ACT is also structurally different from the other capitals because it operates as a single-tier government with no separate municipal councils, and its long-running tax reform programme has shifted more revenue away from stamp duty and toward general rates. This makes ACT rates structurally different from council rates in other states.
Brisbane's indicative rates-only figure of around $2,032 is based on a $1,519 general rate for an owner-occupied house plus a standard $513 Waste Utility Charge, both published by Brisbane City Council for 2025–26. This separates council rates and waste charges from water and sewerage charges, which are billed separately in Brisbane and can make combined property-related bills look much higher.
Victoria also limits how much councils can increase their total rate revenue each year. The cap was 3.0% for 2025–26, and the Essential Services Commission has since set a lower cap of 2.75% for 2026–27. That means councils cannot automatically convert rising property values into equivalent increases in total rate revenue.
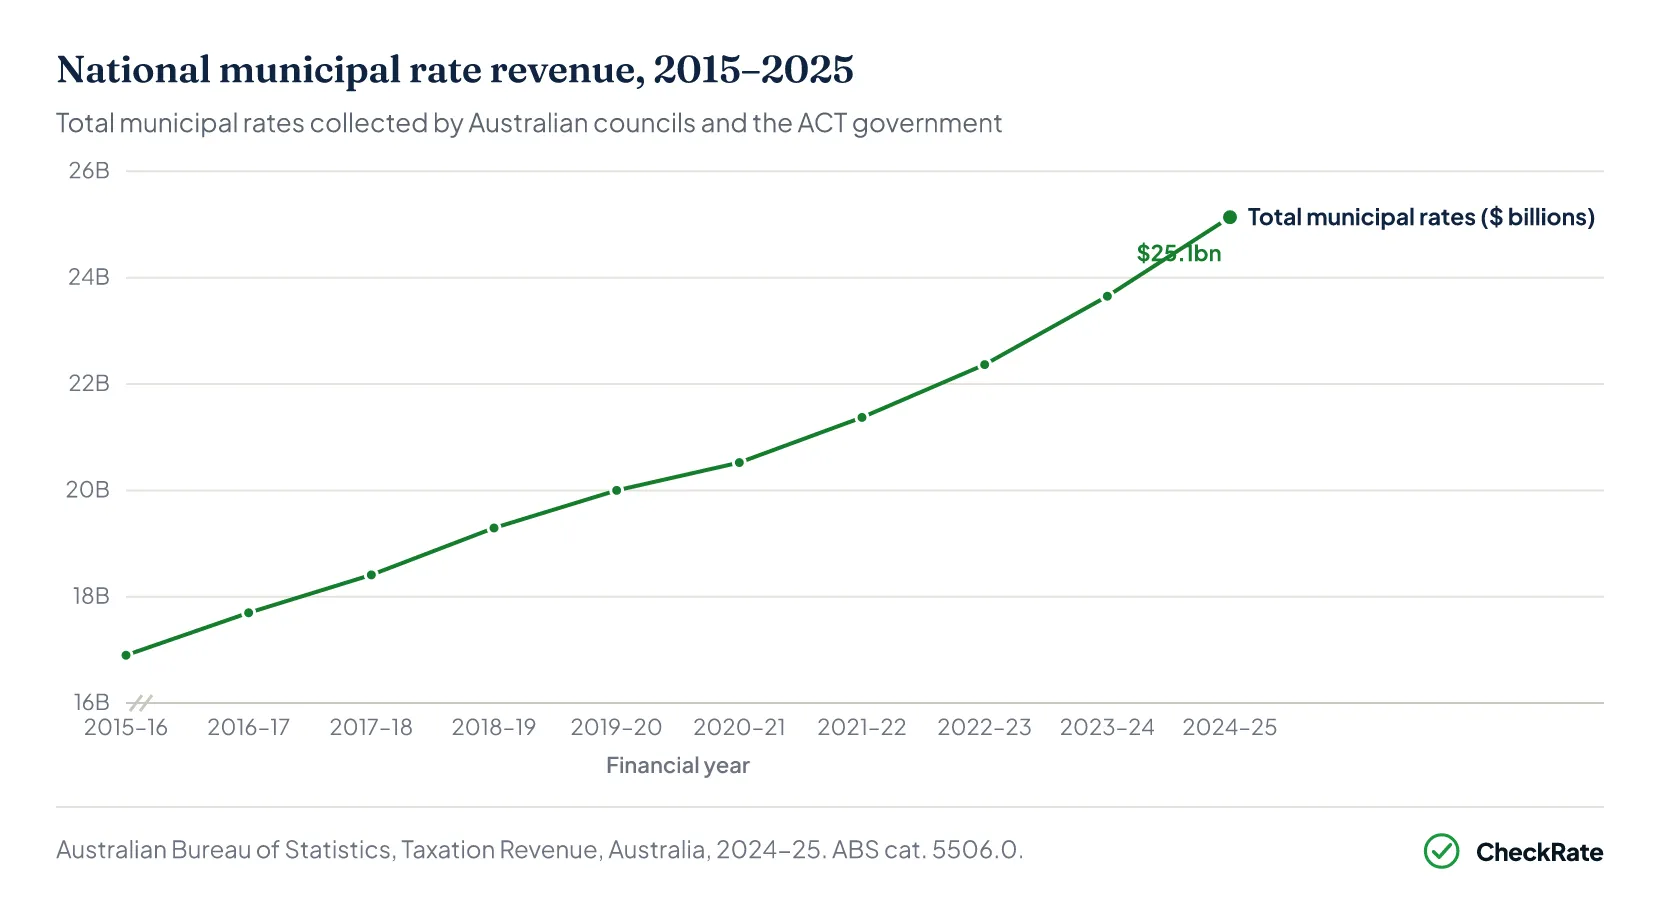
Property values increased across Australia over this period, but rate revenue growth does not come from property values alone. Total collections can also rise when the number of rateable properties increases, when councils change budgets or when charges and levies are adjusted. Victoria's rate cap limits annual increases in council rate revenue.
| Municipal rate revenue by state, 2024–25 | ||
|---|---|---|
| State or territory | Total rate revenue | 10-year change |
| Victoria | $6,636m | +39.8% |
| New South Wales | $6,200m | +49.5% |
| Queensland | $5,455m | +55.2% |
| Western Australia | $3,152m | +47.1% |
| South Australia | $2,134m | +48.8% |
| ACT | $812m | +92.0% |
| Tasmania | $568m | +51.5% |
| Northern Territory | $182m | +51.7% |
| Australia total | $25,138m | +48.8% |
Source · Australian Bureau of Statistics, Taxation Revenue, Australia, 2024–25, detailed local government rates revenue tables; ACT Treasury, Budget 2025–26 for ACT general rates revenue.
The state totals can seem counterintuitive. NSW has more residential dwellings than Victoria, and Sydney's own average rate is higher than Melbourne's, yet Victoria collects more total rate revenue than NSW. This likely reflects differences in valuation bases, rate multipliers and the mix of properties across each state's full population of councils, rather than any single explanation. Queensland and Western Australia have seen strong growth in total collections, which may reflect population growth adding new rateable properties to the system.
Why is Brisbane's council rate lower than some other published comparisons suggest?
Some city-rate comparisons add council rates together with separate water and sewerage charges billed by a retailer such as Urban Utilities, producing a combined figure that can exceed $4,000 for Brisbane. That combined figure describes a household's total property-related bill, not the council rate on its own. Brisbane City Council's own published schedule shows a general rate of $1,519 for an owner-occupied house in 2025–26, plus a standard Waste Utility Charge of around $513, giving an indicative rates-only total of about $2,032, in a similar range to Perth and Melbourne rather than the higher figure a combined rates-and-utilities calculation can suggest.
Does Victoria cap how much councils can raise rates each year?
Yes. Victoria is the only Australian state with a legislated annual rate cap, set by the Essential Services Commission. The cap was 3.0% for 2025–26 and has been set at 2.75% for 2026–27, meaning councils cannot increase their total rate revenue by more than that amount in a single year unless an exemption is approved. The cap limits how much of a rising property market flows through to higher rate bills. Even if median property values rise by 10%, a capped council cannot collect more than the approved percentage extra in total rates revenue. Some councils may apply to the ESC for a higher cap, but these applications must be individually assessed and approved.
Section 03 · Council rates for houses
Which capital city has the highest council rates for houses?
Among the seven non-ACT capital-city benchmarks used in this article, the indicative annual council-rate figure ranges from $1,775 in South Australia to $3,188 in New South Wales. These are capital-city proxies, not state-wide averages. The ACT's $4,241 figure sits above this range, but it is a modelled ACT Treasury household scenario rather than a directly comparable benchmark, so it is shown separately.
As a share of median house value, the ACT scenario is higher than any of the seven benchmarks at 0.40%. Because it is a single household scenario, that percentage should not be compared directly with the other figures. Among the seven benchmark states, the Northern Territory and Tasmania are highest at 0.25% and 0.24%, while Queensland and South Australia are lowest at around 0.18%. NSW has the highest capital-city median house price in the table at $1,485,000, and its indicative rate works out to 0.21% of that value.
Once Brisbane's figure is separated from water and sewerage charges, Queensland no longer appears as a high-rate jurisdiction in this proxy calculation. It sits among the lowest, alongside South Australia.
| Indicative council-rate benchmarks for houses by state, 2025–26 | |||
|---|---|---|---|
| State (capital city) | Median house price | Benchmark annual rate | Rate as % of value |
| NSW (Sydney) | $1,485,000 | $3,188 | 0.21% |
| VIC (Melbourne) | $850,000 | $1,910 | 0.22% |
| QLD (Brisbane) | $1,150,000 | $2,032 | 0.18% |
| SA (Adelaide) | $980,000 | $1,775 | 0.18% |
| WA (Perth) | $1,000,000 | $2,027 | 0.20% |
| TAS (Hobart) | $740,000 | $1,800 | 0.24% |
| NT (Darwin) | $750,000 | $1,900 | 0.25% |
| ACT (Canberra)* | $1,071,300 | $4,241 | 0.40% |
Source · Australian Bureau of Statistics, Total Value of Dwellings, March Quarter 2026, Table 2: Median Price and Number of Transfers; Brisbane City Council, City of South Perth, Merri-bek City Council, ACT Treasury and other council rate schedules, 2025–26.
A higher property price does not automatically mean a higher rate bill. NSW has the highest median house price in the country but a below-average effective rate percentage, since Sydney's rate multiplier is applied to a larger property value base. Queensland's earlier appearance of having a high effective rate was an artefact of combining rates with water and sewerage charges; on a rates-only basis it is one of the lowest in the country.
Do council rates automatically rise when property prices go up?
Not automatically. A council sets how much total revenue it needs each year, then derives a rate multiplier by dividing that amount by the combined official value of all properties in its area. If property values across the council area all rise by the same percentage, the multiplier falls proportionally, and individual bills remain broadly flat. In practice, rates tend to rise over time because councils increase their budgets each year. But a rise in median sale prices does not directly translate into a higher rates bill. The official valuation used for rates can also differ from what a property would sell for on the open market.
Why is the ACT's council rate the highest in Australia as a percentage of property value?
Two factors combine here, though the comparison needs care because the ACT figure used in this article is a single household scenario, not a territory-wide average. First, the ACT operates as a single-jurisdiction local government covering the entire territory, so there are no separate municipal councils to share the cost. Second, the ACT's tax reform programme has shifted revenue away from stamp duty and toward general rates, so a larger share of ACT government revenue is collected through the rates system than in states that raise more of their property-related revenue through a separate land tax. At 0.40% of median house value and 0.68% of median unit value, the ACT Treasury scenario used here is higher than every state average, but those percentages describe one modelled household, not a territory-wide figure, so they are not on the same footing as the state averages elsewhere in this article.
Section 04 · Council rates for units
Do unit owners pay higher council rates than house owners?
When the same indicative annual rate is compared with median house and unit prices in each capital city, units show a higher rate as a percentage of property value than houses in the same city. The gap is widest for the ACT scenario, where the modelled house is charged at 0.40% of property value and the modelled unit at 0.68%, a difference of 0.28 percentage points. This reflects one ACT Treasury household bill measured against two different median prices, not separately observed house and unit rates. Elsewhere, the gap is narrower: in Queensland, once the rates figure is corrected to exclude water and sewerage charges, the gap is about 0.06 percentage points, with units at 0.24% compared with houses at 0.18%.
Outside the ACT scenario, the main reason for the gap is fixed charges. A rates notice can include waste collection charges, emergency services levies and minimum contributions that do not always change based on what a property is worth. These charges can apply to both lower-value units and higher-value houses. Because fixed charges make up a bigger share of a lower-value property, this proxy calculation shows a higher effective rate for units than houses. Actual bills can differ where councils set different fixed charges, minimum rates or rating categories for units and houses.
| Proxy effective council-rate burden for units by capital city, 2025–26 | |||
|---|---|---|---|
| State (capital city) | Median unit price | Benchmark rate applied† | Rate as % of value |
| NSW (Sydney) | $848,000 | $3,188 | 0.38% |
| VIC (Melbourne) | $615,000 | $1,910 | 0.31% |
| QLD (Brisbane) | $834,500 | $2,032 | 0.24% |
| SA (Adelaide) | $740,000 | $1,775 | 0.24% |
| WA (Perth) | $735,000 | $2,027 | 0.28% |
| TAS (Hobart) | $610,000 | $1,800 | 0.30% |
| NT (Darwin) | $430,000 | $1,900 | 0.44% |
| ACT (Canberra)* | $625,000 | $4,241 | 0.68% |
Source · Australian Bureau of Statistics, Total Value of Dwellings, March Quarter 2026, Table 2: Median Price and Number of Transfers; Brisbane City Council, City of South Perth, Merri-bek City Council, ACT Treasury and other council rate schedules, 2025–26.
The ACT scenario's 0.68% is higher than every state average, but it describes one ACT Treasury household bill of $4,241 measured against a median unit price of $625,000, not a separately calculated unit rate. Once that ACT scenario is set aside, the house-versus-unit gap across the rest of the country ranges from about 0.06 percentage points in Queensland, South Australia and Tasmania to about 0.17 to 0.19 percentage points in NSW and the Northern Territory.
Do unit owners pay the same council rates as house owners in the same area?
The variable part of the rate is generally the same, as the council's rate multiplier applies to the property's official value. However, this article's proxy calculation shows unit owners paying a somewhat higher rate as a percentage of property value, because fixed charges on a rates notice can apply regardless of property value. A waste collection charge of $400 represents a smaller share of a $1.5 million house than it does of a $500,000 unit. Outside the ACT scenario, this fixed-charge effect produces a gap of roughly 0.06 to 0.19 percentage points, depending on the state. The gap looks widest in the ACT scenario, at 0.28 percentage points, but that reflects one household's bill measured against two different property values rather than a separately observed unit rate.
What are the fixed charges on a council rates notice?
A rates notice has two parts: a variable charge that scales with the property's official value, and a set of fixed, minimum or service-based charges that may apply depending on property type, council rules and services received. Fixed charges typically include a waste collection fee covering kerbside rubbish, recycling and green waste services, and a state emergency services levy collected by the council on behalf of the state government. Some councils also apply a minimum rate that sets a floor on the total bill for eligible properties. The City of West Torrens applied a minimum charge of $1,206 for 2025–26 to properties below a set valuation threshold. This means an eligible property with a low official value still pays at least a base amount each year.
Section 05 · How council rates are calculated
How are council rates calculated in Australia?
All Australian councils follow a similar seven-step process to set rates each year. A property owner's bill has two parts: a variable charge based on the property's official value, and a set of flat or service-based fees. Most people focus on the variable charge, but the flat fees can make up a large share of the total notice.
Council sets its annual budget — Foundation step
Each council determines the total expenditure required to deliver community services and infrastructure for the upcoming financial year. This includes roads, waste collection, parks, libraries, and emergency management programmes.
Identify the funding shortfall
The council subtracts expected income from government grants, user fees, and other non-rate sources. The remaining gap is the amount that must be raised through property rates.
Independent property valuations are completed — State government role
An independent government valuer assesses properties in the council's area. The value used for rates is an official assessment, not the property's sale price. This official value can differ from what the property would sell for on the open market, and the valuation basis itself differs by state: for example, capital value, unimproved value, gross rental value or assessed annual value.
Calculate the rate in the dollar
The council divides the total amount it needs by the combined official value of rateable properties in its area. Under a capital-value-based system, the resulting rate multiplier is usually between 0.001 and 0.005, meaning that for every $1,000 of a property's official value, the owner pays between $1 and $5 in the variable part of their rates. Councils using a different valuation basis, such as Gross Rental Value in Western Australia, apply a differently scaled rate in the dollar to reach a comparable bill.
Apply the rate to individual properties
Each property's official value is multiplied by the rate multiplier. A higher-value property usually produces a higher rate charge. Some councils charge different rates for different property categories, such as homes, businesses or farmland.
Add fixed supplementary charges — Flat components
Fixed fees are added to the variable rate charge. These can include rubbish collection charges, state emergency services levies and minimum rates. They can apply regardless of property value, depending on the council and charge type. Many councils also set a minimum rate so that each rateable property contributes at least a base amount.
Issue the rates notice — Payment due
The final rates notice is sent to the property owner and must be paid either as an annual lump sum or in quarterly instalments. Paying late can attract penalty interest.
Can a property owner dispute their council rates assessment?
Yes, but the process differs by state. Council rates are based on an official valuation carried out by an independent government valuer, not the council itself. If a property owner believes their valuation is incorrect, they can usually lodge an objection with the relevant state valuation authority within a set period specified by the relevant state valuation authority, which varies by jurisdiction. Disputing the valuation is separate from querying the rate itself. If a property owner believes the council has applied the wrong multiplier or charged an incorrect fee, that query goes directly to the council. Most councils have a formal review process and include contact details for rates enquiries on the notice.
What happens if council rates are not paid on time?
Unpaid rates attract penalty interest from the due date. In Victoria, the rate is 10% per year. In Brisbane, it was 12.12% per year in 2025–26, rising to 12.19% for 2026–27, charged daily. Interest can add to the outstanding balance over time. If rates remain unpaid for an extended period, councils may have legal powers to recover the debt through a rates sale. Most councils attempt to contact the property owner and may offer a payment arrangement before that step. Hardship provisions and instalment plans are available in many jurisdictions.
Section 06 · 2026–27 outlook
What's changing for council rates in 2026–27?
| Confirmed council rate movements for 2026–27 | |||
|---|---|---|---|
| Jurisdiction | 2025–26 setting | 2026–27 setting | What changed |
| NSW | Base Cost Change 3.6%; core rate pegs 3.6%–5.1%; final pegs 3.7%–7.6% | Base Cost Change 3.0%; core rate pegs 2.5%–4.2%; final pegs 2.7%–5.7% | IPART's "core" pegs exclude each council's population factor; "final" pegs include it and are the more relevant figure for most ratepayers |
| VIC | Rate cap 3.0% | Rate cap 2.75% | Set by the Essential Services Commission; applies to each council's total rate revenue, not individual bills |
| QLD (Brisbane) | General rate $1,519 | +3.97% | Brisbane City Council's confirmed 2026–27 average general rate increase for an owner-occupied house |
| ACT | $100 Health Levy (residential/rural); PFESL $426 | Health Levy scrapped; PFESL $458 | General rates component up an average 8% for residential and commercial; average total residential bill including levies still rises about 5% once the Health Levy removal is factored in |
Source · IPART, Information Paper: Rate pegs for NSW councils for 2026–27 (30 September 2025); Essential Services Commission Victoria; Brisbane City Council, Annual Plan and Budget 2026–27; ACT Treasury, 2026–27 Budget, handed down 10 June 2026.
In the ACT, the average figures hide a wide spread. Rate rises for houses in the 2026–27 Budget range from 4% in Belconnen to 13% in the inner-south suburbs of Forrest and Griffith; for units, the range runs from 2% in Wright and Hackett to 19% in Ainslie. The Police, Fire and Emergency Services Levy rises by $32 to $458, and the Safer Families Levy rises by $10 to $70, while the $100 Health Levy charged to residential and rural properties in 2025–26 (reduced from an originally announced $250 after negotiations with the ACT Greens) ends from 1 July 2026. Because the ACT calculates rates from suburb median values rather than a single territory-wide figure, the change for an individual property depends heavily on which suburb it is in.
In NSW, IPART says the 2026–27 core rate pegs range from 2.5% to 4.2% before each council's population factor, and the final rate pegs range from 2.7% to 5.7%. In Victoria, the Minister for Local Government has set the 2026–27 average rate cap at 2.75%. Brisbane City Council's 2026–27 Budget states that the average general rate increase for residential owner-occupied houses is 3.97%.
Will my council rates go up in 2026–27?
Most likely, but by how much depends on the state and council. NSW councils are capped by an IPART-set rate peg that varies by council, ranging from 2.7% to 5.7% for 2026–27 once each council's population factor is applied. Victorian councils are capped at 2.75% in total rate revenue. Queensland, South Australia, Western Australia, Tasmania and the Northern Territory do not have a single state-wide cap; each council sets its own increase as part of its annual budget process, usually finalised in June and taking effect from 1 July. The ACT sets rates centrally, but the increase varies by suburb. Property owners can check their council's rates notice or budget documents for the figure that applies to their property.
Estimate a council rate
Select a state and enter a property value to estimate the annual council rate. This is a house-based proxy: it applies each capital city's indicative house rate as a percentage of property value, and does not separately model units or council-specific fixed charges; see the note below for ACT.
Council rate estimator
Estimate the annual council rates on a property from its value, using your state’s capital-city benchmark.
References
- ABS, Taxation Revenue, Australia, 2024–25, Table 1 · Australian Bureau of Statistics
- ABS Total Value of Dwellings, March quarter 2026 · Australian Bureau of Statistics
- Essential Services Commission Victoria, Annual council rate caps, 2025-26 and 2026-27 · esc.vic.gov.au
- Merri-bek City Council, Understand your rates, 2025-26 · merri-bek.vic.gov.au
- City of West Torrens, Rate calculations, 2025-26 · westtorrens.sa.gov.au
- City of South Perth, About my rates, 2025-26 · southperth.wa.gov.au
- Brisbane City Council, How rates are calculated, 2025-26 · brisbane.qld.gov.au
- Brisbane City Council, Resolution of Rates and Charges, 2025-26 · brisbane.qld.gov.au
- Townsville City Council, Rates Benchmarking Report, 2025-26 · townsville.qld.gov.au
- ACT Treasury, Cost of Living Statement, 2025-26 · treasury.act.gov.au
- ACT Treasury, Cost of Living Statement, 2026-27 · treasury.act.gov.au
- Ballina Shire Council, Calculate your rates, 2025-26 · ballina.nsw.gov.au
- Local Councils SA, Council rates · localcouncils.sa.gov.au
- IPART, Rate pegs for NSW councils, 2025-26 · ipart.nsw.gov.au
- IPART, Rate pegs for NSW councils, 2026-27 · ipart.nsw.gov.au
- Brisbane City Council, Annual Budget, 2026-27 · brisbane.qld.gov.au
- Brisbane City Council, Resolution of Rates and Charges, 2026-27 · brisbane.qld.gov.au
- City of Adelaide, Business Plan and Budget, 2025-26 · cityofadelaide.com.au
- InDaily SA, Council rates explained, 2025 · indailysa.com.au
- Australian Bureau of Statistics, Insights into Government Finance Statistics, Annual, 2024-25 · Australian Bureau of Statistics