How many Australians have a mortgage?
Australia had about 9.3 million occupied private dwellings at the 2021 Census. Of these, around 3.24 million (35.0%) were owned with a mortgage, 2.87 million (31.0%) were owned outright, and 2.84 million (30.6%) were rented. Households that owned outright and those with a mortgage were roughly equal in number around 2003. Since then, more households have had a mortgage than owned their home outright, largely because rising property prices have extended repayment timelines and pushed more buyers into longer-term borrowing.
In 2019–20, the median outstanding mortgage balance nationally was $275,000. Weekly housing costs for mortgaged households averaged $493, equivalent to about 16% of gross household income. More recent lending data have since surpassed that baseline. By the March quarter of 2026, the average new owner-occupier loan stood at around $735,000, reflecting both higher property prices and larger borrowing amounts.
Based on the 2021 Census, 35.0% of occupied private dwellings were owned with a mortgage, covering around 3.24 million households. Among owner-occupier households, roughly 53% still carried a mortgage. In 2019–20, the national median outstanding mortgage balance was $275,000, while weekly housing costs averaged $493, equal to about 16% of gross household income. By the March quarter of 2026, the average new owner-occupier loan stood at around $735,000.
In 1997–98, outright owners made up 39.5% of households and mortgage holders 30.9%. By 2019–20, outright ownership had fallen to 29.5% while mortgage ownership had risen to 36.8%. The crossover occurred around 2003, as rising property prices contributed to longer repayment timelines. Private renting also increased over the same period, from 20% to 26.2%.
What is the average home loan size in Australia?
New loan sizes show how borrowing differs across Australia, with the largest loans concentrated in higher-priced housing markets. The national average for new owner-occupier loans was about $735,000 in the March 2026 quarter on the ABS original quarterly series ($724,415 seasonally adjusted). Loan sizes vary by state: NSW borrowers averaged $860,000, compared with $521,000 in Tasmania.
NSW and Victoria were the only states or territories where average loan sizes fell in the quarter; every other state and territory rose, with the ABS reporting the largest increases in Western Australia, Queensland and South Australia. In most states, investor loan sizes sit below owner-occupier loan sizes, but the ACT is an exception, where investor loans ($683,000) run ahead of owner-occupier loans ($665,000). NSW comes closest, with investor loans at $857,000 against an $860,000 owner-occupier average — the narrowest gap that still keeps owner-occupier loans on top.
The table below shows current new loan sizes alongside older mortgage cost data from 2019–20. The two measures should not be read as the same thing: loan sizes refer to new loans written in March quarter 2026, while mortgage costs and outstanding balances come from the 2019–20 ABS survey.

Loan sizes and mortgage costs by state and territory
| State / territory | Avg OO loan | Avg investor loan | Median outstanding debt | Avg weekly cost | Cost % of income |
|---|---|---|---|---|---|
| New South Wales | $860,000 | $857,000 | $302,000 | $574 | 17% |
| Victoria | $675,000 | $606,000 | $285,000 | $501 | 16% |
| Queensland | $741,000 | $711,000 | $261,000 | $447 | 15% |
| South Australia | $664,000 | $639,000 | $216,000 | $390 | 14% |
| Western Australia | $703,000 | $654,000 | $280,000 | $443 | 14% |
| Tasmania | $521,000 | $518,000 | $177,000 | $346 | 15% |
| Northern Territory | $536,000 | $427,000 | $321,000 | $534 | 16% |
| Australian Capital Territory | $665,000 | $683,000 | $347,000 | $546 | 16% |
| Australia (national) | $735,000 | $709,000 | $275,000 | $493 | 16% |
Loan sizes: average new loans, March Quarter 2026 (original terms). Outstanding debt and cost data: ABS Housing Occupancy and Costs, 2019–20. Source: ABS Lending Indicators; ABS Housing Occupancy and Costs.
For owner-occupier loans, the national average was $735,000 in the March 2026 quarter (seasonally adjusted: $724,415), with NSW the highest at $860,000 and Tasmania the lowest at $521,000. Investor loans averaged $709,000 nationally. These figures refer to new loans written during the quarter. The median balance on outstanding mortgages was $275,000 nationally in 2019–20, the most recent comprehensive survey available.
Nationally, investor loans averaged $709,000 in the March 2026 quarter, compared with $735,000 for owner-occupier loans. NSW is now the exception: investor loans there averaged $857,000, just $3,000 below the $860,000 owner-occupier average – the closest investor and owner-occupier loan sizes have ever been in any state on record. Elsewhere the gap remains wide, from around $30,000 in Queensland to over $100,000 in the Northern Territory. Investors also typically pay slightly higher rates: the APRA/RBA F6 series shows investor outstanding rates running 0.2 to 0.3 percentage points above comparable owner-occupier rates.
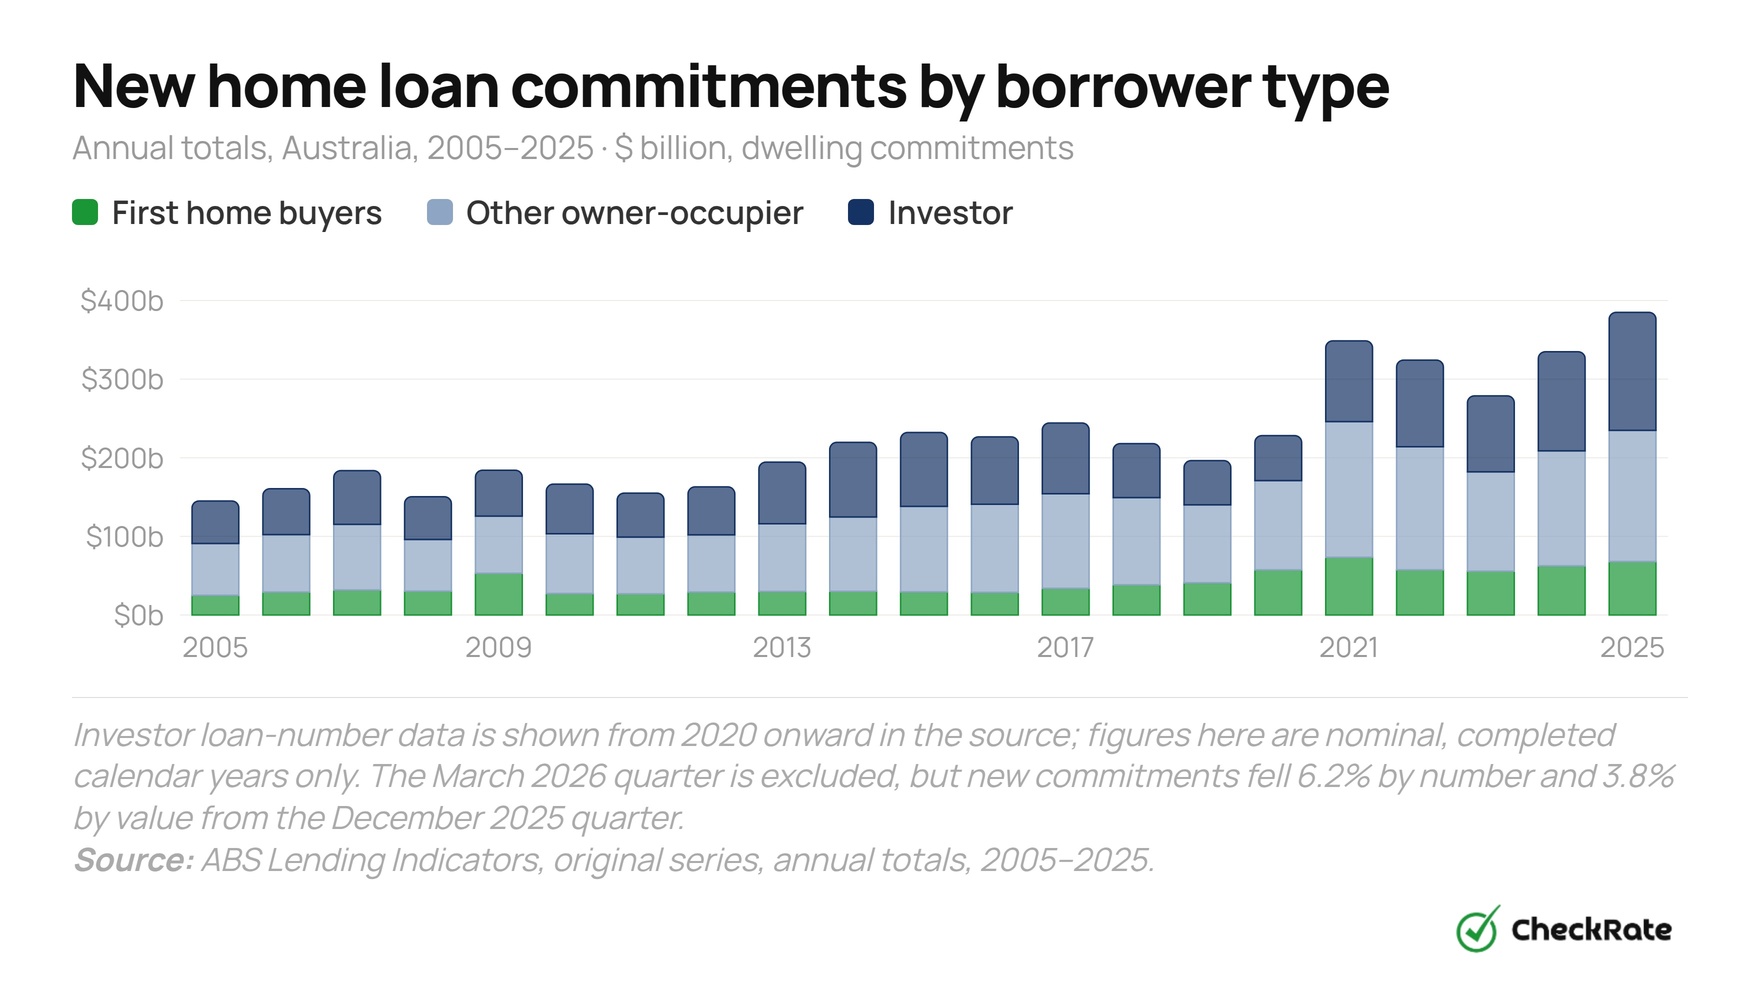
New home lending reached a record high in 2025
Total new home loan commitments reached $385 billion in 2025, above the previous peak of $349 billion recorded in 2021. Lending then fell during the RBA's 2022–2023 rate-rise cycle, dropping to $279 billion in 2023, before recovering through 2024 and 2025.
That recovery paused in the March quarter of 2026. New home loan commitments fell 6.2% by number to 139,794 and 3.8% by value to $103.0 billion. Commitments were still 8.6% higher by number and 18.5% higher by value than a year earlier, but December 2025 remained the most recent quarterly record.
Investor lending accounted for a large share of 2025's increase. In 2025, investors committed to $150 billion in new loans, almost triple the $57 billion recorded in 2020 and the highest full-year dollar value in the series. First-home buyers borrowed $68 billion in 2025, up in dollar terms but a smaller share of the total market than in 2020. In the March quarter of 2026, first-home buyer loans fell 4.3% by number and 6.7% by value to $17.9 billion, while the average first-home buyer loan size rose 1.1% to $614,048.
2005
Investor loan-number data is shown from 2020 onward in the web version because comparable investor-number data is not available for the full historical period. All figures are nominal. The chart shows completed calendar years only. The March 2026 quarter is not shown in the annual chart, but new commitments fell 6.2% by number and 3.8% by value from the December 2025 quarter.
Source: ABS Lending Indicators, original series, annual totals, 2005–2025.
Annual new lending, 2021–2025
| Year | Total ($b) | Owner-occupier ($b) | First home buyers ($b) | Investor ($b) | Change vs prior year |
|---|---|---|---|---|---|
| 2025 | 385.0 | 234.9 | 67.9 | 150.1 | ↑ +14.9% |
| 2024 | 334.9 | 208.7 | 62.4 | 126.2 | ↑ +20.2% |
| 2023 | 278.7 | 181.9 | 55.7 | 96.8 | ↓ −14.1% |
| 2022 | 324.1 | 214.0 | 57.3 | 110.2 | ↓ −7.1% |
| 2021 | 348.8 | 245.9 | 73.3 | 102.8 | ↑ +52.9% |
Annual totals are sums of original quarterly figures, not seasonally adjusted. Dwelling commitments only; refinancing excluded. Source: ABS Lending Indicators.
In 2025, there were 556,092 new loan commitments for owner-occupier and investor dwellings combined, excluding refinancing. Of these, 119,464 were first-home buyer loans. By value, total commitments reached $385 billion. The December 2025 quarter alone recorded 149,434 commitments worth $108.3 billion, a quarterly record – but the following quarter broke that streak: commitments fell to 139,794 worth $103.0 billion in the March 2026 quarter as RBA rate hikes in February and March took effect.
In 2025, 119,464 first-home buyers took out a new loan, excluding refinancing, borrowing a combined $67.9 billion. The pandemic year of 2021 was the modern peak, when 162,808 first-home buyers borrowed $73.3 billion, partly driven by HomeBuilder and the First Home Loan Deposit Scheme. First-home buyers made up about 25% of total new lending by value in 2020, but their share had settled at around 18% by 2025.
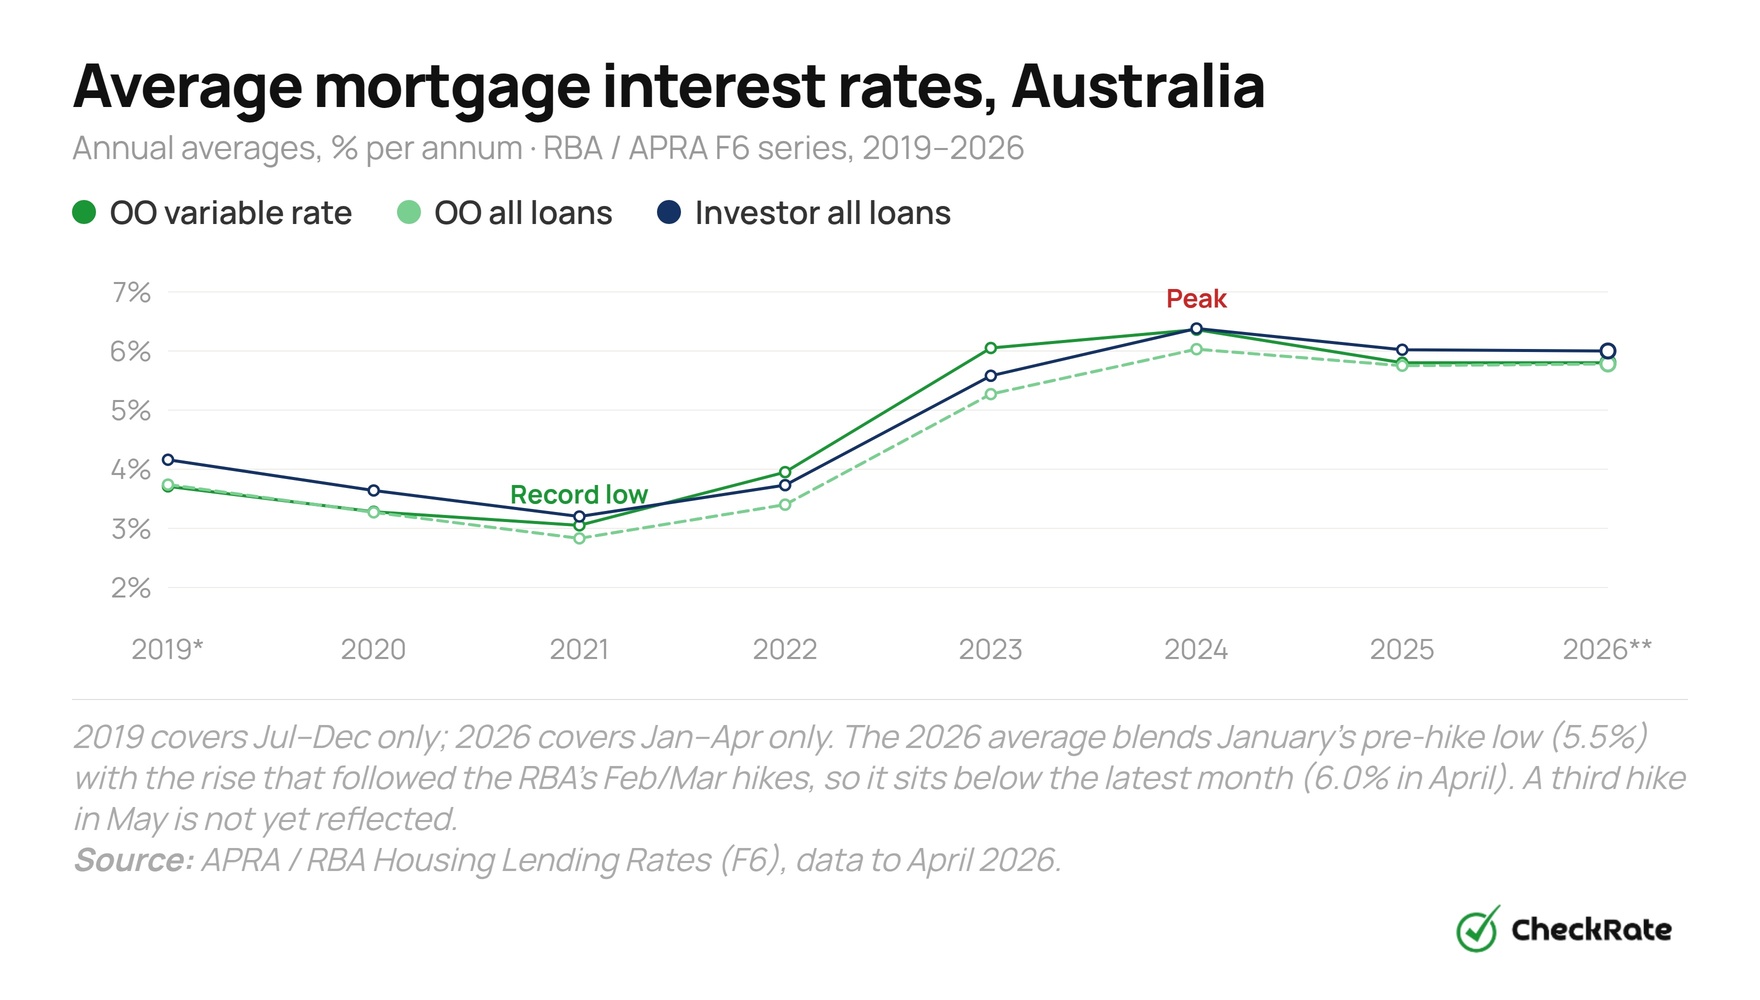
Average mortgage interest rates from 2019 to 2026
The average rate on outstanding owner-occupier loans fell to around 2.63% by mid-2021, before the RBA's tightening cycle pushed it above 6% by mid-2024. Three RBA cash rate cuts in 2025, in February, May and August, brought the cash rate down from 4.35% to 3.60%. The average outstanding owner-occupier mortgage rate then fell to 5.5% in January 2026.
That fall has since partly reversed. The RBA increased the cash rate in February and March 2026, and the average outstanding owner-occupier mortgage rate rose to 5.7% in February, 5.9% in March and 6.0% in April. Rates on newly written owner-occupier loans also reached 6.0% in April. A third 2026 cash rate increase followed in May, taking the cash rate back to 4.35%, but that decision came after the April F6 mortgage-rate data and is not reflected in the April figures.
Investor loans have consistently carried higher average rates than comparable owner-occupier loans in the RBA/APRA F6 series. In April 2026, the average outstanding investor mortgage rate was 6.2%, compared with 6.0% for outstanding owner-occupier loans.
2019*
2019 covers July–December only. 2026 covers January–April only. The 2026 average blends the pre-hike low from January (5.5%) with the rise that followed the RBA's February and March cash rate hikes, so it sits below the latest single month (6.0% in April). A third hike, in May, came after this data and is not yet reflected. Rates are weighted averages of APRA-reporting institutions covering more than 95% of housing credit.
Source: APRA / RBA Housing Lending Rates (F6), data to April 2026, released 5 June 2026.
Rate snapshot: annual averages, % per annum
| Year | OO outstanding (all) | OO outstanding (variable) | OO new loans | Investor outstanding | Investor new loans |
|---|---|---|---|---|---|
| 2019* | 3.74% | 3.71% | 3.36% | 4.16% | 3.76% |
| 2020 | 3.27% | 3.28% | 2.80% | 3.64% | 3.15% |
| 2021 | 2.83% | 3.05% | 2.43% | 3.20% | 2.78% |
| 2022 | 3.40% | 3.95% | 3.52% | 3.73% | 3.85% |
| 2023 | 5.27% | 6.05% | 5.75% | 5.58% | 6.04% |
| 2024 | 6.03% | 6.36% | 6.26% | 6.38% | 6.50% |
| 2025 | 5.75% | 5.80% | 5.76% | 6.02% | 5.95% |
| 2026** (Jan–Apr avg) | 5.78% | 5.80% | 5.78% | 6.00% | 5.98% |
| Apr 2026† (latest month) | 6.0% | 6.0% | 6.0% | 6.2% | 6.2% |
* 2019 covers July–December only. ** 2026 year-to-date average covers January–April (monthly readings: Jan 5.5%, Feb 5.7%, Mar 5.9%, Apr 6.0% for OO outstanding all loans); it sits below the latest month because it blends January's pre-hike rate with the rise that followed the RBA's February and March hikes (a third hike, in May, is not yet reflected). † April is the latest available F6 month, released 5 June 2026, about five weeks after month-end. Figures may be revised in later RBA releases due to changes in its reporting systems. OO = owner-occupier. Source: APRA / RBA F6.
As of April 2026, the average rate on outstanding owner-occupier mortgages was 6.0% per annum – up from a low of 5.5% in January after the RBA raised the cash rate in February and March 2026, and still down from a peak of around 6.11% in mid-2024. A third RBA hike followed in May, which will show up in F6 data from May onward. The average rate on new loans was also 6.0%. Variable-rate loans averaged 6.0%, while outstanding investor loans averaged 6.2%. These figures are weighted averages from APRA-supervised lenders, which cover more than 95% of Australia's housing credit market.
The average rate on outstanding owner-occupier mortgages rose from around 2.63% in mid-2021 to around 6.11% by mid-2024, an increase of about 3.48 percentage points. On a $600,000 loan over 30 years, that rate difference would add roughly $1,300 per month in repayments. For the average new owner-occupier loan of about $735,000, the difference would be closer to $1,500 per month. These are illustrative repayment estimates, not observed household repayment figures.
Which states had the highest mortgage costs in 2019-20?
Mortgage costs vary across Australia, both in dollar terms and as a share of household income. NSW mortgage holders had the highest average weekly housing costs at $574 per week, equal to 17% of gross household income. The ACT and NT followed at $546 and $534 per week. Tasmania recorded the lowest average at $346 per week, less than two-thirds of the NSW figure.
In Australia, mortgage stress is commonly measured as spending 30% or more of gross household income on housing costs. No state average exceeded that level in the 2019–20 data, but averages can hide large differences within each state. In higher-cost markets such as NSW and the ACT, some households may sit well above the threshold even though the state average does not.
Figures cover owner households with a mortgage at time of survey. Weekly housing costs include mortgage repayments, council and water rates, and body corporate fees where applicable.
Source: ABS Housing Occupancy and Costs, 2019–20.
NSW had the highest average weekly housing cost in 2019–20 at $574 per week, as well as the highest income share at 17%. The ACT had the highest median outstanding mortgage debt at $347,000, while the NT had the highest share of households with a mortgage at 43%. Tasmania was lowest on all three measures, with weekly costs of $346 and median debt of $177,000.
The mortgage stress benchmark commonly used is 30% of gross household income spent on housing costs. In the 2019–20 data, state averages for mortgaged households ranged from 14% in SA and WA to 17% in NSW, all below the 30% threshold. However, averages can hide differences within each state, and lower-income households with median or above-median mortgage costs are more likely to exceed the benchmark.
How long does it take to save a house deposit?
Saving a 20% deposit can take decades in every capital city under a single-income estimate. Based on one full-time wage, the March quarter 2026 household saving ratio of 6.2%, and a 20% deposit on the median established-house transfer price, the estimated timeline ranges from around 23 years in Darwin to almost 43 years in Sydney.
The saving rate also affects the deposit timeline directly. The household saving ratio moved between roughly 6% and 7% over the year to early 2026, sitting at 6.2% in the March quarter, down from 7.0% in the December quarter. A lower saving rate lengthens every timeline below, because less income is set aside each year. Established house prices have also continued to rise across most capitals into early 2026, outpacing wage growth and further extending the deposit task.
Years to save a 20% deposit by capital city, March 2026
| Capital city | Median established house | Years to save (20% deposit) | Price-to-income |
|---|---|---|---|
| Sydney (NSW) | $1.49M | 42.9 | ~13× |
| Brisbane (QLD) | $1.15M | 34.0 | ~11× |
| Adelaide (SA) | $980,000 | 30.3 | ~9× |
| Canberra (ACT) | $1.07M | 29.1 | ~9× |
| Perth (WA) | $1.00M | 26.9 | ~8× |
| Melbourne (VIC) | $850,000 | 25.4 | ~8× |
| Hobart (TAS) | $740,000 | 24.3 | ~7× |
| Darwin (NT) | $750,000 | 22.8 | ~7× |
Earnings reflect the most recent Average Weekly Earnings release (November 2025), which the ABS publishes twice yearly; no newer release is available. Source: ABS Total Value of Dwellings (6432.0, March 2026); ABS Average Weekly Earnings (6302.0, November 2025); ABS National Accounts saving ratio (March 2026).
On a single full-time wage saving at the March quarter 2026 household saving ratio of 6.2%, a 20% deposit on the median established house takes around 43 years in Sydney, the longest of any capital. Brisbane is about 34 years, Adelaide 30, Canberra 29, Perth 27, Melbourne 25 and Hobart 24. Darwin is the most accessible capital at roughly 23 years. Dual-income households and schemes such as the First Home Guarantee, which allows a 5% deposit, and the First Home Super Saver Scheme can reduce these timeframes for eligible buyers.
Yes. Established-house prices have risen faster than wages across most capitals, lengthening the deposit task in every city. The saving rate matters too: it eased from 7.0% in the December quarter 2025 to 6.2% in the March quarter 2026, and a lower saving rate stretches every timeline because less income is set aside each year.
References
- ABS Census of Population and Housing 2021: national housing tenure shares (owned outright, owned with a mortgage, rented) and occupied private dwelling counts
- ABS Housing Occupancy and Costs, 2019–20: median outstanding mortgage balance, average weekly housing costs and income share by state, plus historical tenure trends back to 1997–98
- ABS Lending Indicators, March Quarter 2026: new loan commitments by borrower type (number and value), average new loan sizes by state and territory, quarterly and annual series
- RBA / APRA Housing Lending Rates (F6): monthly average rates on outstanding and new housing loans by loan type, repayment type and institution; data to April 2026, publication date 5 June 2026
- ABS Total Value of Dwellings (6432.0), March quarter 2026: median established-house transfer prices by capital city, used in deposit-saving calculations
- ABS Average Weekly Earnings, Australia (November 2025): full-time adult average weekly earnings by state and territory, used as the single-income basis in deposit-saving estimates
- ABS National Accounts: National Income, Expenditure and Product (March quarter 2026): household saving ratio, used in deposit-saving calculations
Methodology: Average loan size data uses ABS Lending Indicators' original quarterly series. Annual lending totals are sums of original quarterly figures. Deposit-saving timelines: 20% deposit = capital-city median established-house price × 0.20; annual saving = state average full-time income × the March 2026 household saving ratio (6.2%); years to save = 20% deposit ÷ annual saving. No starting savings or investment return assumed. All figures nominal.
Data Snapshots