


Updated
Owning a home in Australia costs more than the mortgage. On top of the modelled repayment on the average new owner-occupier loan, at $4,369 per month in the March quarter of 2026, homeowners pay council rates, insurance premiums, water and wastewater bills, and ongoing maintenance costs. For houses, these non-mortgage costs add an estimated $14,000 to about $20,800 per year across the eight states and territories modelled in this article. For units, the range is lower because the model substitutes contents insurance and a strata levy for full building insurance and a house maintenance allowance. These figures show that recurring ownership costs can be materially higher than the mortgage alone.
The highest recurring cost is usually the mortgage, but other ownership costs can add materially to the annual bill. Insurance, council rates, water and wastewater charges, house maintenance and strata levies vary by location, property type and building condition, so this article separates each cost rather than presenting a single national ownership-cost figure.
- $4,369
- Average monthly repayment on a new owner-occupier loan, Mar quarter 2026
- +62%
- Real increase in average monthly repayment since 2019, in Q1 2026 dollars
- +10%
- 2024–25 premium rise across rest of Australia, largest single-year increase
- $1,641
- Median annual residential water and wastewater bill, 2024–25
 Average council rates in Australia: what ratepayers pay by stateAustralian councils and the ACT government collected $25.1 billion in municipal rates in 2024–25, up 49% over the previous decade. This figure covers all rateable land, including residential, commerci…
 Stamp duty by state: how much do home buyers pay in Australia?For most home buyers, stamp duty is the single biggest upfront cost after the deposit, adding between $28,949 and $54,151 at average state dwelling prices in March quarter 2026. It is a state governme…
 Which Australian capital city is most affordable for buying a house?A typical established house costs between 5.60 and 11.79 times yearly household income across Australia's capital cities, with the lowest ratio in Darwin and the highest in Sydney. The measure divides…
Section 01 · Property prices in Australia
What a house or unit costs in Australia
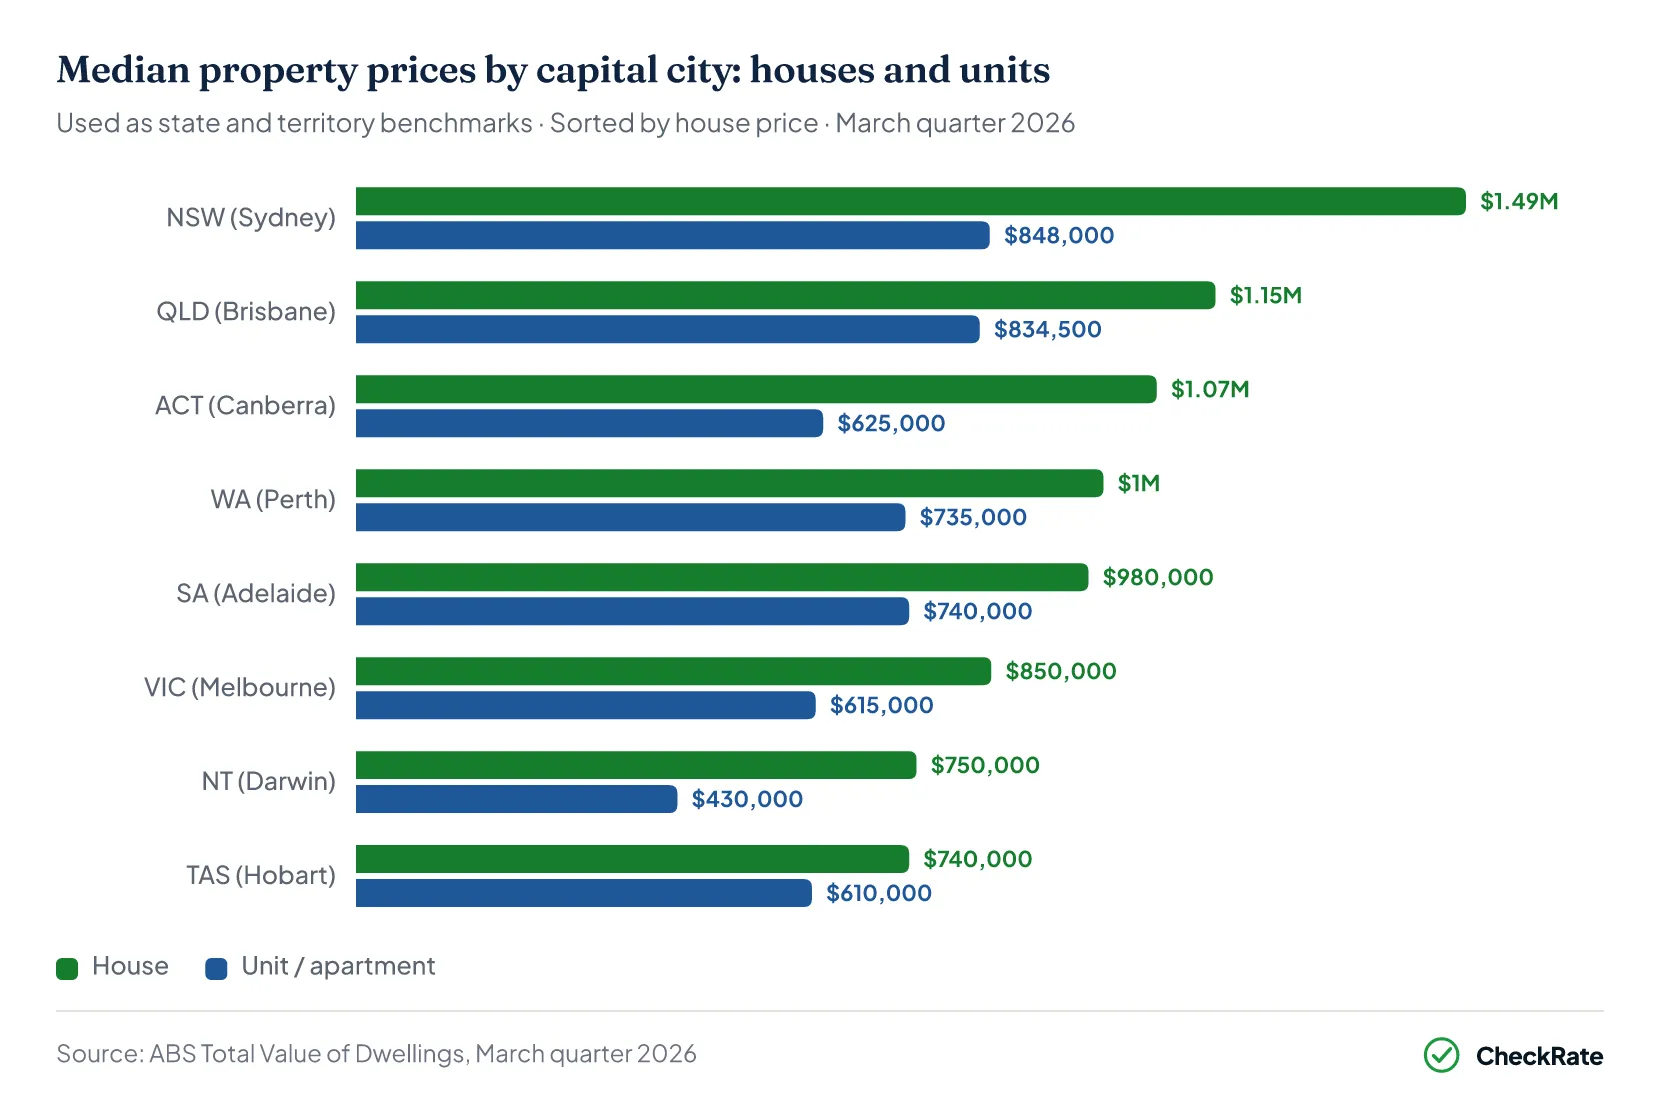
Before ongoing costs are added, the purchase-price benchmark needs to be clear. The ABS publishes median transfer prices by capital city and rest-of-state, rather than a single statewide figure. For this reason, the state and territory figures used throughout this article are capital-city medians, such as Sydney for NSW, Melbourne for Victoria and Brisbane for Queensland. On that basis, median house prices range from $740,000 in Hobart to $1,485,000 in Sydney, a difference of $745,000.
Units and apartments are cheaper than houses in every capital-city benchmark, although the size of the gap varies by market. New South Wales has both the largest dollar gap between houses and units, at $637,000, and the widest relative gap of any state benchmark. Sydney's median house price is around 1.75 times its median unit price.
The Northern Territory and the ACT are close behind, at roughly 1.74 and 1.71 times respectively. Tasmania has the narrowest relative gap, with Hobart's median unit price of $610,000 equal to around 82% of its median house price of $740,000. In Queensland, Brisbane's median unit price of $834,500 is around 73% of the median house price of $1,150,000.
A smaller purchase-price gap does not necessarily mean the same gap applies to ongoing ownership costs. Insurance, council rates, maintenance and strata levies can narrow or widen the difference between houses and units.
Which capital city has the highest median house price?
The ABS publishes median transfer prices by capital city and rest-of-state, rather than a single statewide or national median house price. Using capital-city medians as state and territory benchmarks, Sydney has the highest median house price at $1,485,000. Brisbane follows at $1,150,000, then Canberra at $1,071,300. At the lower end, Hobart records $740,000, and Darwin records $750,000.
Are units cheaper to own than houses?
Units have a lower purchase price than houses in every capital-city benchmark used in this article, but the ongoing cost comparison is more mixed. Unit owners usually pay strata levies, which can be substantial in buildings with lifts, pools, gyms or concierge services. House owners usually have higher maintenance costs and full building insurance.
In most states, the estimated monthly total for a median-priced unit is lower than for a house. However, the gap can be smaller than the purchase-price difference suggests because strata levies, insurance and council rates still add to the cost of unit ownership.
Section 02 · Monthly homeownership costs
What are the monthly costs of owning a home in Australia?
Most new buyers pay a mortgage, while all owners face recurring costs such as insurance, council rates and water bills. House owners also have separate maintenance costs, while unit owners usually pay strata levies instead. The six cost categories below apply from settlement and recur each year.
Mortgage
$4,369/month All owners · National avg, March quarter 2026 · Range: $3,097–$5,112 by state
The largest monthly cost in the ownership model. This figure is the modelled repayment on the average new owner-occupier loan, using a 5.92% annual rate over a 30-year principal-and-interest term.
Insurance
$193/month All owners · Rest-of-Australia avg, 2024–25 (ACCC) · Northern Australia significantly higher
Home and contents cover applies to houses. The rest-of-Australia average reached $2,310 per year in 2024–25. Northern Australia is much higher: the Northern Territory averaged $3,546 per year, while North Queensland averaged $3,117 per year. Unit owners typically need contents insurance rather than full building cover, because the owners corporation usually insures the building through strata. The exact cover depends on the strata policy.
Council rates
$208/month All owners · Derived national average 2024–25 (ABS total rates revenue ÷ dwelling count) · Range: $164–$387/month by state
Council rates fund local services such as waste collection, roads, parks and community infrastructure. They are usually billed quarterly. In this derived estimate, the ACT is highest because territory-wide rates fund a broader service base. NSW is lowest as a share of property value despite having the highest property-price benchmark.
Water
$137/month All owners · $1,641 per year, Bureau of Meteorology, 2024–25
Water costs include a fixed network access charge and variable usage charges. Some councils include water charges in rates notices. Larger households, larger gardens and properties with pools may have higher usage costs.
Maintenance
$617–$1,238 Houses only · Per month · Industry rule of thumb: 1% of property value annually · Estimate only, varies by property age and condition
A commonly used planning benchmark is 1% of a property's value per year for repairs and upkeep. The dollar amount varies by state and territory because house prices differ considerably across the country. This is an indicative long-term allowance, not a fixed annual bill.
Strata fees
$287–$565 Units only · Per month · Mid-range industry benchmark: 0.8% of unit value annually · Estimate only, varies by building and amenities
Strata levies cover building insurance, common-area maintenance, administration and capital works. Unit owners remain responsible for internal repairs, appliances and possible special levies.
Section 03 · Mortgage repayments
Average mortgage repayments have more than doubled since 2019
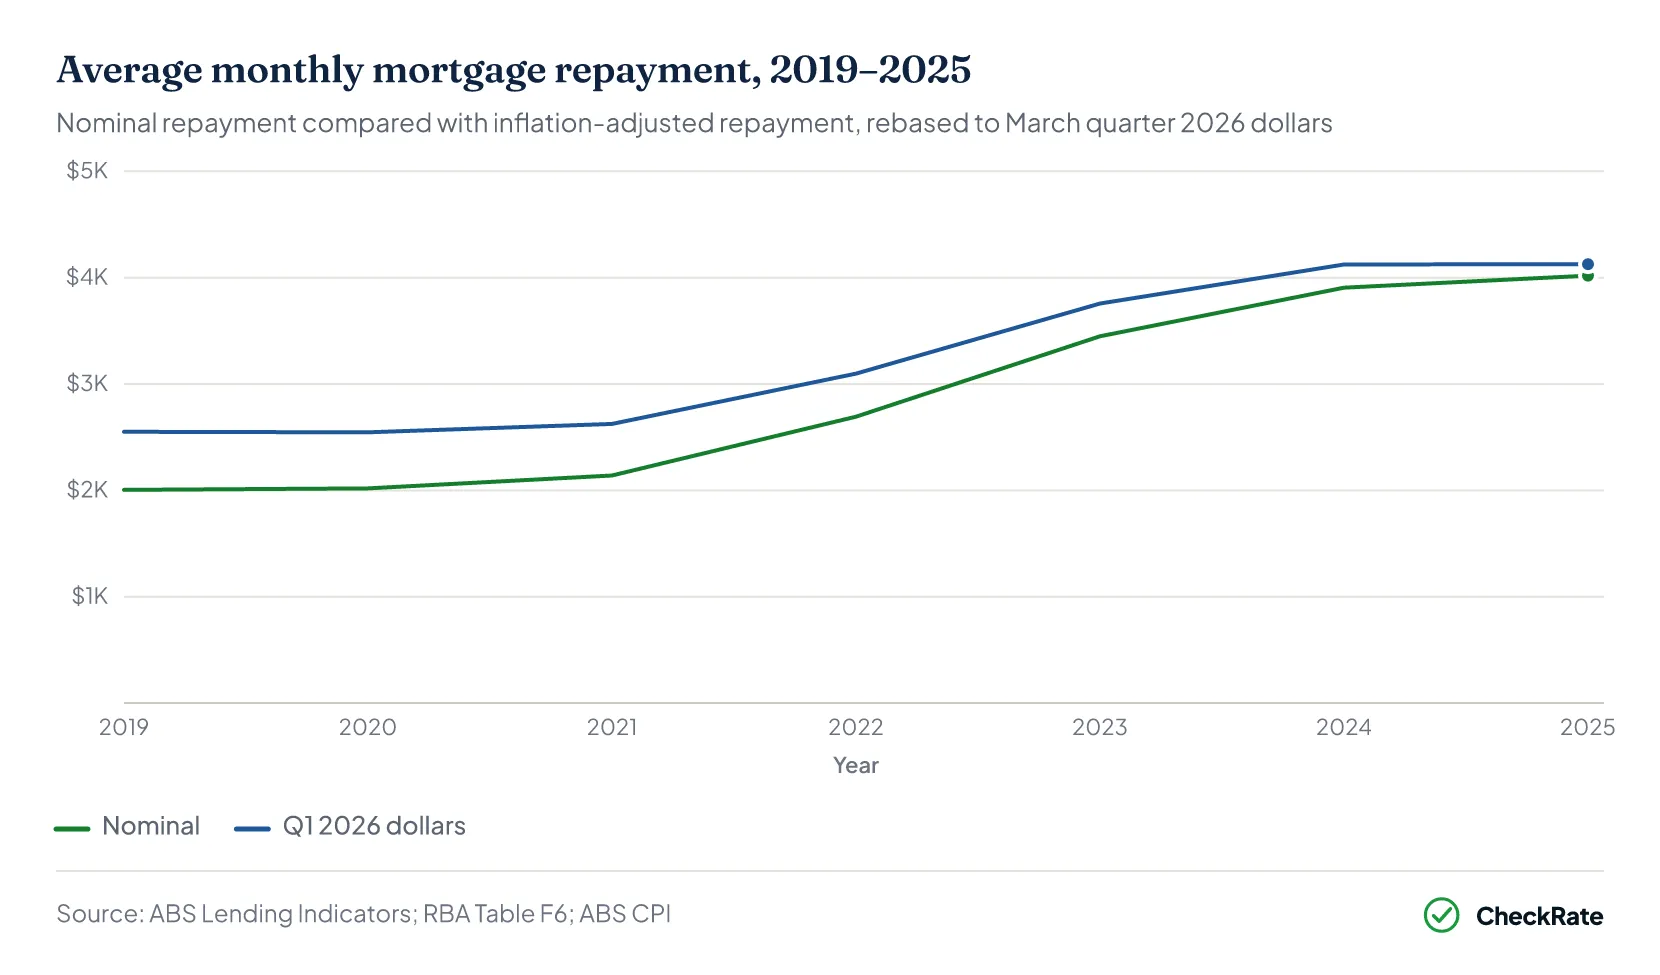
The mortgage is the largest single cost for most homeowners, and repayments on new owner-occupier loans have risen much faster than inflation since 2019. In 2019, the modelled repayment on the average new owner-occupier loan was about $2,005 per month. By 2025, that estimate had reached about $4,019, a nominal increase of just over 100%.
After inflation, the increase is smaller but still substantial. In March quarter 2026 dollars, the 2025 repayment of $4,019 is equivalent to $4,127. That means the real increase from 2019 was 61.8%. The sharpest single-year jump came between 2022 and 2023, when new-loan rates rose from 3.46% to 5.70% as the RBA lifted the cash rate.
Two factors drove the increase: interest rates rose from historic lows, and average loan sizes climbed. The national average new owner-occupier loan grew from $456,000 in 2019 to $693,000 in 2025, an increase of 52%, as property prices rose across most capital-city markets.
Western Australia recorded the strongest annual loan growth in the March quarter of 2026, with the average new loan rising 18.4%. Queensland followed at 15.6%, while Tasmania recorded the slowest growth, at 7.0%.
What is the average new-loan mortgage repayment in Australia?
Based on 2025 annual average data, the modelled repayment on the average new owner-occupier loan was $4,019 per month. In the March quarter of 2026, the national estimate was $4,369 per month. These figures reflect new borrowing at current prices and rates. They do not measure repayments for existing borrowers with older, smaller loans.
Why have mortgage repayments more than doubled since 2019?
Two factors combined. First, interest rates rose from historic lows. New-loan rates were around 2.4% in 2021 and above 6% by 2024. Second, average loan sizes increased as property prices rose. The average new owner-occupier loan grew from $456,000 in 2019 to $693,000 in 2025.
Together, a larger loan amount and a higher interest rate produced a much larger monthly repayment. After inflation, the modelled monthly repayment rose by 61.8% between 2019 and 2025.
Which state has the highest monthly mortgage repayment?
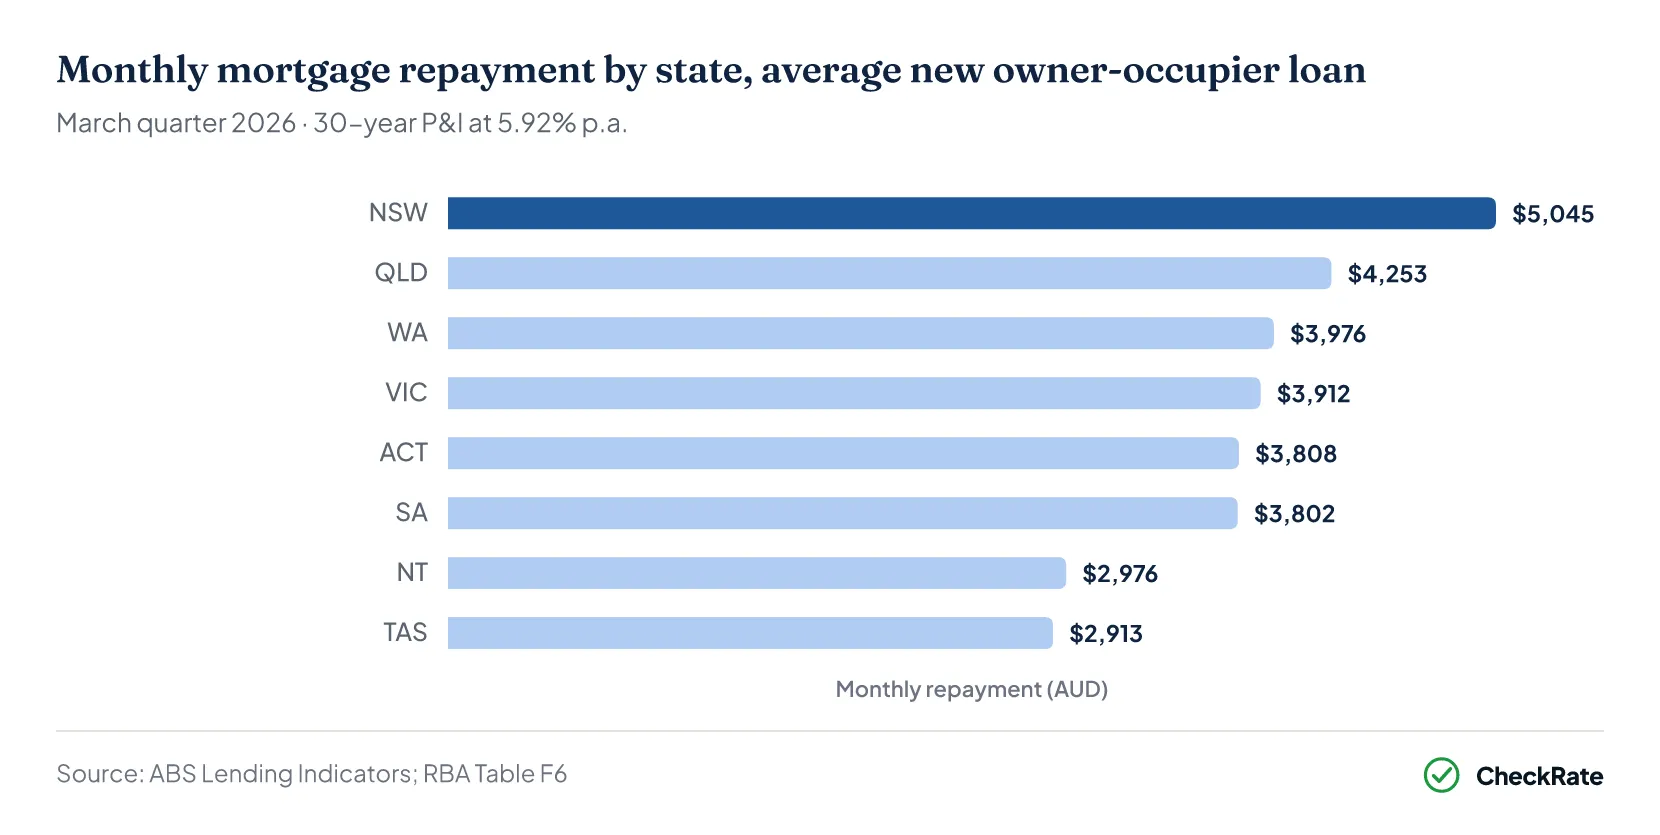
New South Wales has the highest estimated monthly repayment in the March quarter 2026 data. The average new owner-occupier loan in NSW was $860,000, which produces a modelled repayment of $5,112 per month under the article's 30-year principal-and-interest assumption. Western Australia recorded the fastest annual growth in average new loan size, at 18.4%.
Section 04 · Home insurance
Home insurance premiums are highest in northern Australia
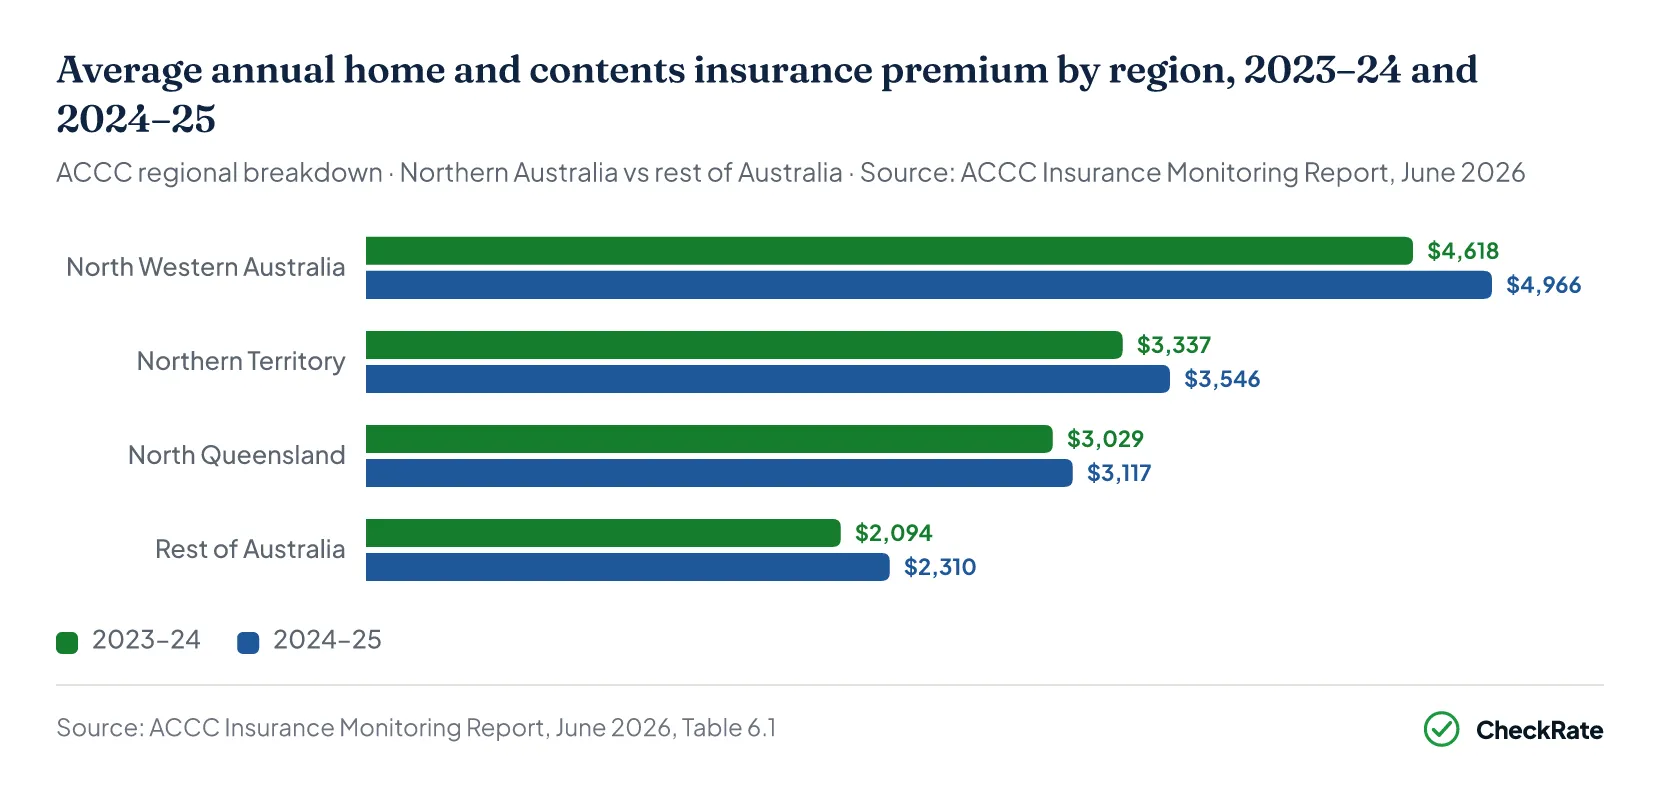
Home and contents insurance is one of the fastest-rising costs in the ownership model. The ACCC's final Insurance Monitoring Report, published in June 2026, found that the average combined premium in the Northern Territory reached $3,546 per year in 2024–25, up 6% from $3,337 the previous year. In North Queensland, the average was $3,117, up 4%. In North Western Australia, it reached $4,966, up 8%.
The rest of Australia recorded the largest percentage increase of the four ACCC regions, rising 10% to $2,310. The ACCC linked premium growth across all regions to factors including cyclone and flood risk, higher sums insured, rising rebuilding costs and insurer repricing.
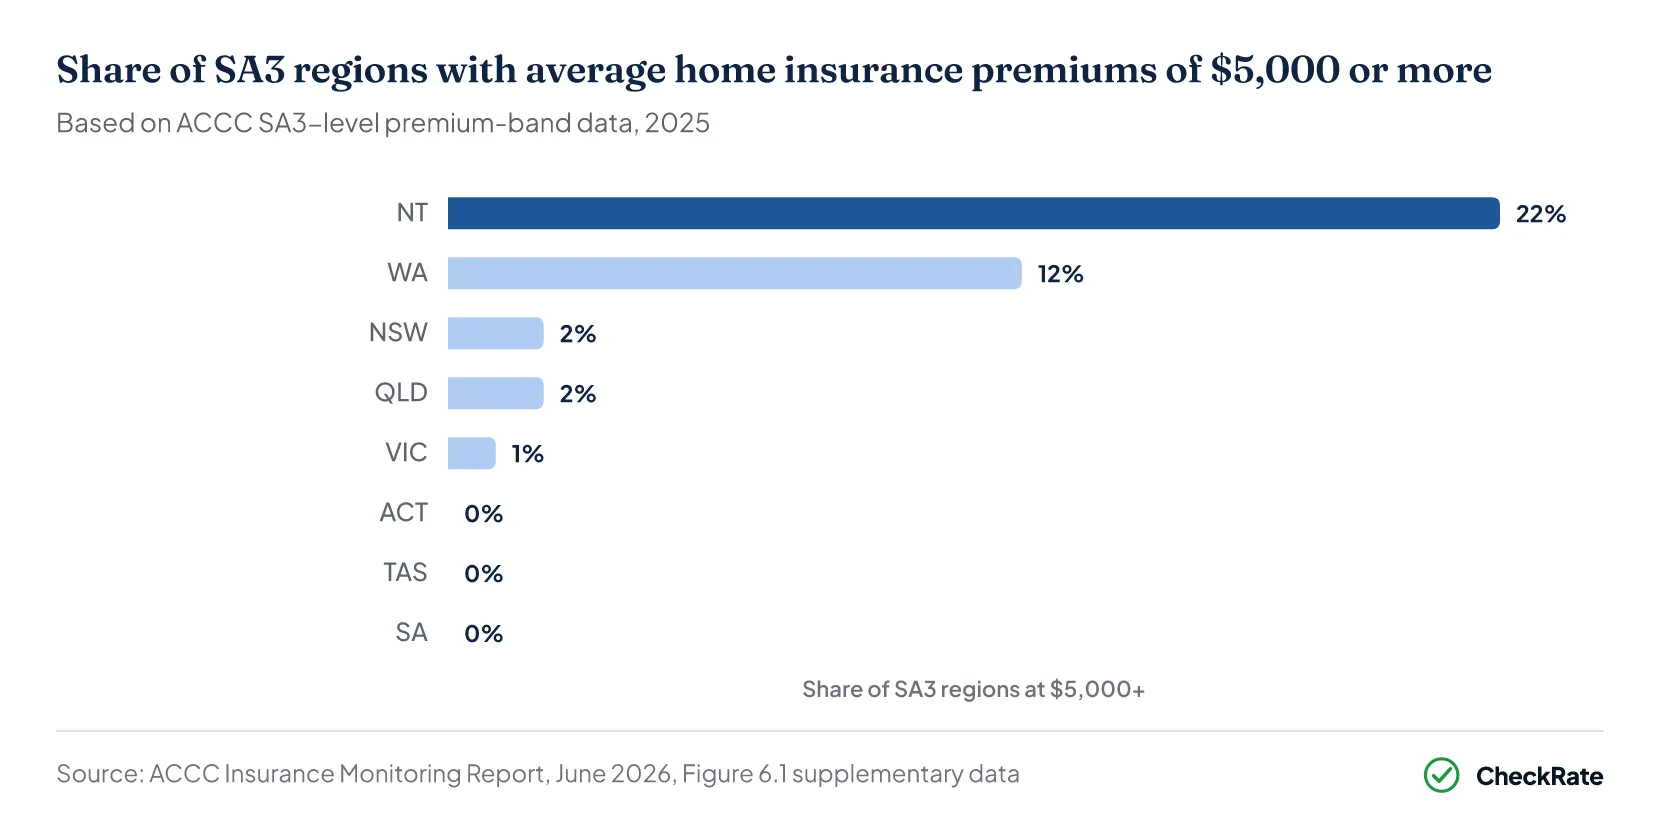
The location gap is large. Northern Australia carries the highest premiums in the country, reflecting greater exposure to cyclone and flood risk. The ACCC's SA3-level 2025 data shows that 22% of NT regions fall into the highest premium band, at $5,000 or more per year. These regions are Darwin City and East Arnhem. By comparison, only 1–2% of regions in NSW, Victoria and Queensland fall into this band, with none in the ACT, Tasmania or South Australia.
Tasmania has the largest share of regions in the lowest premium band, at 87%, followed by South Australia at 79%.
For unit owners, the insurance calculation is different. Building insurance is usually covered through the strata corporation, while individual owners are generally responsible for contents insurance. Strata insurance costs flow through to unit owners through levies.
The ACCC's final Insurance Monitoring Report found that strata insurance premiums were highest in North Western Australia, reaching $20,385 per year in 2024–25, up 13% from $18,009. The Northern Territory averaged $11,108, also up 13%, while North Queensland eased slightly to $9,154, down 1%. Outside northern Australia, the rest-of-Australia average was lower at $8,716 per year, up 8% from $8,040.
Why is home insurance more expensive in northern Australia?
Northern Australia has higher exposure to cyclone, tropical storm and flood risk, which increases expected claims costs for insurers. The ACCC's final Insurance Monitoring Report recorded an average combined premium of $3,546 per year in the NT and $3,117 per year in North Queensland in 2024–25. North Western Australia was higher again, at $4,966, the highest average of the four ACCC regions.
The ACCC also found that affordability remains a concern in northern Australia, where insurer choice is more limited and rebuilding costs can be higher than in other parts of the country.
How does insurance differ for unit owners?
Unit owners usually pay contents insurance rather than full building insurance. The building structure is generally insured through the owners corporation or strata corporation, with the cost shared through strata levies.
Strata insurance premiums were highest in North Western Australia in 2024–25, at $20,385 per year. The Northern Territory averaged $11,108, while North Queensland averaged $9,154. These costs are shared across owners in a building, so rising strata insurance can increase the total cost of unit ownership even when an individual contents premium is lower than a house insurance premium.
Section 05 · Council rates
Which states pay the highest council rates in Australia?
Council rates are levied each year to fund local services, including waste collection, roads, parks and community infrastructure. For many homeowners, rates are billed quarterly, but the annual total varies considerably by location.
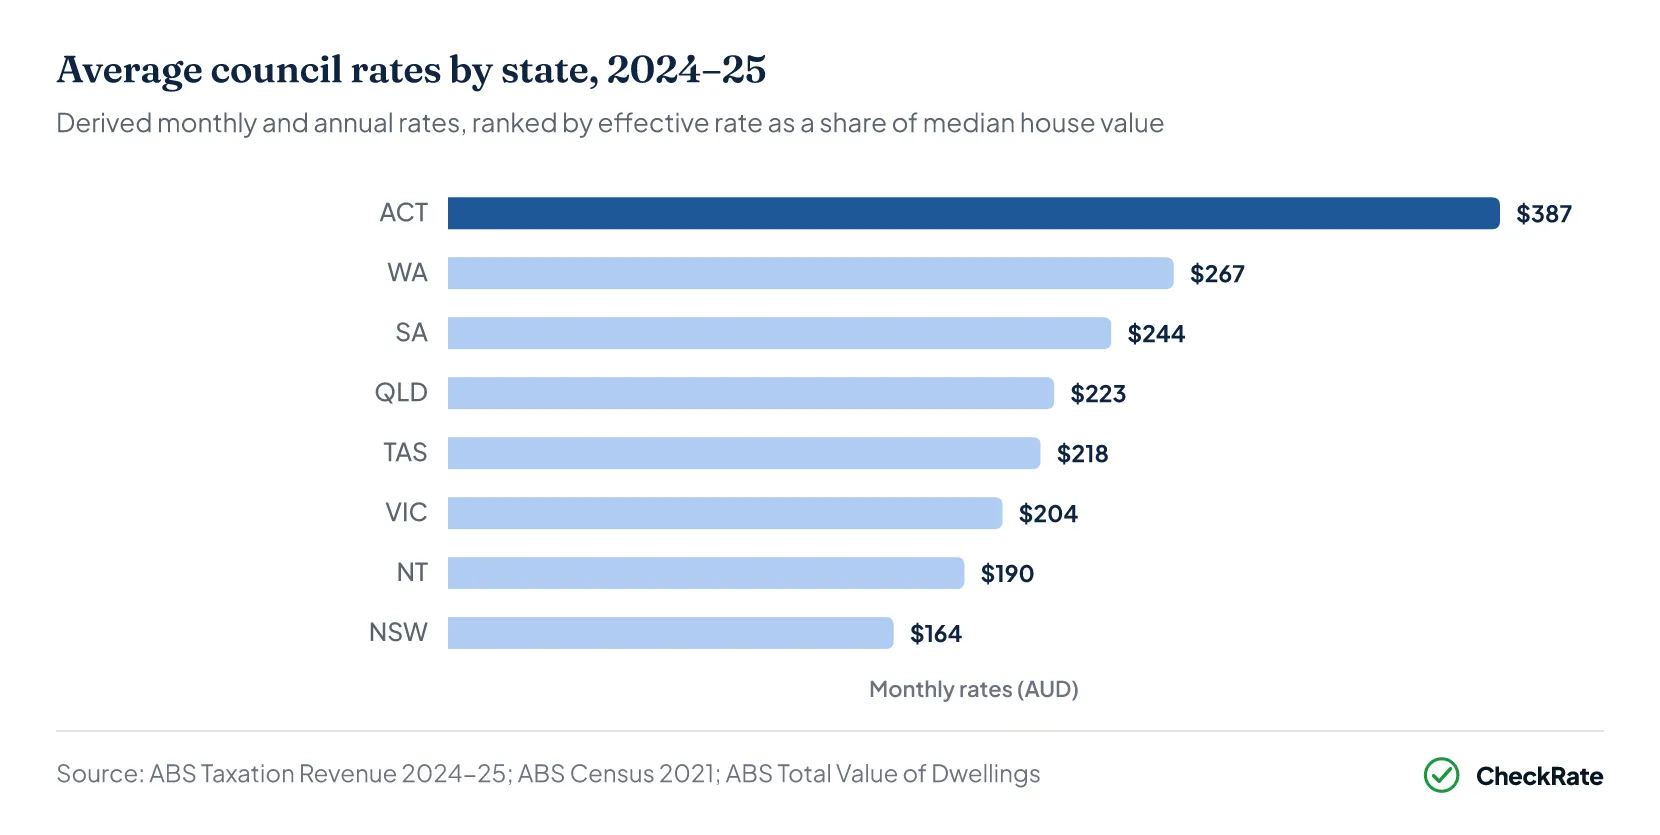
The ACT is not directly comparable with state local councils because territory-wide general rates fund services that are split between state and local governments elsewhere. On this article's derived basis, the ACT has the highest indicative annual rates burden as a share of property value, at 0.43%. Tasmania and WA follow at 0.35% and 0.32% respectively.
NSW has the lowest derived rate relative to property value, at 0.13%. Despite having the highest property-price benchmark, NSW has the lowest derived annual council rates figure in the model, at around $1,970 per year.
These are indicative estimates, not observed average bills. The dwelling count used as the denominator comes from the 2021 Census and has not been updated for housing growth since then, so current averages may differ from the figures shown
| Council rates by state, 2024–25 | |||
|---|---|---|---|
| State / territory | Monthly rates | Annual rates | Rate as % of value |
| ACT | $387 | $4,640 | 0.43% |
| TAS | $218 | $2,610 | 0.35% |
| WA | $267 | $3,200 | 0.32% |
| NT | $190 | $2,280 | 0.30% |
| SA | $244 | $2,930 | 0.30% |
| VIC | $204 | $2,450 | 0.29% |
| QLD | $223 | $2,680 | 0.23% |
| NSW | $164 | $1,970 | 0.13% |
Source · ABS Taxation Revenue 2024–25, ABS Census 2021 and ABS Total Value of Dwellings, March quarter 2026
Section 06 · Repairs and maintenance
Estimated house maintenance costs by capital city
Maintenance costs do not arrive on a fixed schedule, but they build up over time. This article uses a 1% annual allowance as an indicative long-term benchmark for repairs, upkeep and gradual replacement of fixtures and fittings.
Some years require little spending. Others may include a hot water system replacement, roof repair, fence rebuild or appliance replacement. The 1% figure is a long-term estimate rather than a precise annual cost, and actual spending varies by property age, condition and location.
| Estimated annual house maintenance costs by capital city | |||
|---|---|---|---|
| State / territory | Median house price | Monthly allowance | Annual total (1%) |
| NSW | $1,485,000 | $1,238 | $14,850 |
| QLD | $1,150,000 | $958 | $11,500 |
| ACT | $1,071,300 | $893 | $10,713 |
| WA | $1,000,000 | $833 | $10,000 |
| SA | $980,000 | $817 | $9,800 |
| VIC | $850,000 | $708 | $8,500 |
| NT | $750,000 | $625 | $7,500 |
| TAS | $740,000 | $617 | $7,400 |
Source · ABS Total Value of Dwellings, March quarter 2026, median established house transfer prices by capital city
Owners of strata-titled properties, such as apartments and townhouses, do not usually budget for building-level maintenance in the same way as house owners. Their strata levies include contributions to a capital works fund managed by the owners corporation, which covers building repairs and common-area upkeep. As Australia's dwelling mix shifts away from detached houses, strata costs are becoming part of ownership for a growing share of buyers.
Section 07 · Strata fees
Estimated strata fees by capital city for median-priced units
For unit and apartment owners, the strata levy replaces some costs that house owners usually pay separately, including building-level maintenance and, in most cases, building insurance. The amount depends on the building's age, amenities, insurance costs, capital works fund and owners corporation decisions.
Using the mid-range benchmark of 0.8%, the table below shows estimated monthly levies based on median attached dwelling prices in each capital city, used as a benchmark for each state. An NSW unit owner at the Sydney median price of $848,000 can expect to pay around $565 per month ($6,784 per year) in levies. Queensland now has the second-highest unit median at $834,500, making its estimated levy of $556 per month among the highest in the country.
| Estimated strata levies by capital city | |||
|---|---|---|---|
| State / territory | Median unit / apt price | Monthly levy (0.8%) | Annual equivalent |
| NSW | $848,000 | $565 | $6,784 |
| QLD | $834,500 | $556 | $6,676 |
| SA | $740,000 | $493 | $5,920 |
| WA | $735,000 | $490 | $5,880 |
| ACT | $625,000 | $417 | $5,000 |
| VIC | $615,000 | $410 | $4,920 |
| TAS | $610,000 | $407 | $4,880 |
| NT | $430,000 | $287 | $3,440 |
Source · ABS Total Value of Dwellings, March quarter 2026. Strata levies are estimated using 0.8% of median attached dwelling prices.
What do strata fees actually cover?
Strata levies typically fund two areas: an administrative fund for day-to-day costs such as building insurance, common-area cleaning, garden maintenance and minor repairs; and a capital works fund for larger future expenses such as roof replacement, lift maintenance and facade work.
For unit owners, the levy covers many building-level costs that house owners usually pay separately. A building's capital works fund can also affect the true ongoing cost, especially if major repairs or special levies are expected.
Why can strata fees increase?
Strata levies are set by the owners corporation at each annual general meeting and can rise or fall based on actual costs, insurance premiums and the capital works fund balance. Major repairs, such as lift replacement, water damage or ageing plumbing, can also trigger a special levy on top of regular fees.
Levy changes depend on state-specific rules, the scheme's governing documents, budget approvals and decisions of the owners corporation or body corporate. Relevant documents can include recent annual meeting minutes, levy notices, the capital works plan and the applicable state strata or body corporate rules.
Section 08 · Water rates
Water and wastewater bills add about $137 per month
Water and wastewater costs are typically one of the smaller recurring ownership expenses, but they still belong in the full ownership cost model. Most homeowners pay a fixed access charge for network maintenance and connection, plus variable usage charges based on consumption.
Source: Bureau of Meteorology, National Performance Report: Water and wastewater service providers, 2024–25. Figures are national median typical residential customer bills and vary by utility, household size, usage and billing arrangements.
In the Bureau of Meteorology's 2024–25 dataset, the median typical residential customer bill for drinking water supply and wastewater was about $1,641 per year, or $137 per month. Exact bills vary by utility, household size, usage, location and whether water and wastewater charges are billed separately or through council rates.
References
- Lending Indicators, June Quarter 2026, Table 24, cat. 5601.0 · Australian Bureau of Statistics
- RBA, Lenders' Interest Rates (Statistical Table F6) — housing rates, February 2026 · Reserve Bank of Australia
- ABS, Consumer Price Index, Australia, March 2026 · Australian Bureau of Statistics
- ABS Total Value of Dwellings, March quarter 2026 · Australian Bureau of Statistics
- ACCC, Insurance monitoring report 2026 – Supplementary data · accc.gov.au
- ABS, Taxation Revenue, Australia, 2024–25, Table 1 · Australian Bureau of Statistics
- Maintenance allowance: 1% of property value, indicative industry benchmark · Industry benchmark (not an official ABS or government measure)
- Bureau of Meteorology, National Performance Report: Water and wastewater service providers, 2024–25 · bom.gov.au