


Updated
- Serviceability buffer
- 3.0 pp
- Minimum serviceability buffer above loan rate, confirmed May 2026
- Modelled test rate
- ~9%
- Modelled test rate for new owner-occupier loans at April 2026 rates
- Average loan size
- $735K
- Average owner-occupier loan size, March quarter 2026
- Loan size growth
- +21.9%
- Rise in average owner-occupier loan size over four years, despite fewer loans
 Australian wages and wealth since 2000: why higher pay has not gone as farThe average full-time Australian worker earned $2,051.10 a week in ordinary-time wages in November 2025, equal to $106,657 a year. That was 157% higher than in November 2000, when the same measure was…
 How long does it take to save a house deposit in Australia?In the March 2026 quarter, Australia’s mean dwelling price reached $1,111,100, up from $677,475 in 2017. A 20% deposit on the national mean home is now $222,220.
 Average mortgage repayment in Australia: what homeowners pay each monthThe repayment for a new owner-occupier loan in Australia is around $4,006 a month, or $924 a week, based on a 30-year principal-and-interest term. The estimate uses the average 2025 loan size of $693,…
Section 01 · The framework
How banks assess borrowing capacity in Australia
Residential mortgages account for over 60% of Australian bank loan portfolios, but there is no single published figure for borrowing power. Instead, banks assess borrowing capacity using rules and data linked to the Australian Prudential Regulation Authority (APRA), the Reserve Bank of Australia (RBA) and the Australian Bureau of Statistics (ABS).
APRA sets lending standards, the RBA influences borrowing costs through the cash rate, and the ABS records what households are borrowing. Together, these sources help explain how banks assess home loan applications.
When a borrower applies for a home loan, banks mainly assess whether the borrower can afford repayments and whether their debt level is manageable compared with their income and the property value. These checks commonly use debt-to-income ratio (DTI) and loan-to-value ratio (LVR).
| Australian home lending at a glance, mid-2026 | ||
|---|---|---|
| Indicator | Latest official figure | Date |
| Mortgage serviceability buffer | 3.0 percentage points | Confirmed 28 May 2026 |
| Cash rate target | 4.35% | Effective 6 May 2026 |
| Average rate, new owner-occupier loans (all) | 5.98% | April 2026 |
| Average rate, new investor loans (all) | 6.15% | April 2026 |
| Modelled test rate for new owner-occupier loans | ~8.98% | April 2026 |
| New dwelling loan commitments | 139,794 | March quarter 2026 |
| Value of new dwelling loans | $103.0 billion | March quarter 2026 |
| Average owner-occupier loan size | $735,000 | March quarter 2026 |
| Average investor loan size | $709,000 | March quarter 2026 |
| New loans with LVR 80% or more | 32.2% | December quarter 2025 |
| New loans with DTI 6x or more | 6.8% | December quarter 2025 |
Source · APRA, RBA and ABS
Section 02 · Serviceability
How is home loan serviceability assessed?
At April 2026 mortgage rates, the modelled minimum test rate was close to 9% for new owner-occupier loans and slightly higher for investor loans. This is based on APRA's 3.0 percentage point serviceability buffer being added to the loan rate.
Serviceability is used to test whether a borrower could still afford repayments at a higher assessment rate. This creates a buffer in case interest rates rise after the loan settles. On 28 May 2026, APRA confirmed that the buffer would remain at 3.0 percentage points.
The buffer was raised from 2.5 to 3.0 percentage points in October 2021, before the RBA began lifting the cash rate in May 2022. This means borrowing capacity was already being tightened before interest rates started to rise.
| Modelled serviceability test rates in Australia, April 2026 | |||
|---|---|---|---|
| Loan type | Average new-loan rate | Buffer | Modelled test rate |
| Owner-occupier, all loans | 5.98% | +3.00 pp | 8.98% |
| Owner-occupier, principal & interest | 5.92% | +3.00 pp | 8.92% |
| Investor, all loans | 6.15% | +3.00 pp | 9.15% |
| Investor, principal & interest | 6.09% | +3.00 pp | 9.09% |
Source · RBA housing lending rates (April 2026) and APRA serviceability settings (confirmed May 2026)
Beyond the rate buffer, lenders also assess income, debts and living expenses. Some income may be discounted before it is counted. For example, rental income and other non-salary income may be reduced by at least 20% in serviceability calculations.
Credit card and revolving debt is assessed against the approved credit limit, not only the amount currently owed. Interest-only loans are also tested using principal-and-interest repayments, so lenders assess whether the borrower could afford the loan after the interest-only period ends.
Lenders must also compare the borrower's declared living expenses with a suitable benchmark figure. They generally use whichever figure is higher. Benchmark tools such as the Household Expenditure Measure (HEM) or Henderson Poverty Index (HPI) cannot be used as the only measure of expenses. Formal exceptions to the serviceability buffer cover less than 5% of new housing lending. This means the buffer applies to most new home loans.
Section 03 · Income & expenses
How income and expenses affect borrowing power
Wages grew 3.3% over the year to March 2026, while the Consumer Price Index rose 4.2% over the year to April 2026. This means prices rose faster than wages over this period. Housing costs rose 6.3% over the year, and transport costs rose 6.6%, both above headline inflation.
These cost pressures matter because lenders assess whether a borrower can afford repayments after allowing for income, debts and living expenses. Serviceability assessments are not based only on current interest rates. Lenders also consider whether a borrower could manage repayments if income fell or costs increased over the loan term.
Higher Education Loan Program (HELP) debt is treated differently from other debts. It is excluded from debt-to-income ratio (DTI) calculations, and lenders have some flexibility to exclude HELP repayments from serviceability assessments where those repayments are unlikely to materially affect the borrower across the loan term. APRA still requires lenders to consider the borrower's full financial position.
Living cost pressures varied by household type. The ABS Selected Living Cost Indexes rose between 2.6 and 5.2% over the year to March 2026, reflecting different spending patterns among renters, mortgage holders, pensioners and other household types. These figures are not used directly in individual lender calculations, but they help show the wider cost environment facing borrowers.
Section 04 · Interest rates
How did interest rates affect loan sizes between 2022 and 2026?
The average owner-occupier loan size rose 21.9% between March 2022 and March 2026, from $603,000 to $735,000. Over the same period, the number of new owner-occupier loan commitments fell 17.8%.
This means the average loan became larger, even though fewer owner-occupier loans were being taken out.
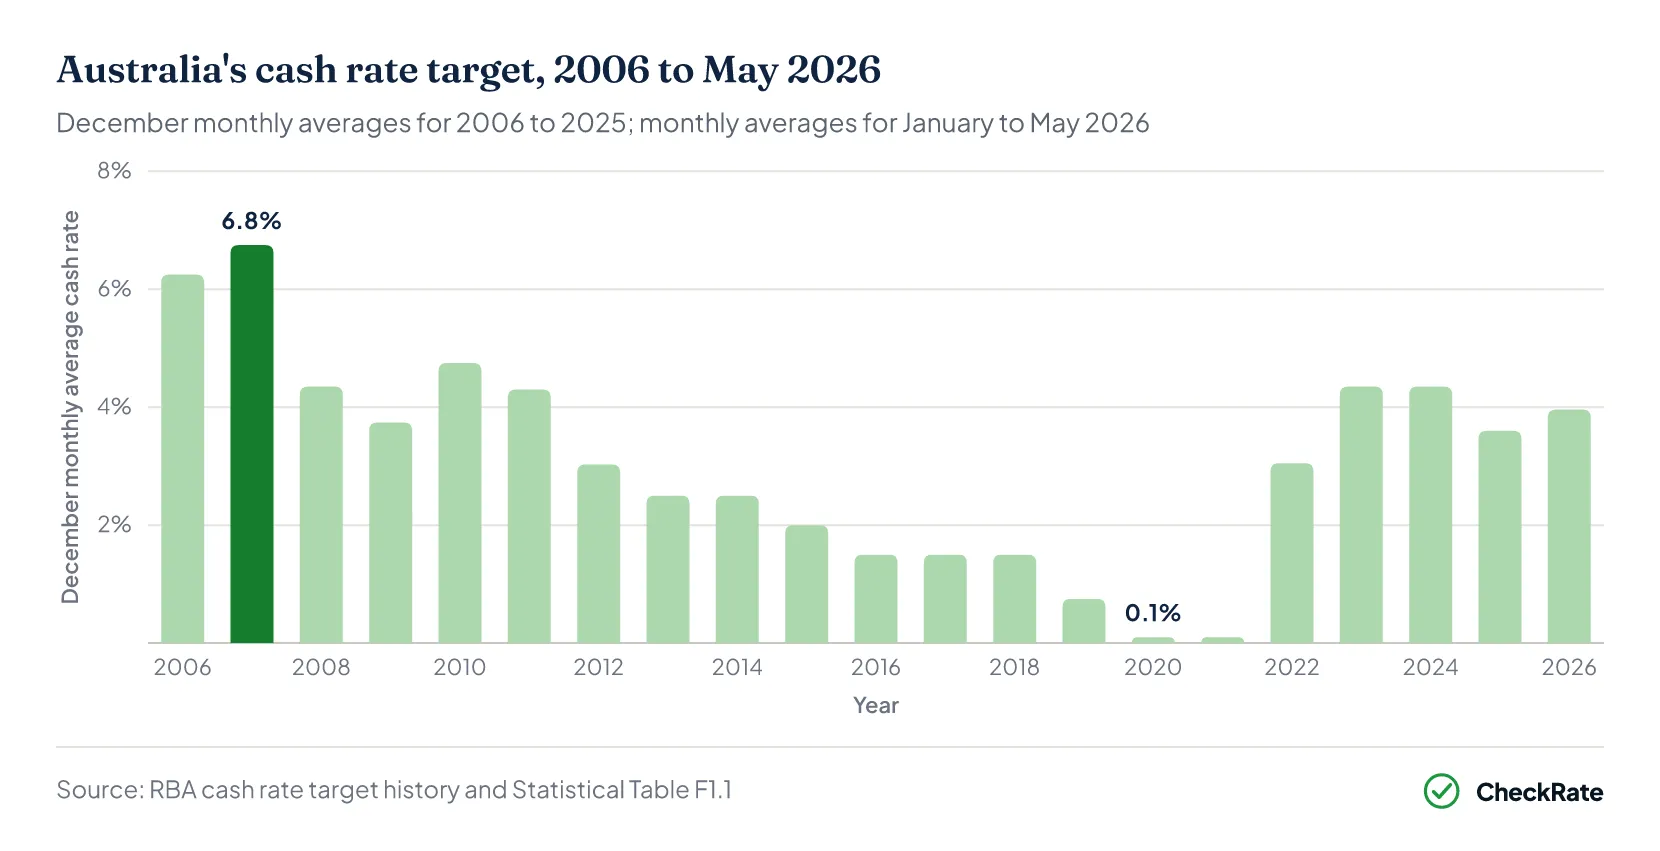
The shift happened during a changing interest rate cycle. The cash rate was 0.10% in April 2022, rose to 4.35% by November 2023, eased to 3.60% by August 2025, and then returned to 4.35% on 6 May 2026. By May 2026, the 2025 rate cuts had been reversed.
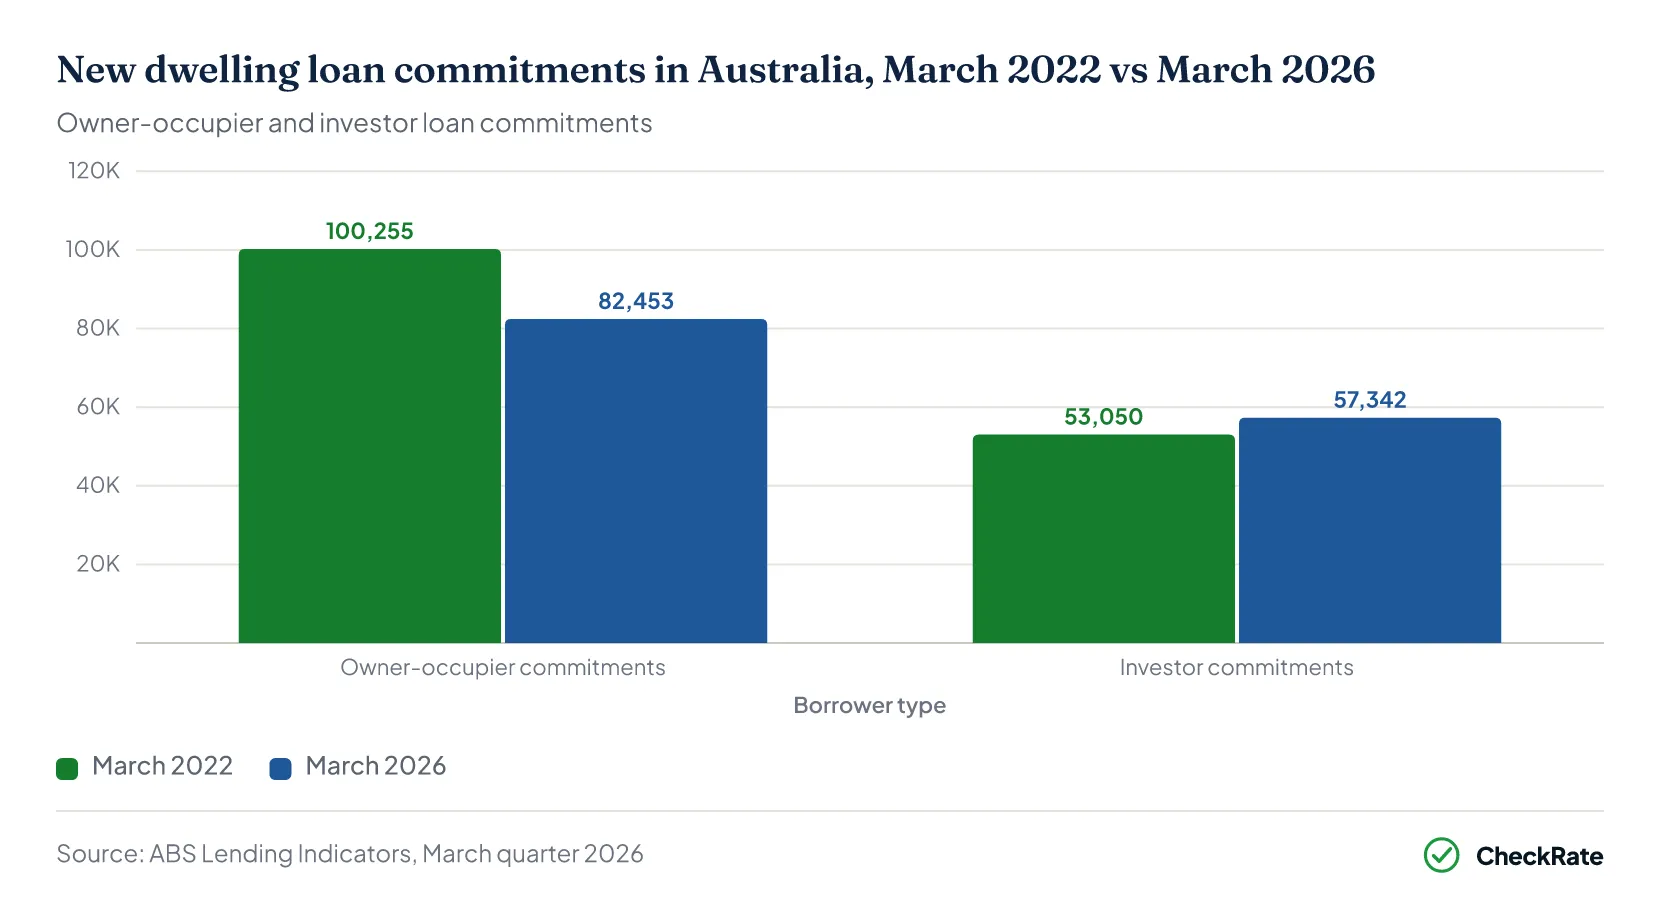
Loan numbers fell between March 2022 and March 2026, but average loan sizes increased. Total new dwelling commitments fell from 153,305 to 139,794, a decrease of 8.8%.
Within that total, owner-occupier commitments dropped from 100,255 to 82,453, down 17.8%. Investor commitments moved in the opposite direction, rising from 53,050 to 57,342, up 8.1%.
The fall in loan numbers was matched by a rise in average loan sizes. The national average owner-occupier loan size grew from $603,000 to $735,000 over the four years, up 21.9%. The average investor loan size rose from $607,000 to $709,000, up 16.8%.
Total lending value reached $103.0 billion in the March quarter of 2026, up 18.5% year-on-year, even though the number of new loans was 6.2% lower than a year earlier.
| Australian dwelling loan activity, March 2022 to March 2026 | |||
|---|---|---|---|
| Metric | March 2022 | March 2026 | Change |
| Total new dwelling commitments (no.) | 153,305 | 139,794 | –8.8% |
| Owner-occupier commitments (no.) | 100,255 | 82,453 | –17.8% |
| Investor commitments (no.) | 53,050 | 57,342 | +8.1% |
| Average owner-occupier loan size | $603,000 | $735,000 | +21.9% |
| Average investor loan size | $607,000 | $709,000 | +16.8% |
Source · ABS Lending Indicators
Banks passed on the 2025 cash rate cuts to new variable-rate mortgage rates, then passed on the 2026 increases in the same way.
The gap between rates for new borrowers and existing variable-rate borrowers also narrowed. In 2019, new borrowers were paying about 0.35 percentage points less than existing borrowers. By December 2025, that gap had narrowed to about 0.03 percentage points.
This means the discount once available to new borrowers had largely closed by the mid-2020s.
All of the 2025 rate reductions were reversed within five months. The cash rate monthly average rose from 3.60% in January 2026 to 4.31% in May 2026, while the target returned to 4.35% on 6 May.
Because banks passed on the 2025 cuts and the 2026 increases to new variable-rate mortgage rates, the modelled serviceability test rate also moved back up over this period.
Section 05 · DTI & LVR limits
What are DTI and LVR limits for home loans?
Debt-to-income ratio (DTI) and loan-to-value ratio (LVR) are two measures lenders use when assessing home loan applications. DTI compares a borrower's total debt with their income. LVR compares the loan amount with the property value.
In the December quarter of 2025, 11.3% of new investor loans had a debt-to-income ratio of six or more. This compared with 4.0% of new owner-occupier loans.
This means high-DTI lending was almost three times higher among investor loans than owner-occupier loans. APRA cited this difference as one reason for introducing formal DTI limits from 1 February 2026.
Under the rules, no more than 20% of new investment loans and no more than 20% of new owner-occupied loans can have a DTI of six or more. The limit is measured separately for each loan type.
Across the full mortgage market, high-DTI lending was still below 10% of total new lending as at December 2025.
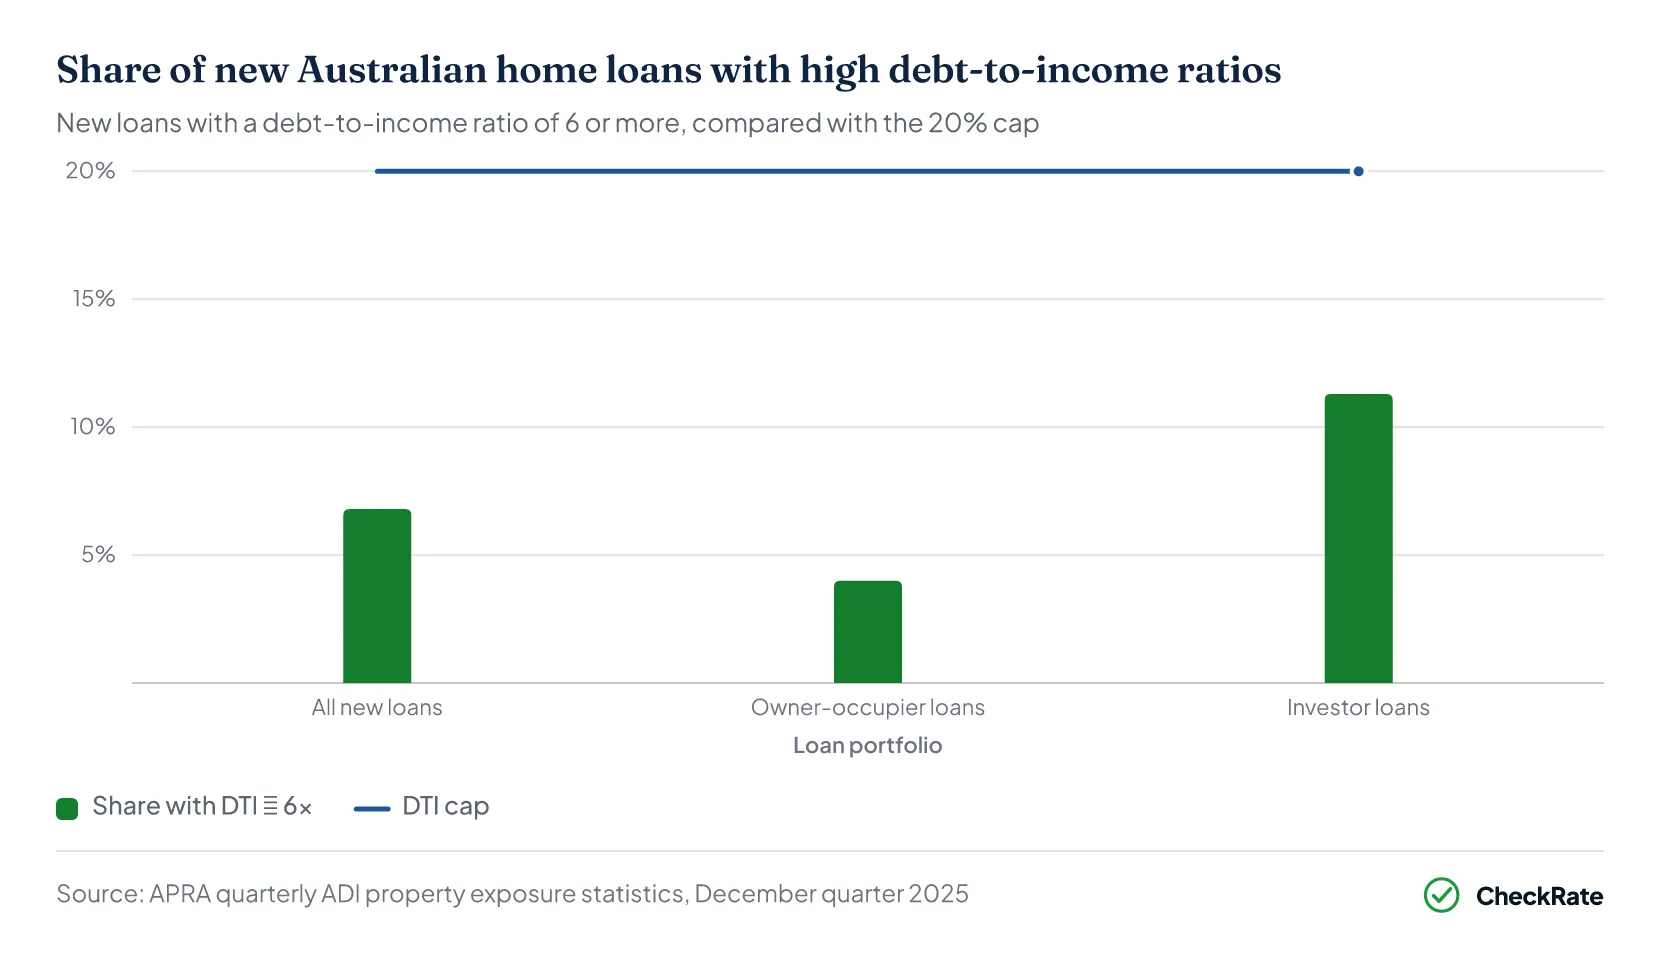
High-DTI lending was rising before the cap was introduced. Across all new borrowers, the share of loans with a debt-to-income ratio of 6 or more fell to 5.0% in the June quarter of 2024, then rose to 6.8% by December 2025. For investors, the share reached about 10% in the September quarter of 2025. This was still below the 20% cap, but the upward trend helped explain APRA's decision to introduce the limit.
Several loan types are excluded from the DTI cap. These include loans for the construction of new dwellings, loans used to buy newly built dwellings, and certain owner-occupier bridging loans.
Loan-to-value ratio (LVR) is measured differently. In the December quarter of 2025, 32.2% of new loans had an LVR of 80% or more, up from 31.0% a year earlier.
At the same time, the share of outstanding mortgage credit with an LVR of 80% or more fell from 17.4% to 16.9%.
There is no equivalent cap on high-LVR lending. Unlike the DTI rules, APRA does not limit the share of new lending that can have a high LVR. However, higher-LVR loans can attract larger capital requirements for lenders.
Share of all outstanding residential mortgage credit with LVR at or above 80%, measured at December in each year. APRA quarterly ADI property exposure statistics, December quarter 2025.
Share of new loans funded in the December quarter with LVR at or above 80%. Includes First Home Guarantee scheme loans, where lenders record the actual LVR before the guarantee is applied. APRA quarterly ADI property exposure statistics, December quarter 2025.
The two figures move in opposite directions because they measure two different parts of the mortgage market.
Outstanding mortgage credit looks at existing home loans. Over time, many borrowers pay down part of their loan. This can reduce the share of existing loans with a high loan-to-value ratio (LVR).
New loans funded look at loans taken out during the quarter. In the December quarter of 2025, a higher share of new loans had an LVR of 80% or more. This may reflect higher property prices, smaller deposits, or the use of the First Home Guarantee scheme.
The First Home Guarantee scheme is counted in these figures because lenders record the loan's actual LVR before the government guarantee is applied. This means these loans can still appear as high-LVR loans, even though the guarantee reduces the lender's risk.
Non-bank lenders are assessed differently from banks. They are not covered by APRA's serviceability buffer, DTI cap or LVR capital rules. They hold less than 5% of residential mortgage credit in Australia, so they make up a small part of the market.
Section 06 · First home buyers
How much are first-home buyers borrowing in Australia?
The average first-home buyer loan reached $614,048 in the March quarter of 2026, up about 13% over the year. This was higher than the 11.4% increase recorded across the broader owner-occupier market over the same period.
First-home buyer loan commitments fell 4.3% over the quarter, down 1,349 from the December quarter. However, they were still 5.0% higher than the same period a year earlier. Total first-home buyer lending reached $17.9 billion in the March quarter of 2026.
First-home buyers using the First Home Guarantee scheme may contribute to the share of new high-LVR lending recorded in APRA statistics. This is because lenders record the actual loan-to-value ratio before the government guarantee is applied.
Across the mortgage market as a whole, 1.1% of owner-occupier loans and 0.9% of investor loans were non-performing as at December 2025. These figures apply to the full mortgage market, not specifically to first-home buyers.
No official source breaks down average borrowing capacity by income level, deposit size or location. The figures above show what first-home buyers are borrowing, not the maximum amount they could qualify for.
Section 07 · State & territory data
Which states have the highest average home loan sizes?
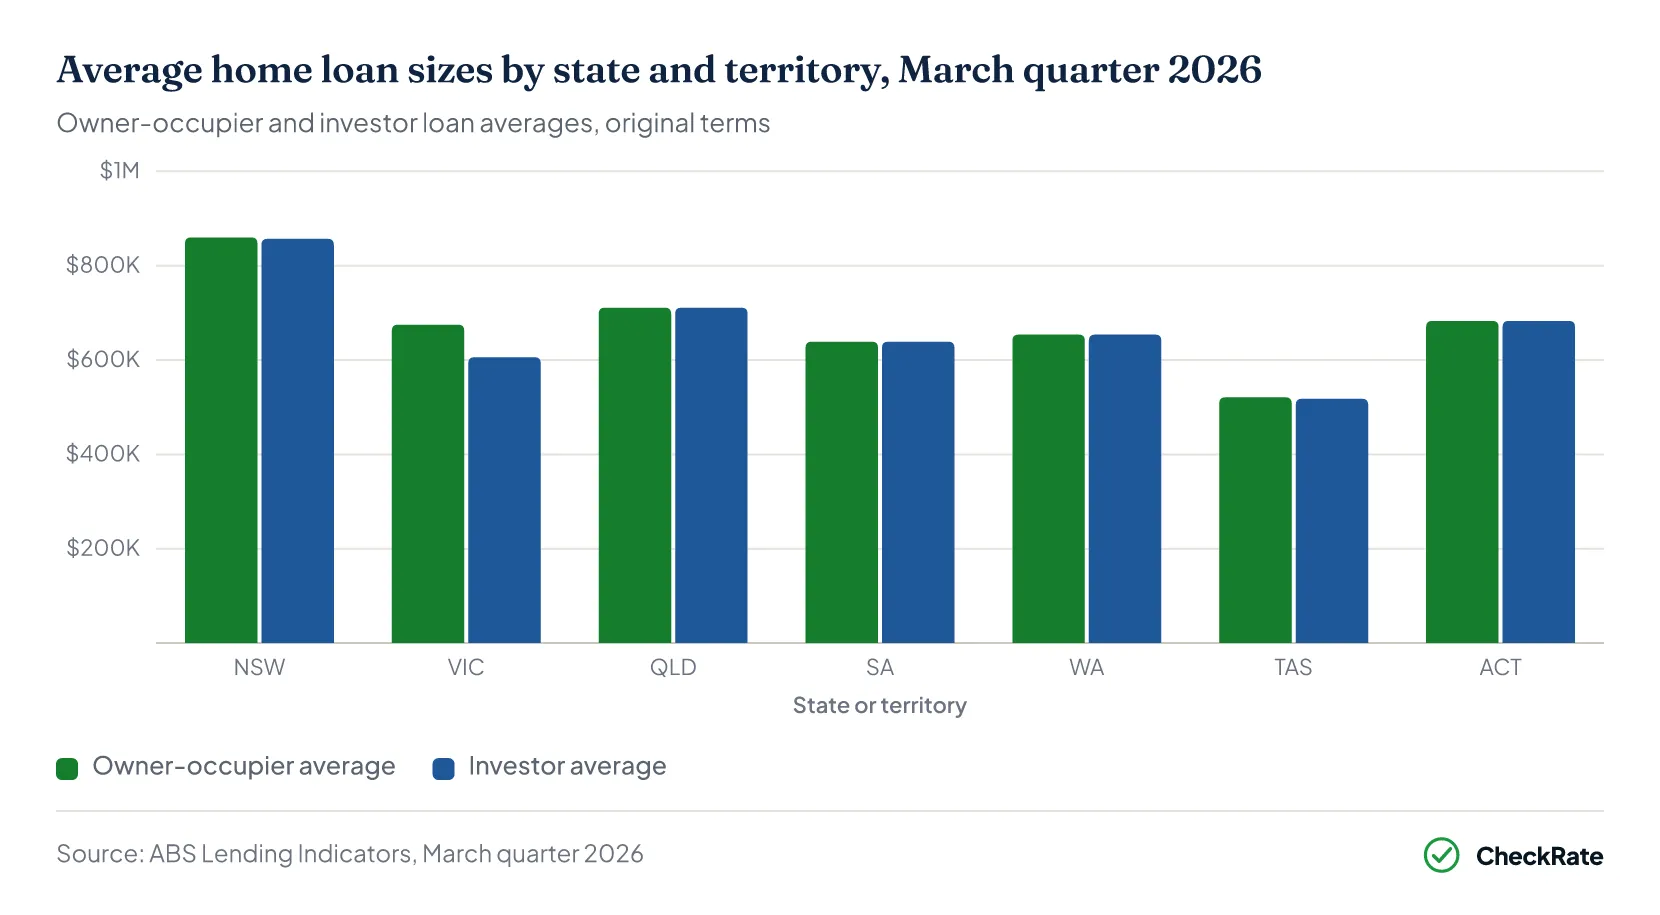
New South Wales recorded the highest average owner-occupier loan size in the March quarter of 2026 at $860,000. Tasmania recorded the lowest at $521,000. This created a gap of $339,000 between the highest and lowest state averages.
Queensland's average owner-occupier loan size reached $711,000, above Victoria's average of $675,000. This was the first time Queensland exceeded Victoria in the available data series.
Western Australia recorded the largest annual increase of any state. The average owner-occupier loan size rose by $109,000 between March 2025 and March 2026, reaching $654,000.
In New South Wales, the average owner-occupier loan size was $860,000, compared with $857,000 for investor loans. This was a gap of just $3,000. In every other state, the average investor loan size remained below the average owner-occupier loan size.
Borrowing power calculator
A transparent estimate of how much you may be able to borrow, based on income and expenses.
References
- APRA maintains current macroprudential policy settings · apra.gov.au
- Senate Select Committee on Productivity: housing lending submission (APRA) · apra.gov.au
- Activation of debt-to-income limits as a macroprudential policy tool · apra.gov.au
- DTI limit implementation details (APRA) · apra.gov.au
- Clarifying treatment of HELP debt obligations — response to consultation (APRA) · apra.gov.au
- APRA Quarterly Authorised Deposit-taking Institution Statistics · apra.gov.au
- Reporting Standard ARS 223.0 — Residential Mortgage Lending · apra.gov.au
- Prudential Practice Guide APG 223 — Residential Mortgage Lending · apra.gov.au
- Update on APRA's macroprudential policy settings (February 2023) · apra.gov.au
- RBA Cash Rate Target · Reserve Bank of Australia
- RBA, Lenders' Interest Rates (Statistical Table F6) — housing rates, February 2026 · Reserve Bank of Australia
- RBA Bulletin, May 2026 · Reserve Bank of Australia
- RBA Bulletin, February 2026 · Reserve Bank of Australia
- Lending Indicators, June Quarter 2026, Table 24, cat. 5601.0 · Australian Bureau of Statistics
- ABS Media Release: New Home Loans Fall in March Quarter · Australian Bureau of Statistics
- ABS Wage Price Index, Australia · Australian Bureau of Statistics
- ABS Consumer Price Index, Australia (latest release, Cat. 6401.0) · Australian Bureau of Statistics