


Updated
- Saving ratio (2023-24)
- 3.0%
- Household saving ratio in 2023-24, down from a peak of 15.0% in 2021
- Super gender gap (60–64)
- $82k
- Gender gap in superannuation at ages 60 to 64, the widest point across age groups analysed
- Median male super (60–64)
- $220k
- Median male super balance at ages 60 to 64, 44% below the average of $395,852
- Retire at ASFA comfortable
- 30%
- Around 30% of Australians retire with enough to meet ASFA's comfortable retirement standard
Source · ATO Taxation Statistics: average superannuation balances by age group and gender, 2022-23 · from www.ato.gov.au
 Australian Savings Statistics 2025Australia's saving rate shifted over the past decade. Before the pandemic, it sat between 4.5% and 7.4%. When COVID lockdowns limited people's spending, savings increased. By FY2021, the saving rate h…
 Cost of living in Australia: what households spent in 2025Australian households spent a combined $923 billion across tracked consumer categories in 2025, up 52% from $606 billion in 2016. When housing costs are included, the average household is estimated to…
 Which Australian capital city is most affordable for buying a house?A typical established house costs between 5.60 and 11.79 times yearly household income across Australia's capital cities, with the lowest ratio in Darwin and the highest in Sydney. The measure divides…
Section 01 · The macro savings trend
Why Australia's household saving ratio has changed
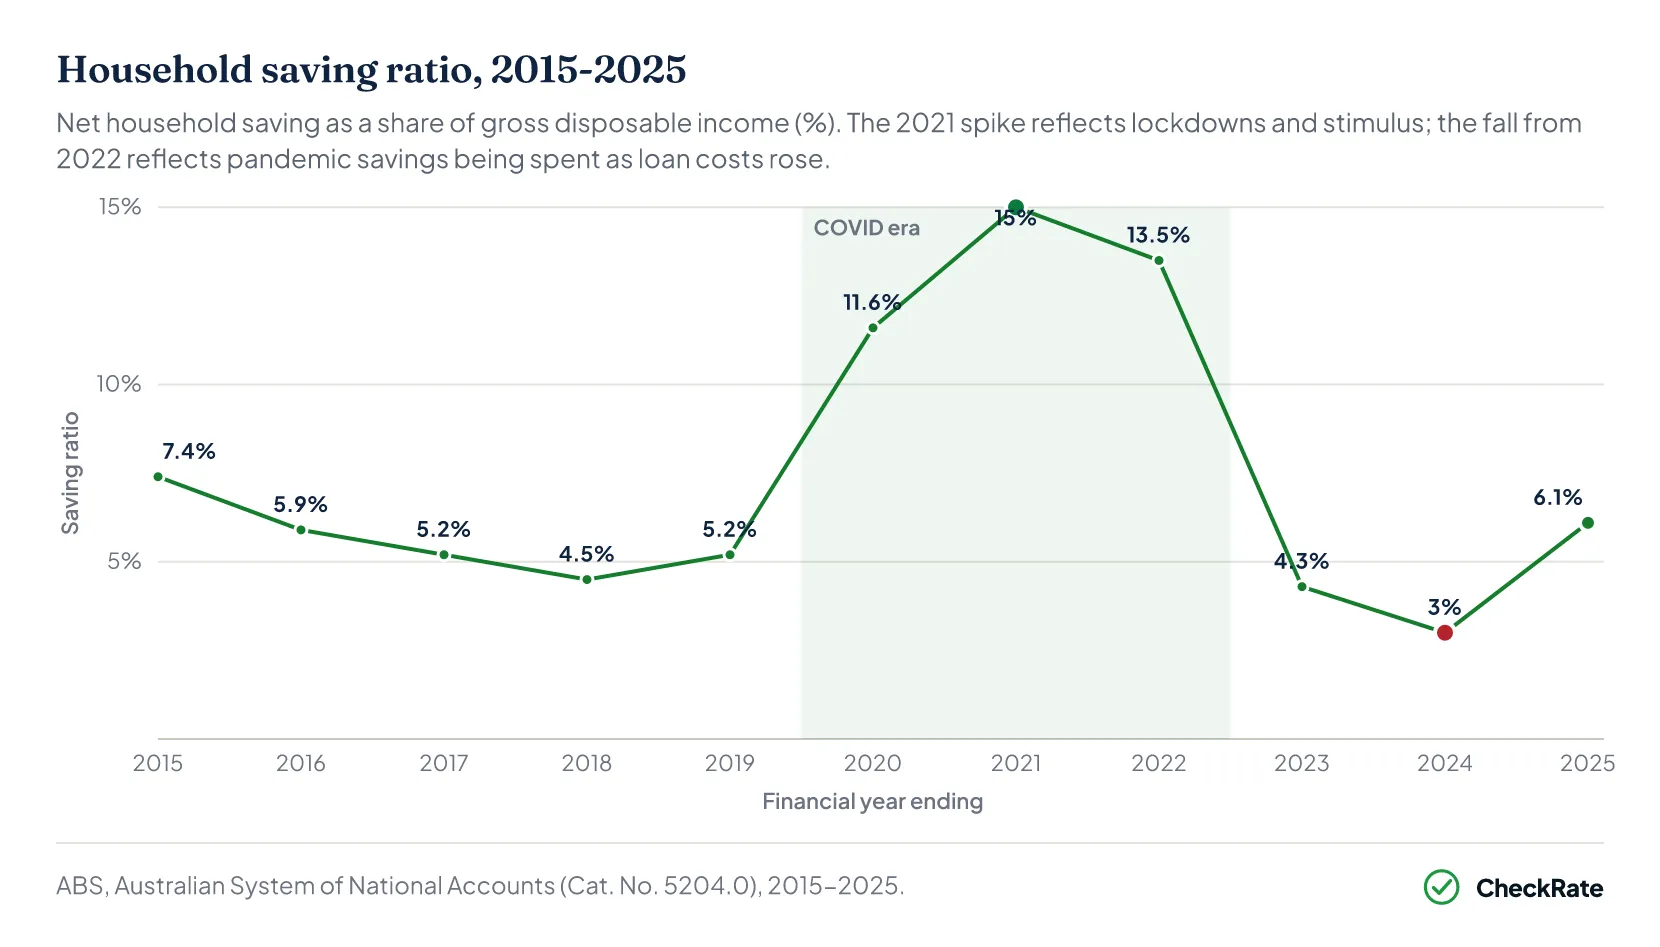
The household saving ratio peaked at 15.0% in 2020–21, the highest level since records began. By 2023–24, it had fallen to 3%, a drop of 12 percentage points from the 2020–21 peak. It partially recovered to 6.1% in 2024–25, but still sat below the long-run average of 9.4% going back to 1959.
The 2021 spike reflected unusual pandemic conditions rather than a lasting change in saving behaviour. During COVID lockdowns, government stimulus payments arrived in bank accounts while many usual spending options were restricted. The saving ratio hit 11.6% in 2019–20 and peaked at 15.0% in 2020–21.
Analysts estimated Australians built up around $253 billion in extra savings, roughly 22% of annual consumer spending. That buffer later helped households maintain spending as interest rates rose sharply.
The drop that followed was steep. The Reserve Bank raised interest rates from near zero to over 4% between 2022 and 2023, pushing home loan repayments higher. At the same time, prices for rent, groceries and power rose faster than wages.
Households spent down their pandemic savings as cost pressures increased, and the saving ratio dropped to 4.3% in 2022-23 and 3.0% in 2023-24. Even before COVID, saving was already in decline, with the ratio having fallen as low as 4.5% in 2018 as wages grew slowly and spending consistently outpaced income.
Source · ATO Taxation Statistics: average superannuation balances by age group and gender, 2022-23 · from www.ato.gov.au
The household saving ratio only measures the share of income not spent in a given year. It does not capture the total wealth a household has built up. Even as the saving rate fell to 3.0% in 2023-24, total household wealth hit record highs, driven mainly by rising property values and growing super balances.
Section 02 · Ages 18 to 29
Average savings at ages 18 to 29
At ages 18 to 24, average super balances are $9,062 for men and $8,163 for women.
By ages 25 to 29, those figures nearly triple, reaching $27,021 for men and $24,821 for women. The growth largely reflects more people moving into full-time work, rather than higher voluntary saving.
For most people in their twenties, super comes mainly from the Superannuation Guarantee (SG), the compulsory employer contribution currently set at 12% of ordinary earnings. Voluntary contributions are less common at this age.
Student debt (HECS-HELP), high rents and low starting wages can limit the amount young workers add beyond compulsory employer contributions.
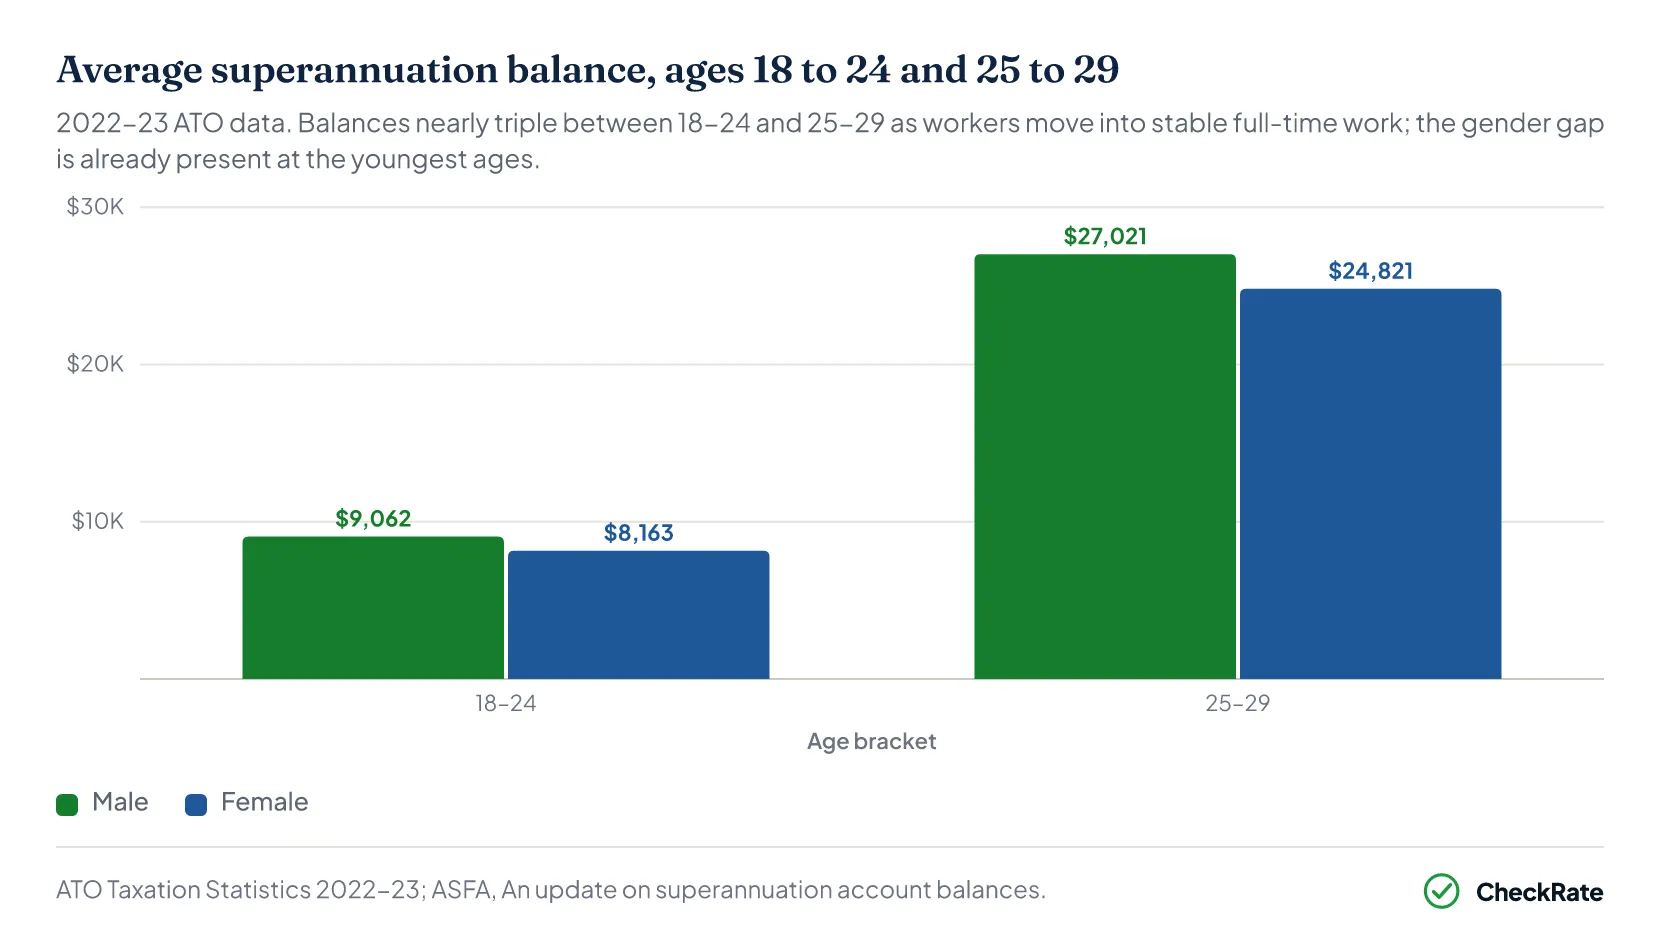
The $899 gap between men and women aged 18 to 24 is small in dollar terms but reflects early differences in earnings and employment patterns.
Young women are more likely to work in lower-paid, casual roles. Until July 2022, employers were not required to pay super on monthly earnings below $450 from a single employer. That excluded many workers juggling multiple part-time jobs, most of whom were women.
Removing that threshold closed an important gap in the super system. But it does not recover the super that earlier generations of young women missed out on.
Section 03 · Ages 30 to 39
Average savings at ages 30 to 39
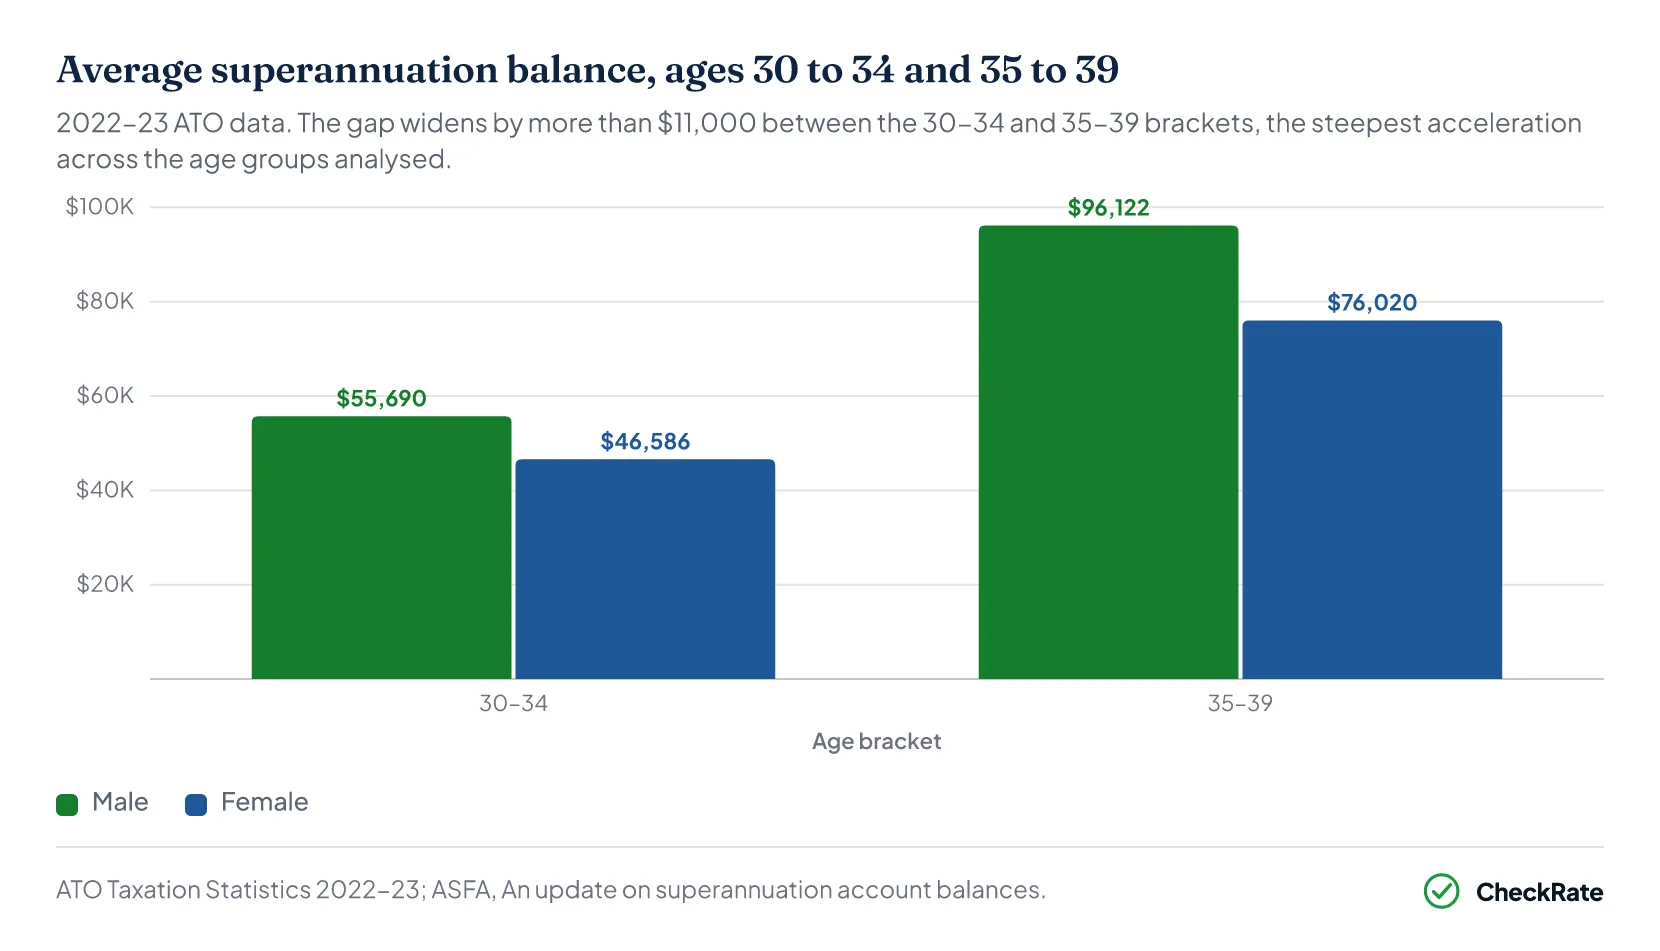
Super balances nearly double during the thirties. For men, the average grows from $55,690 at ages 30 to 34 to $96,122 at ages 35 to 39. For women, the figures are $46,586 and $76,020.
The growth reflects career progression, rising wages, and the first meaningful compounding effect: money already in super has had time to start earning returns on itself.
But the thirties are also where the gap between men and women grows fast, widening from around $2,200 at ages 25 to 29 to more than $20,000 by the late thirties.
The early to mid-thirties are the most common years for starting a family. Women who take time off for parental leave, or who return to work part-time to manage childcare, see their super slow down or stop entirely. Until July 2025, super was not paid on government-funded parental leave, meaning eligible carers did not receive super contributions during that period.
$20k
Gender gap in super by ages 35 to 39. The average male balance is $96,122 versus $76,020 for women, a gap that was just $2,200 in the 25-29 bracket. The gap widens at every subsequent age group in the latest available data.
Source · ATO Taxation Statistics: average superannuation balances by age group and gender, 2022-23 · from www.ato.gov.au
Men in the same age group are more likely to have continuous full-time earnings. Because employer super contributions are a percentage of salary, every pay rise widens the gap. A man whose salary grows from $80,000 to $120,000 through his thirties sees his yearly super contribution grow from $9,600 to $14,400.
A woman who takes two years off for parental leave and then works part-time does not just contribute less. She contributes nothing during those years, and reduced amounts after. Missed contributions can also reduce future compound growth.
The thirties are also when many Australians try to buy their first home. In major cities such as Sydney and Brisbane, median house prices are now well above $1 million, meaning even a standard deposit can take up a large share of income.
Money directed toward a home deposit may reduce the amount available for voluntary super contributions. For most buyers in this age group, super comes down to just the mandatory employer contribution, leaving balances more vulnerable to any break in employment.
Section 04 · Ages 40 to 49
Average savings at ages 40 to 49
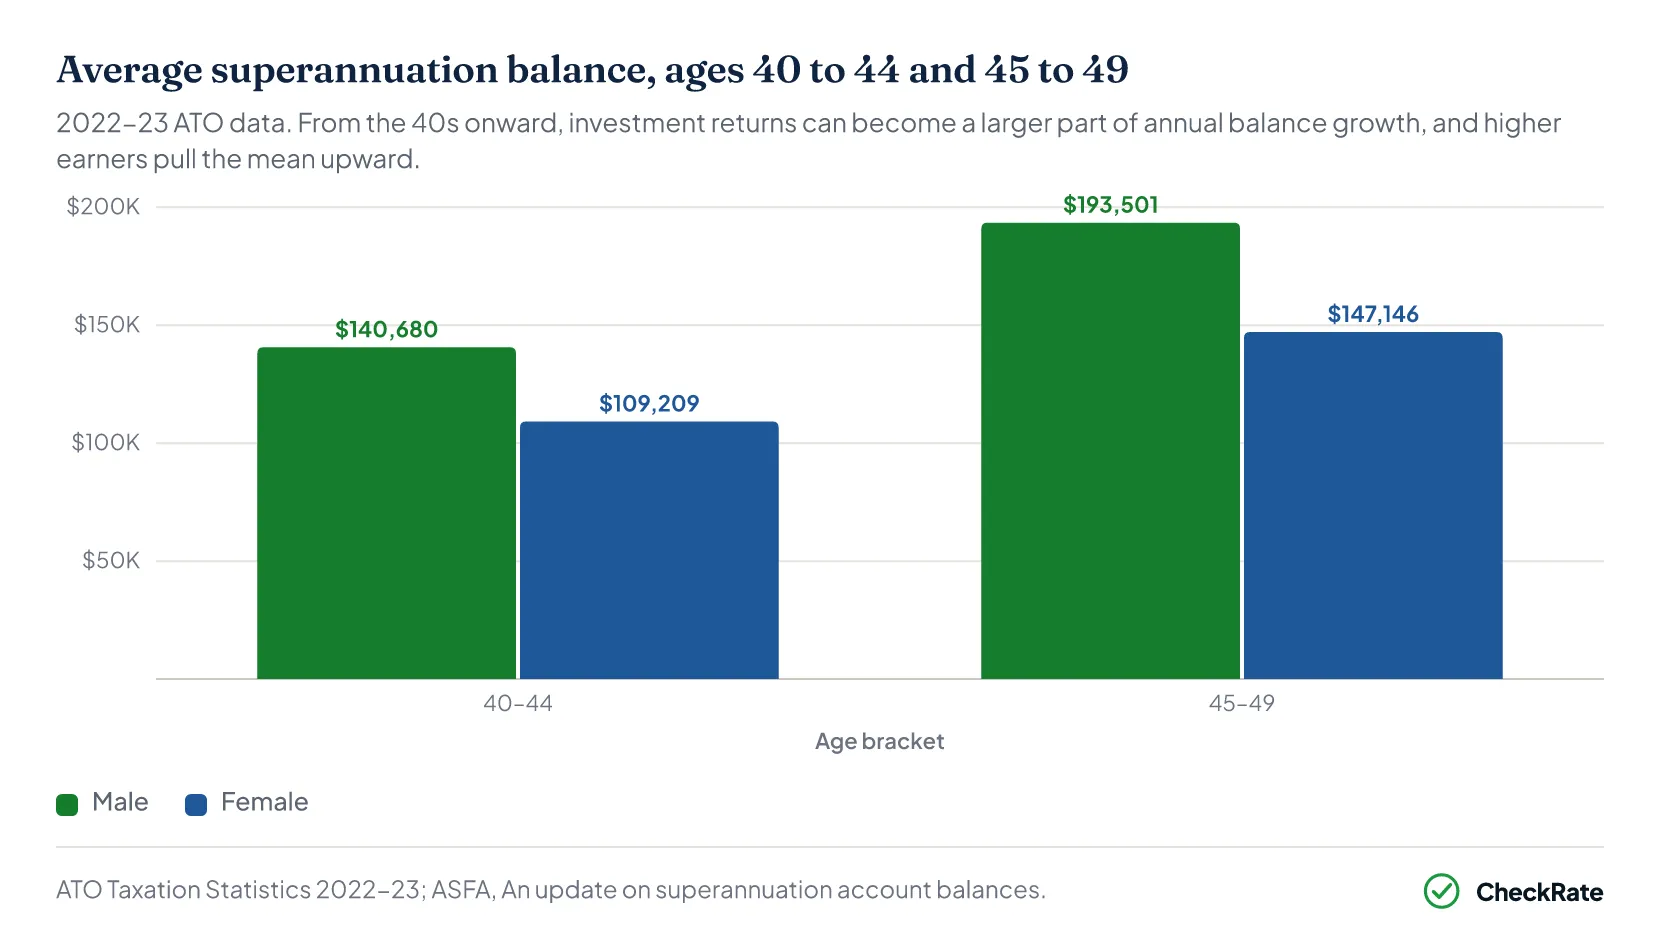
Average super balances for men reach $140,680 at ages 40 to 44, rising to $193,501 at ages 45 to 49. For women, the figures are $109,209 and $147,146.
The gender gap widens to $46,355 by the late forties, because a larger opening balance earns more in investment returns, even when contributions from employer and employee are the same.
By the forties, investment returns can become a larger part of annual balance growth. As an illustrative calculation, a $140,000 balance earning 9.2% in a year would generate about $12,880 before fees, taxes or new contributions.
The compounding that builds in this decade simply was not possible at the lower balances of the twenties and thirties.
The forties are also when divorce and relationship breakdown peak in Australia. When super is divided through a family law settlement, it can have a serious impact on balances, particularly for single parents, who are more often women.
Losing part of a super balance at exactly the point when compound growth is accelerating is particularly costly in the long run.
Section 05 · Ages 50 to 59
Average savings at ages 50 to 59
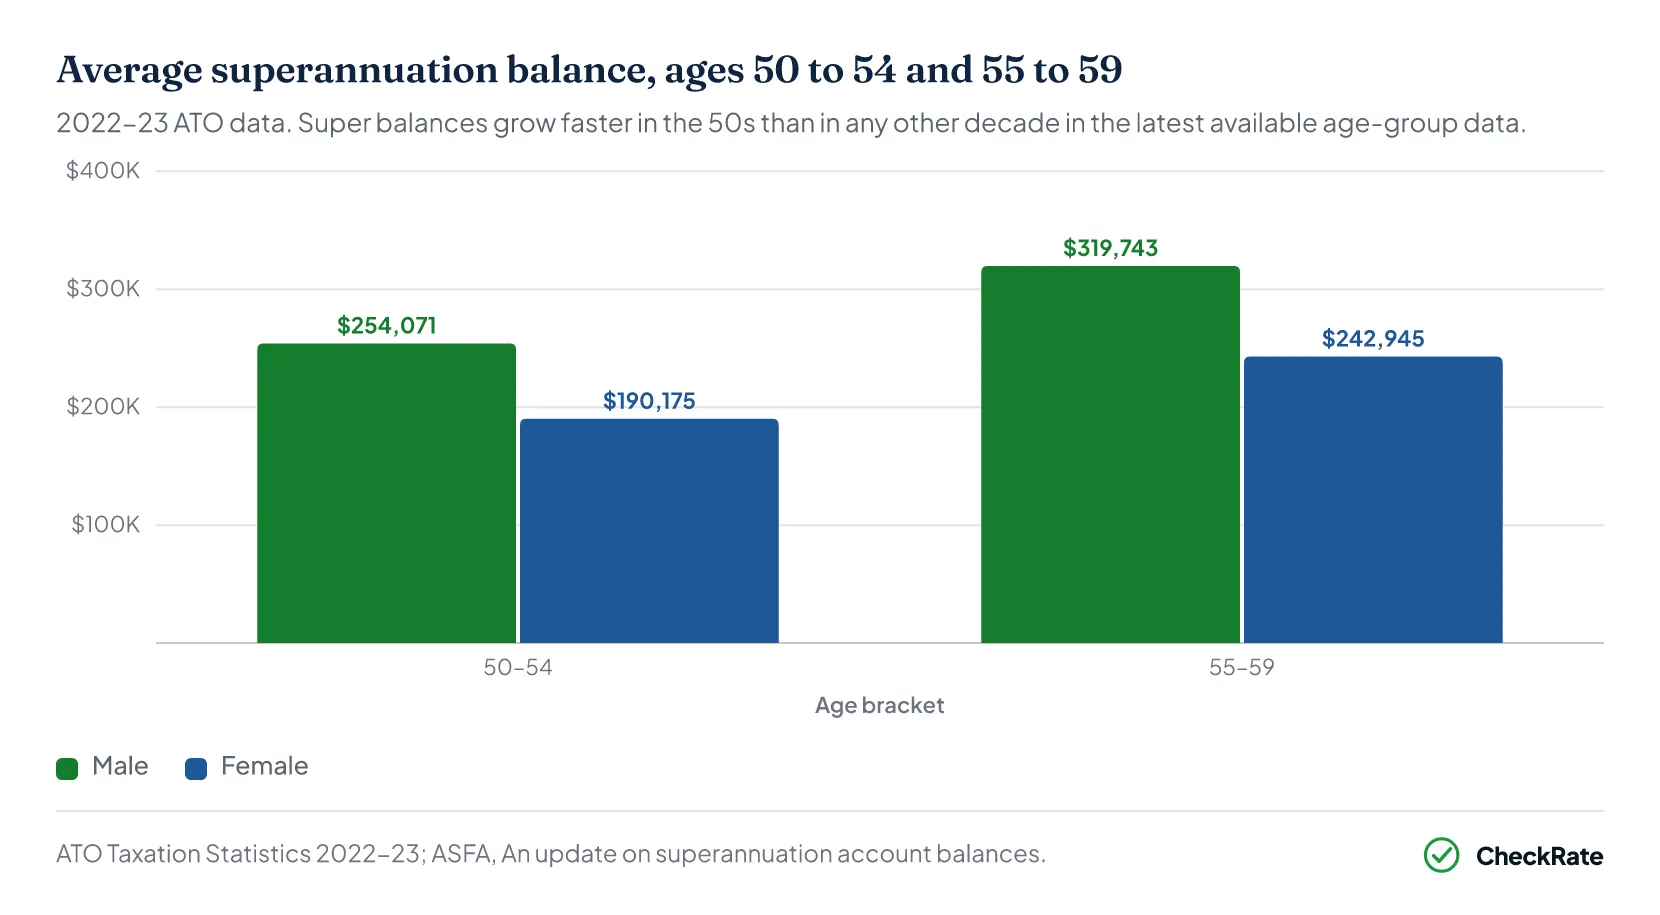
Average super balances for men reach $254,071 at ages 50 to 54 and $319,743 at ages 55 to 59. For women, the figures are $190,175 and $242,945.
The gender gap widens to $76,798 by the late fifties, though the rate slows as more men begin leaving the workforce from age 55 through early retirement, redundancy, and health issues.
The fifties can be an important decade for building a retirement balance. For some households, lower mortgage debt or reduced family expenses may leave more income available for super contributions.
Much of it flows into super, arriving just when compound returns on a larger balance are also accelerating.
Source · ATO Taxation Statistics: average superannuation balances by age group and gender, 2022-23 · from www.ato.gov.au
The carry-forward concessional contributions rule allows unused before-tax contribution caps from the previous five financial years to be used in a later year, where eligibility rules are met. It is one reason some balances can grow faster in the years before retirement.
The Downsizer Contribution scheme lets eligible homeowners who sell their property contribute up to $300,000 per person from the sale proceeds directly into super, outside the standard limits. The eligible age was lowered from 65 to 55 in January 2023. In 2023-24, 16,900 people used the scheme to contribute a combined $4.49 billion.
People on lower incomes also receive a government payment called LISTO (the Low Income Super Tax Offset) that refunds up to $500 a year of the tax paid on employer super contributions. It helps protect small balances from being eroded by tax, but the amount is modest compared to the gap that can build up over a working life.
Section 06 · Ages 60 to 64
Average superannuation balance at ages 60 to 64
The average super balance at ages 60 to 64 is $395,852 for men and $313,360 for women.
These figures show how super balances build over a working life, but the averages still sit well above the typical balance because high-balance accounts pull the mean upward. At age 60, many Australians reach preservation age and may be able to access super, depending on their circumstances.
But the averages do not show the typical balance. The median balance for men aged 60 to 64 is $219,773, which is 44% below the mean. For women, it is $163,218, which is 48% below.
Treasury estimated that fewer than 80,000 people would have super balances above $3 million in 2025–26. These very large balances help explain why mean balances sit above median balances.
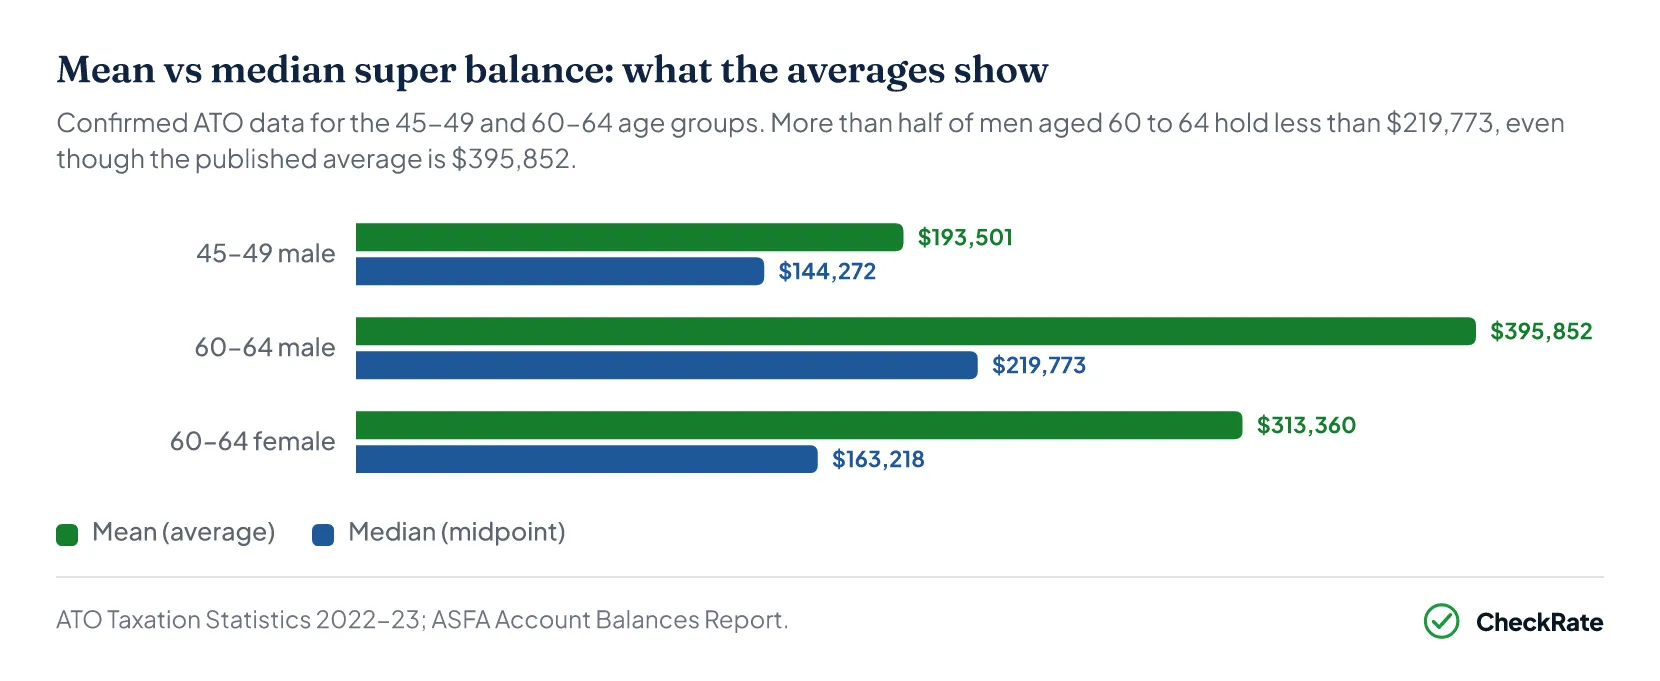
The ASFA Retirement Standard sets a benchmark of $630,000 for a single person to have a comfortable retirement. The average male super balance at ages 60 to 64 is 37% below that benchmark. The average female balance is 50% below.
Retirement balances vs ASFA comfortable standard
Average and median super balances at ages 60–64 vs $630,000 single comfortable standard
- Average male (60–64)$395,852
- Average female (60–64)$313,360
- Median male (60–64)$219,773
- Median female (60–64)$163,218
— ASFA comfortable (single): $630,000
Source · ASFA Retirement Standard, December quarter 2025 · from www.superannuation.asn.au
Source · ATO Taxation Statistics: average superannuation balances by age group and gender, 2022-23 · from www.ato.gov.au
The drawdown phase, when super is converted into a regular income stream, carries its own risks. Treasury reported that 84% of pension account assets were held in account-based or allocated pensions rather than fixed income products. This exposes retirees to sequencing risk: a significant market downturn early in the drawdown phase can reduce the balance more quickly, because assets are being withdrawn at the same time values are falling.
There is also a common estate planning gap. Super Consumers Australia research found that 6.5 million Australians had not told their super fund who should receive their money when they die. Super does not automatically go to the estate, so without that nomination, the distribution can be delayed or disputed.
What is the average superannuation balance in Australia?
At ages 60 to 64, the average (mean) super balance is $395,852 for men and $313,360 for women (2022-23, the most recent figures by age and gender). These are mean balances, pulled upward by a small number of very high-balance holders. The median — where half hold more and half hold less — is $219,773 for men and $163,218 for women. For most people, the median is the more relevant comparison.
Is the average super balance enough to retire comfortably?
The ASFA Retirement Standard says a single person needs $630,000 for a comfortable retirement, and a couple needs $730,000. The average male super balance at ages 60 to 64 is 37% below the single-person figure. The average female balance is 50% below. Around 30% of Australians retire with enough to meet this standard. Most retire on a combination of super payments and the Age Pension.
Why is the median so much lower than the average?
Because super wealth is concentrated at the top. Treasury estimated that fewer than 80,000 people would have super balances above $3 million in 2025–26, with some balances well above $5 million.
These very large balances push the mean up without affecting the median, which reflects the midpoint of the distribution. The gap widens with age as high earners use salary sacrificing and concessional contributions to accumulate well beyond what compulsory SG contributions alone would produce.
Section 07 · Gender gap
The gender gap in super savings across a working life
The gap in super balances between men and women starts at $899 at ages 18 to 24 and reaches $82,492 by ages 60 to 64. It widens across every age group in the latest available data.
This is the long-term result of a system where Superannuation Guarantee contributions are tied to paid hours of work. It does not account for the unpaid work that leads many women to reduce or pause paid employment at different points in their lives.
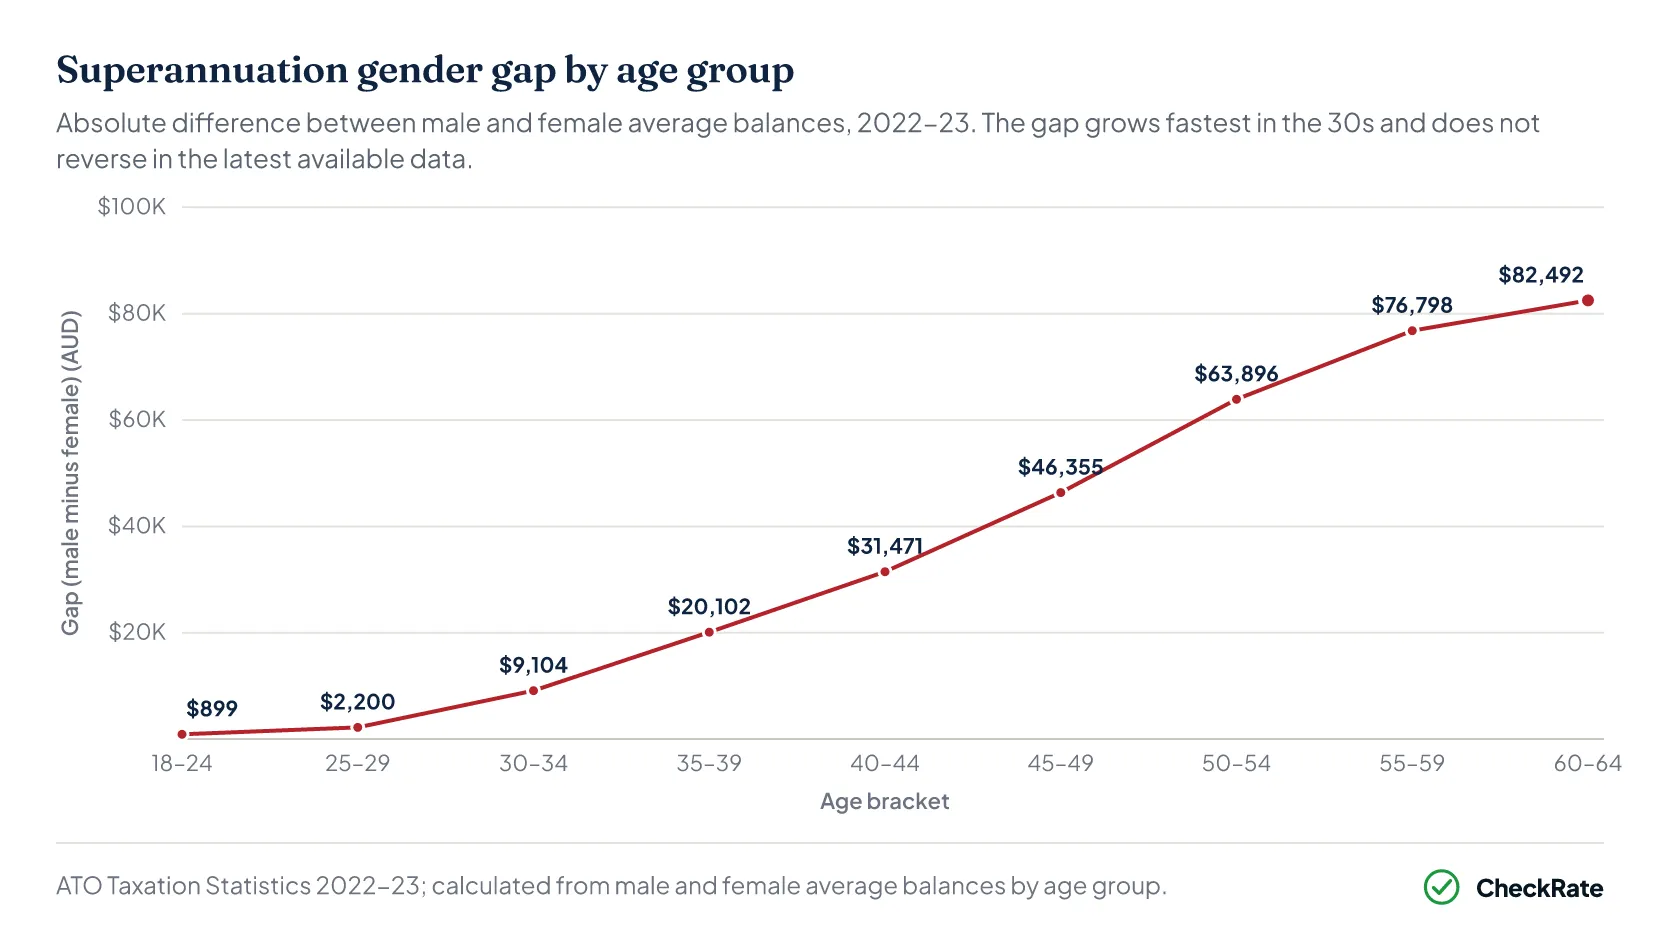
Several factors contribute to the gap across a working life:
- In the twenties, women are more likely to work in lower-paid, casual roles.
- In the thirties, career breaks for parenting pause SG contributions at the most critical point for long-term compounding.
- In the forties, part-time work reduces SG contributions proportionally, while men in full-time roles keep building their balances at full pace.
- Relationship breakdown in the forties, which more often leaves women as single parents, makes it harder to put anything extra into super.
Recent reforms have reduced some structural gaps:
- From July 2022, employers must pay super on all earnings, no matter how small or how many jobs a person holds. This closed a gap that mainly affected women working across multiple part-time roles.
- From July 2025, super is paid on government-funded parental leave for the first time, helping workers who take career breaks in the years ahead.
Neither change affects balances already accumulated by women in mid-career. For those workers, the gap may narrow only gradually, depending on future earnings, contributions and time in the workforce.
Section 08 · Wealth and liquidity
Household net worth doubled while the saving ratio fell
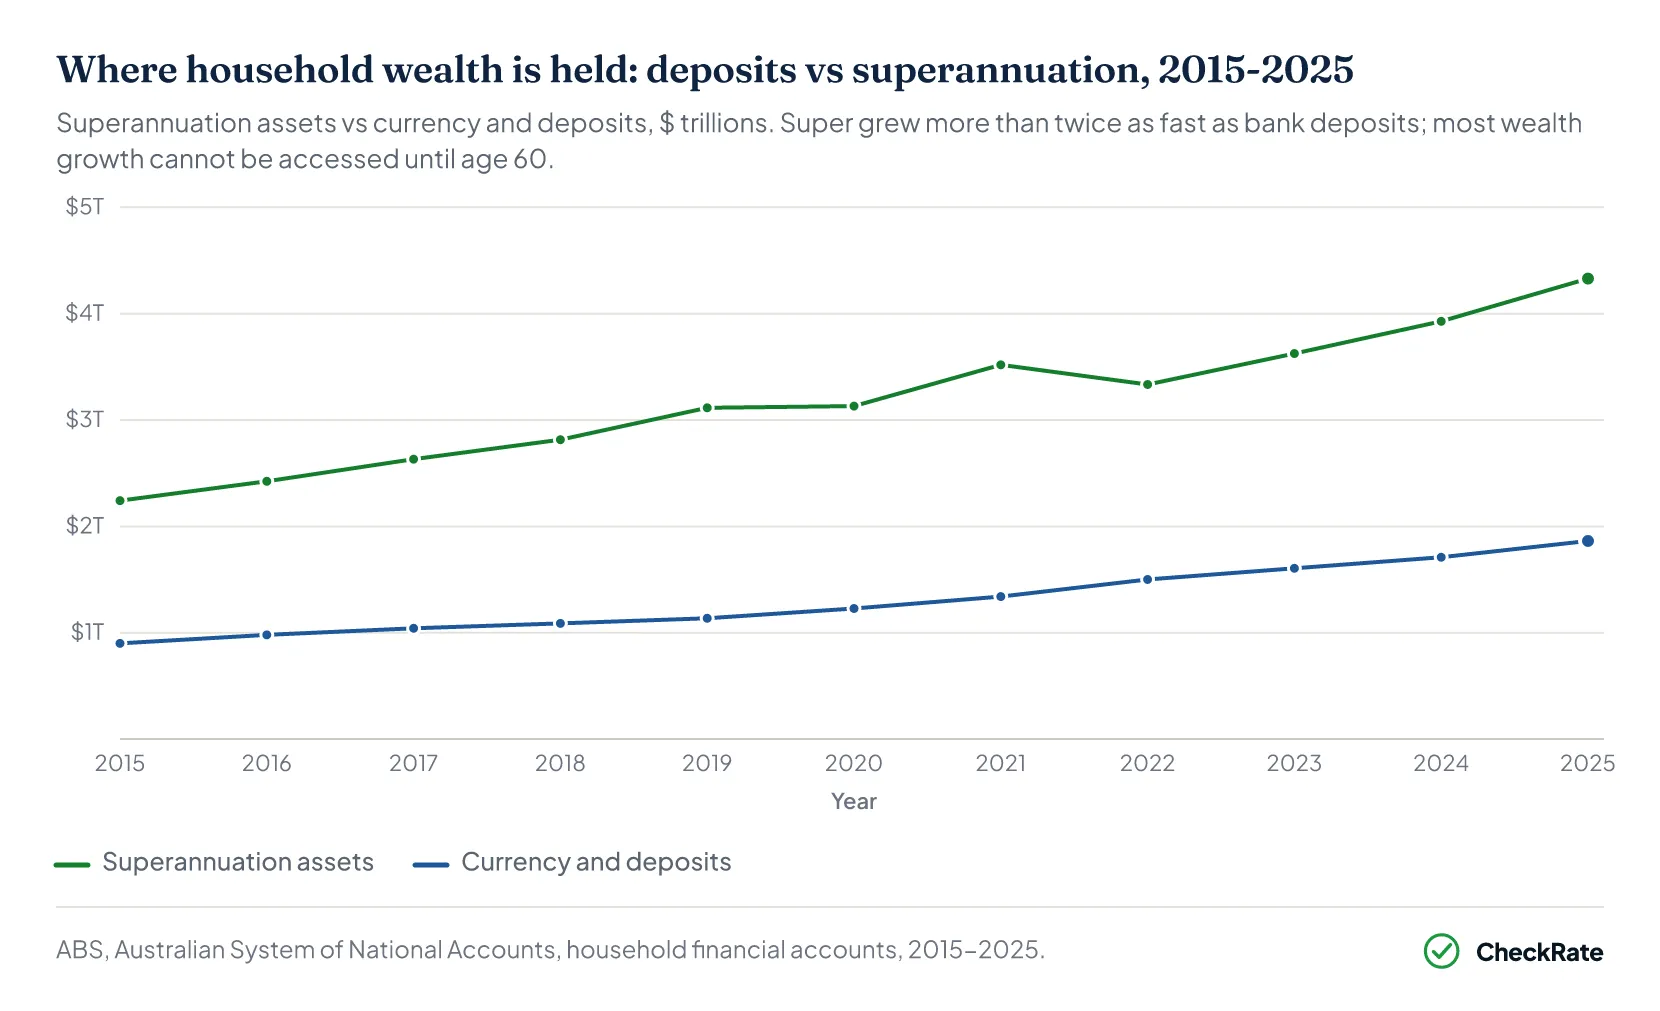
Household net worth grew from $8.5 trillion in 2015 to $17.9 trillion by 2025, more than doubling in a decade. Over the same period, the household saving ratio fell from 7.4% to a low of 3.0% and only partially recovered. Australians became collectively wealthier than at any point in recorded history while setting aside a smaller share of income.
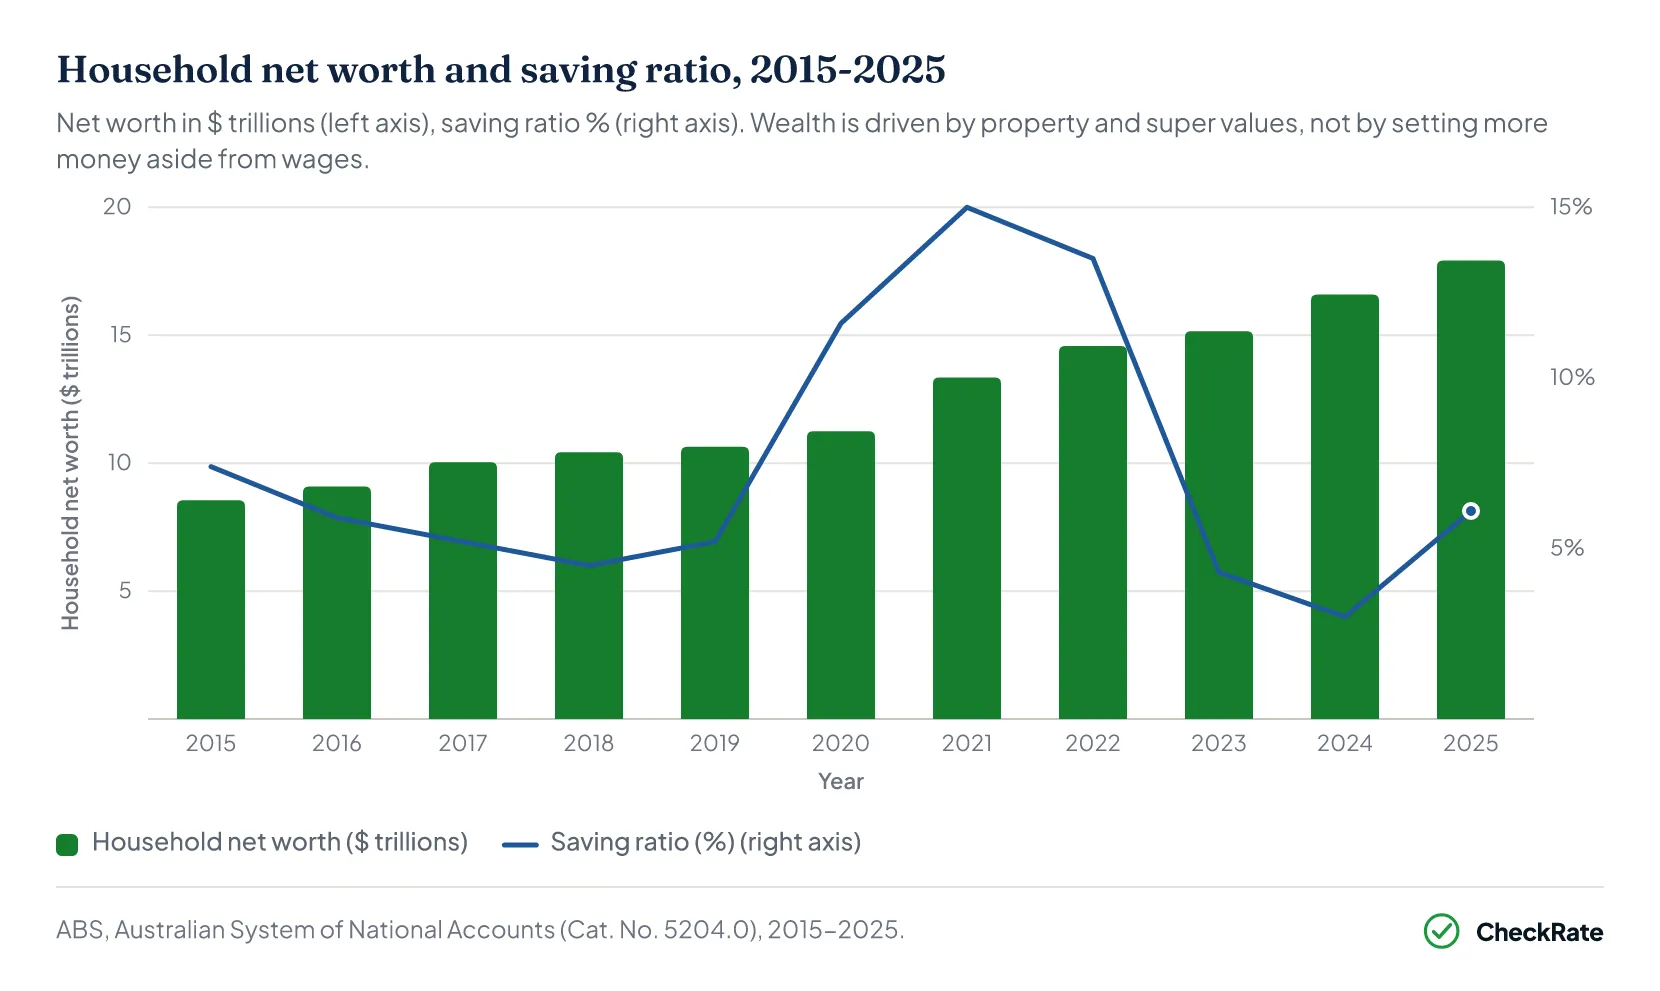
This is not a contradiction. It reflects the difference between wealth and liquid savings.
Property values rose sharply, particularly during the pandemic, adding trillions to the paper wealth of homeowners. Super balances also grew with rising investment markets.
But neither form of wealth is easy to spend. Property cannot be sold overnight, and super is locked away until age 60. Someone who cannot save anything from their weekly wages is not contradicting the record net worth figure. They simply do not hold their wealth in a form that helps with everyday expenses.
The household debt-to-income ratio tells a similar story. It peaked at 199.7% in 2018 and has stayed above 190% ever since, sitting at 193.1% in 2025.
Australian households carry more debt relative to their income than at almost any point on record, even as property values have risen. The combination of high paper wealth, large debts, and little accessible savings is exactly what makes finances fragile when incomes fall or interest rates rise quickly.
How do super balances compare by age?
The tool below shows how a super balance compares with the group average for a selected age group and gender. Figures cover super only, not savings in bank accounts or other assets. The published averages are pulled upward by a smaller number of very large balances, so many people will sit below the mean.
Super balance comparison calculator
Compare a super balance with the average and median for your age and gender, from ATO data.
These figures are averages across workers in each age group. Many people in their thirties and forties may sit below the figures shown because early withdrawals, part-time work and career breaks are common.
Being below the group average does not necessarily mean a super balance is inadequate. Many workers who rely mainly on mandatory employer contributions will sit below the mean, which is pulled up by very large balances. Additional contributions, where made, can affect balances over time, but outcomes vary by income, employment history and investment returns.
References
- ABS Australian System of National Accounts (cat. 5204.0), 2015-2025 · Australian Bureau of Statistics
- APRA superannuation statistics, March 2026 · apra.gov.au
- Australian Treasury, Retirement phase of superannuation: Discussion paper, December 2023 · treasury.gov.au
- ASFA Retirement Standard, December quarter 2025 · superannuation.asn.au
- Australian Treasury, Better targeted superannuation concessions: factsheet, 2023 · treasury.gov.au
- ATO Taxation Statistics: average superannuation balances by age group and gender, 2022-23 · ato.gov.au
- ASFA, An update on superannuation account balances, August 2024 · superannuation.asn.au
- Australian Treasury, 2023 Intergenerational Report · treasury.gov.au
- RBA / APRA Housing Lending Rates (F6), data to April 2026 · Reserve Bank of Australia
- ATO, COVID-19 early release of super: scheme statistics, April-December 2020 · ato.gov.au