


Published
 What is the average tax refund in Australia?The mean refund of $3,052 is pulled upwards by a small number of large refunds, while the median refund was $1,609: more than half of all refunds were under $2,000. Both figures relate to individual i…
 Australian income tax brackets: the full history since 1983The 2026–27 scale changed in one respect from 1 July 2026. The rate on income between $18,201 and $45,000 fell from 16% to 15% on 1 July 2026 under the Treasury Laws Amendment (More Cost of Living Rel…
 The new $1,000 tax deduction: how the standard deduction worksThe standard deduction is applied automatically for eligible taxpayers, up to $1,000, and is reduced dollar for dollar by any covered work-related expenses they itemise in their return. A new section…
Section 01 · The headline number
What is the average income tax paid in Australia?
The median net tax bill was substantially lower than the average. The median taxable individual paid $14,993 for 2023–24, about 60% of the $24,888 average, because very large bills at the top pull the average up.1 Both figures describe only the individuals who had net tax to pay: 13,239,911 of the 16,584,287 who lodged a 2023–24 return, or 79.8% (derived by dividing 13,239,911 by 16,584,287). The remaining 3.3 million lodgers, about one in five, had no net tax recorded for the year.
Altogether, those 13.2 million taxpayers were assessed $329.5 billion of net tax on 2023–24 returns.1 The sections below show how that net tax was distributed across income groups and how the average has changed over time.
| Average and median tax and income, Australia, 2023–24 | |||
|---|---|---|---|
| Measure | Average | Median | Population |
| Net tax paid | $24,888 | $14,993 | 13,239,911 taxable individuals |
| Taxable income | $78,127 | $58,739 | All 16,584,287 individuals who lodged |
| Total income | $81,828 | $61,950 | All 16,584,287 individuals who lodged |
Source · ATO Taxation statistics 2023–24, Individuals Table 1B.
Section 02 · By tax bracket
Net tax paid by taxable income range
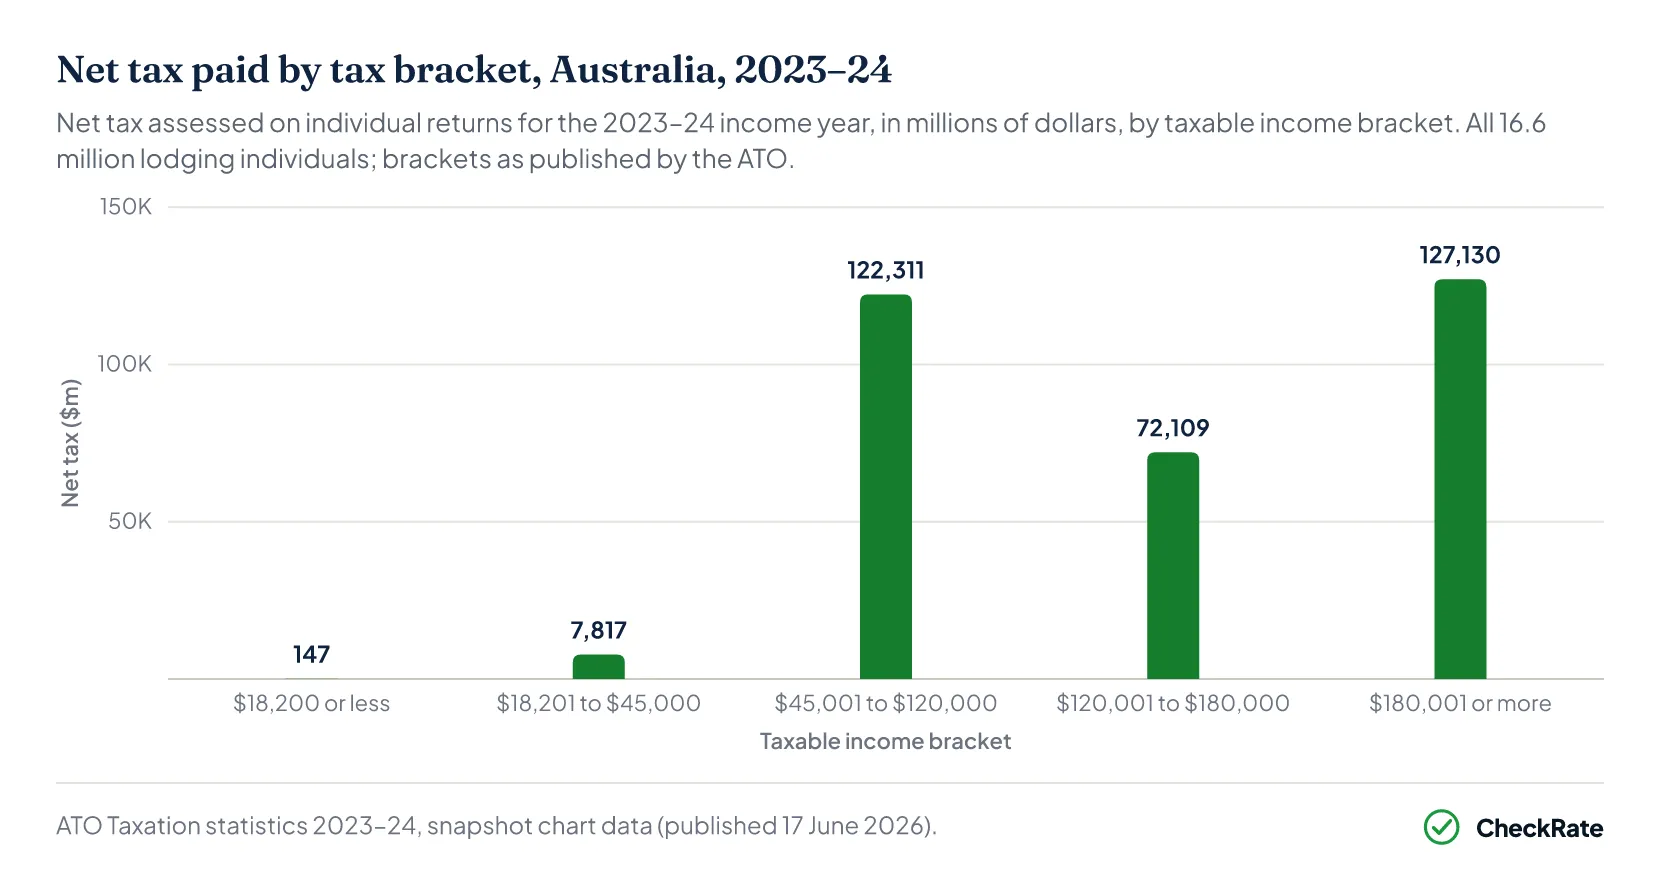
The $45,001 to $120,000 range accounted for 45% of all 16.6 million individuals who lodged a return in 2023–24. Those individuals paid $122.3 billion in net tax, or 37.1% of all net tax.2 The 6% of individuals above $180,000 paid 38.6% of all net tax, while the 14.5% at or below the $18,200 tax-free threshold contributed 0.04% (derived by dividing $147m by $329,514m).
Section 03 · Effective rates
What effective tax rate do different income bands pay?
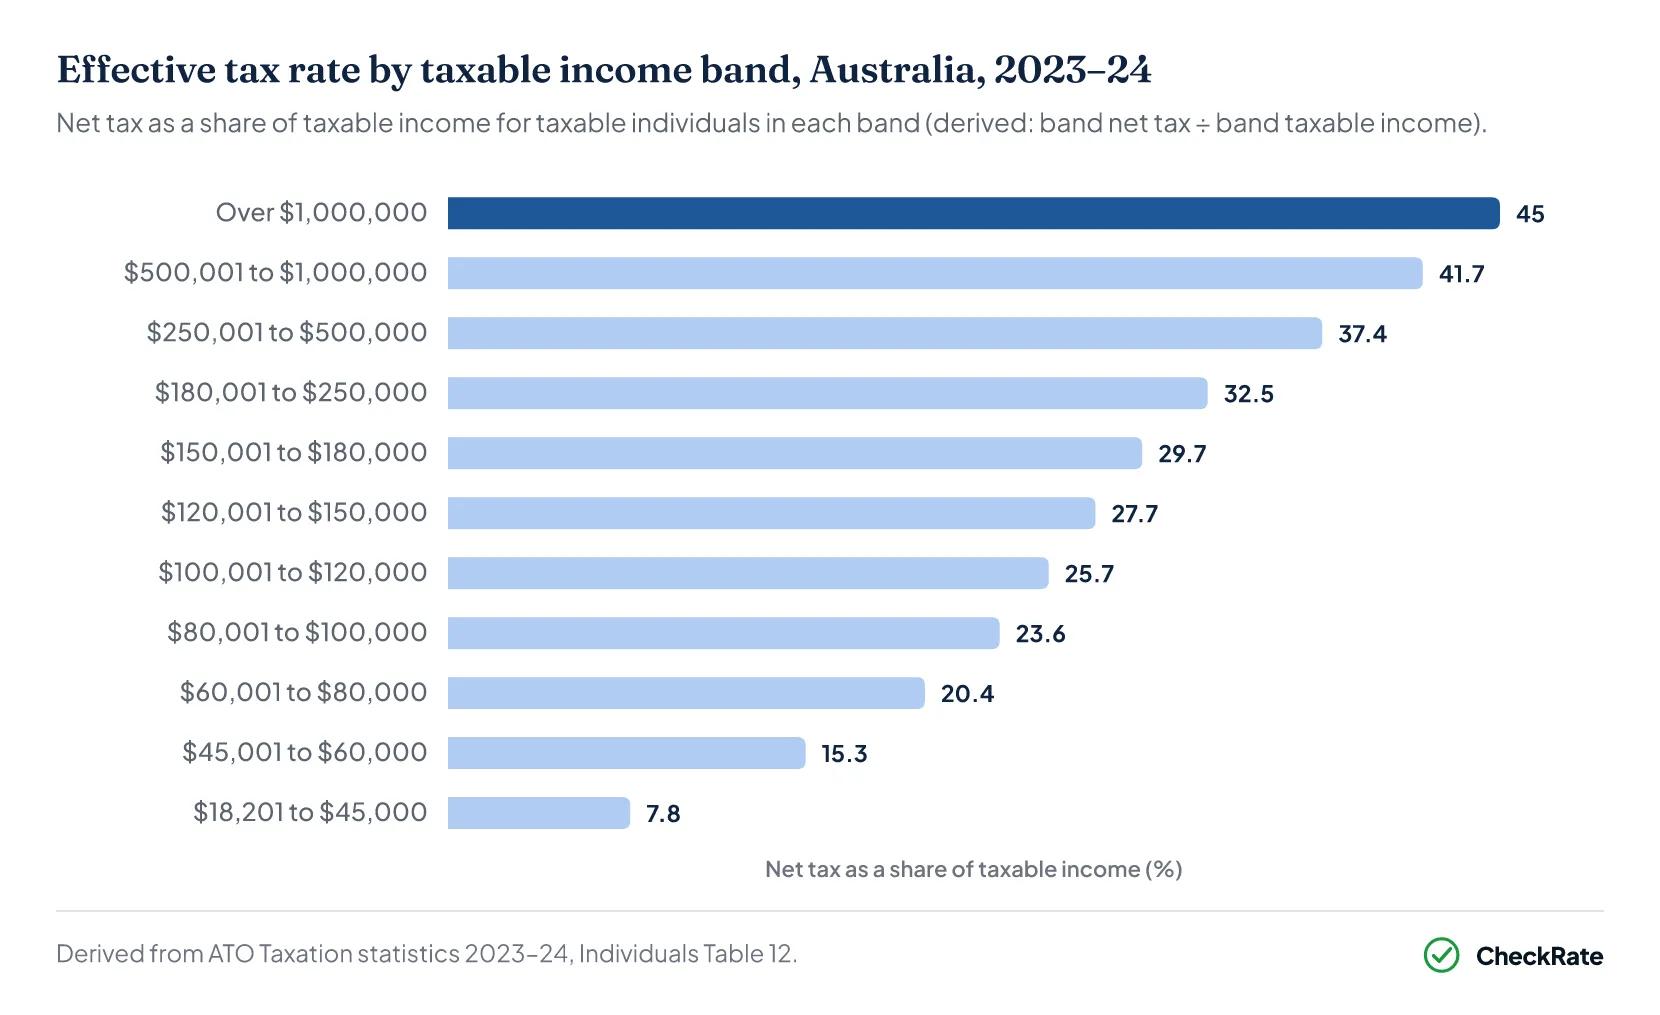
An effective tax rate compares tax paid with income, while a marginal tax rate applies to the relevant portion of taxable income. The band rates in the chart are derived from the ATO's taxable-income table: each band's total net tax divided by its total taxable income.3 For the $80,001 to $100,000 band, the derived effective rate was 23.6%. The marginal rate applying to income in that range in 2023–24 was 32.5%, while an individual's effective rate also depended on the rates applying to lower portions of income and on their broader tax position, including offsets and the Medicare levy.
Section 04 · Who pays the tax
Which income groups pay the largest share of income tax?
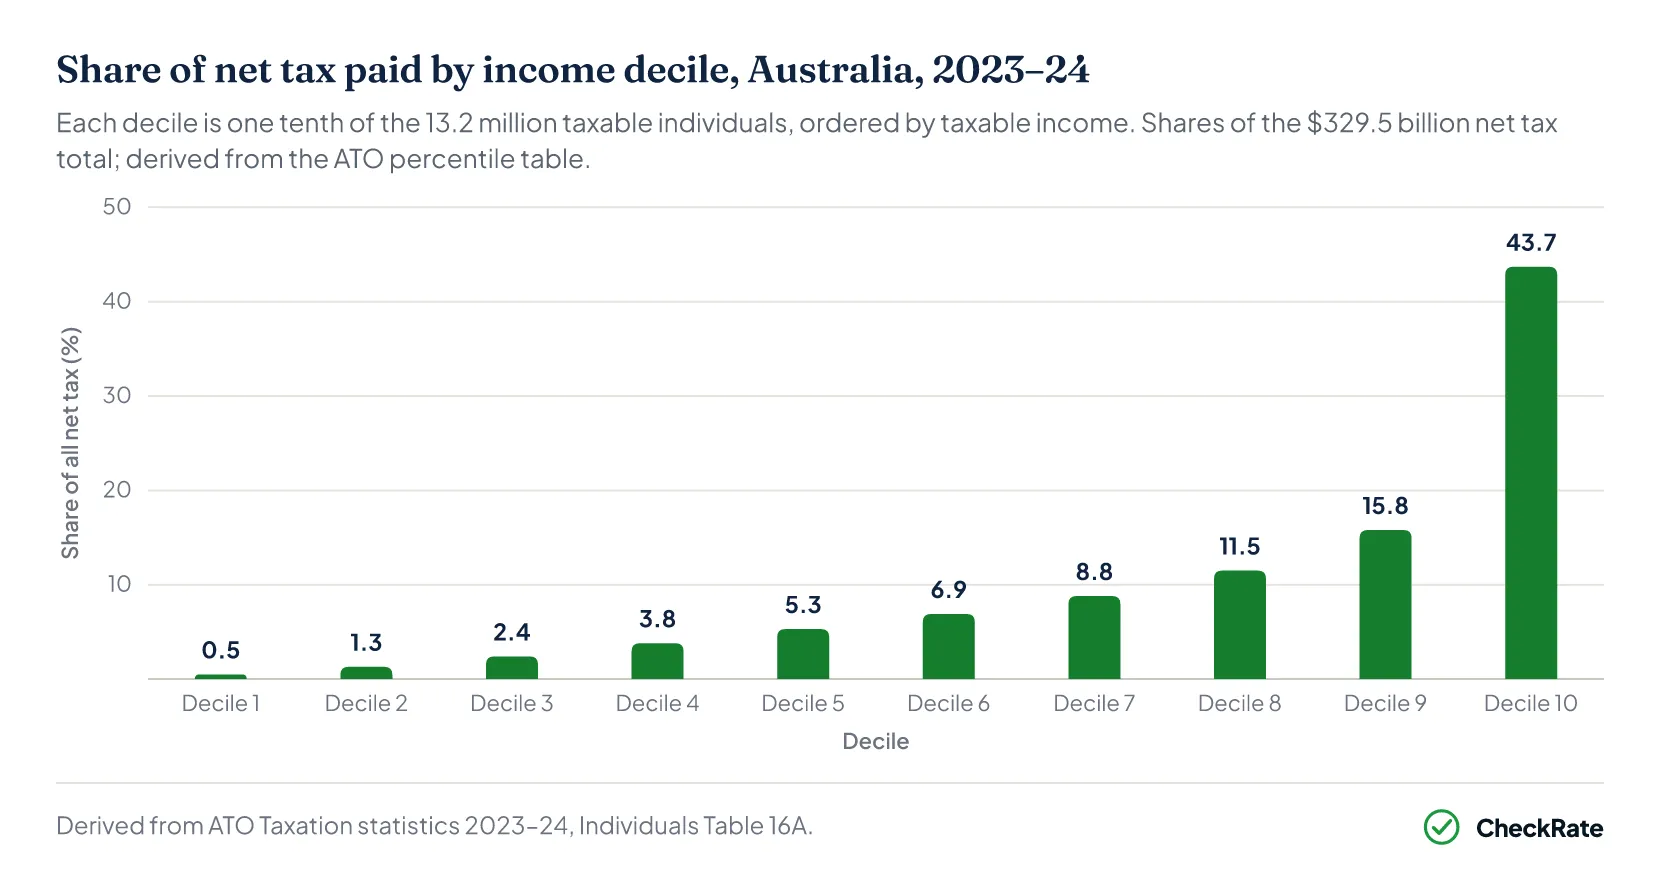
Income tax is concentrated near the top. With the 13.2 million taxable individuals split into ten equal groups, the top decile paid $144.1 billion of the $329.5 billion in net tax, and the top 1% alone, with taxable incomes of $429,531 or more, paid 16.8% of all net tax at an average of about $418,000 each.4 The top 10% began at a taxable income of $162,972, while the 50th percentile fell within the $70,664 to $71,795 income range.
Section 05 · Income vs tax
How does tax paid differ from taxable income and total income?
The three headline numbers describe different bases. Total income averaged $81,828 across all individuals who lodged a return, while taxable income averaged $78,127 across the same population of 16.6 million.1 Net tax averaged $24,888 across the narrower population of 13.2 million taxable individuals with net tax above zero. On that narrower population, taxable income averaged about $95,015. This is derived by dividing the $1.258 trillion in taxable income reported in the percentile table by 13,239,911 taxable individuals. The $24,888 average bill and the $78,127 all-lodger average income therefore do not describe the same population.
Across taxable individuals as a group, net tax was equal to about 26 cents for every dollar of taxable income for 2023–24. This is derived by dividing $329.5 billion in net tax by $1.258 trillion in taxable income, giving an effective rate of 26.2%.
The brackets each dollar fell into are tabled in the income tax brackets reference; how assessments settle into refunds or bills is covered in the average tax refund article.
Section 06 · Medicare levy
How much Medicare levy is paid on average?
The Medicare levy is charged separately from the individual income tax scale, so it sits on top of the rates most bracket tables show. For 2023–24, 11,545,117 individuals paid it, at an average of $2,017 and a median of $1,554, totalling $23.3 billion.1
A further 885,087 individuals paid the Medicare levy surcharge, which applies to higher-income individuals without private hospital cover, averaging $1,284.1 The amount of Medicare levy paid by an individual varies with income and their broader tax position, including the low-income thresholds that can reduce or remove the levy.
Section 07 · The trend
How has average income tax paid changed over time?
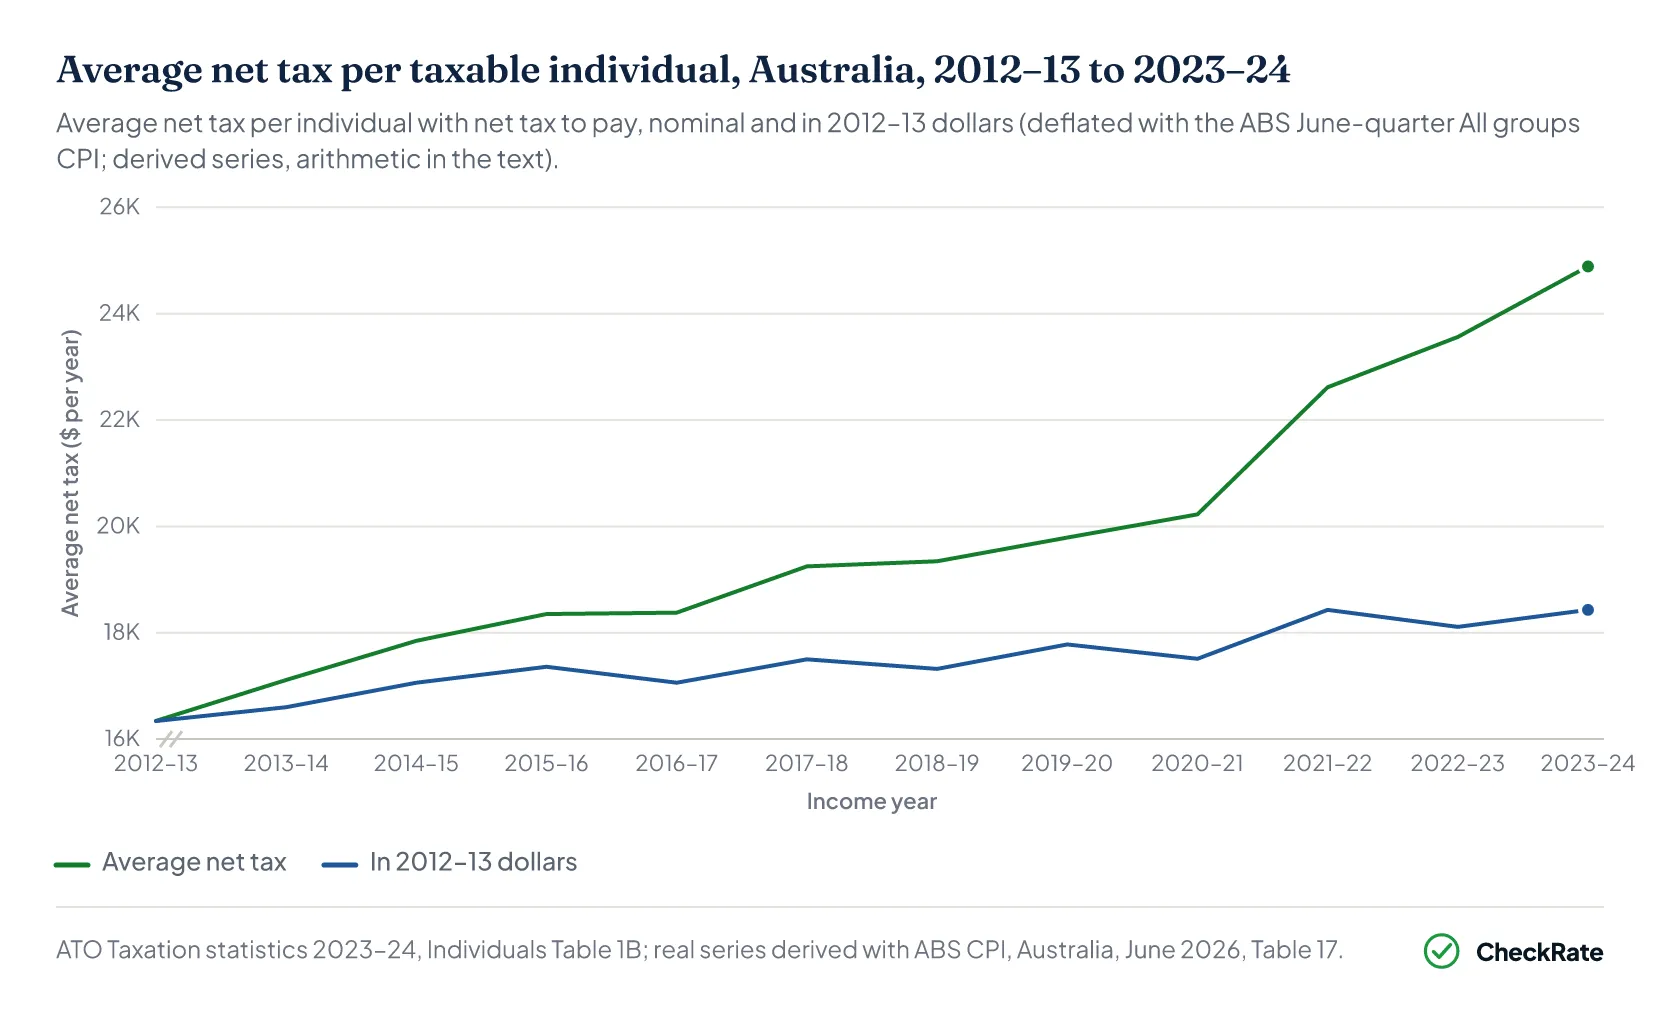
Average net tax rose from $16,342 in 2012–13 to $24,888 in 2023–24, an increase of 52.3%. On the ATO's consistent processing basis, average net tax increased in every year of the series, and the number of taxpaying individuals grew from 9.5 million to 13.2 million.1
After adjusting for inflation, the 2023–24 average of $24,888 is equivalent to about $18,430 in 2012–13 dollars. This is derived by multiplying $24,888 by the 2012–13 CPI value of 71.38 and dividing by the 2023–24 value of 96.41. That represents a real increase of about 12.8% over eleven years.5
Section 08 · FAQ
Average tax paid: quick answers
How much income tax does the average Australian pay?
Individuals who paid net tax for 2023–24 paid an average of $24,888, across 13.2 million taxable individuals whose returns were processed by 31 October 2025. The median was $14,993, so the median taxable individual paid substantially less than the average.
Why is the median tax paid so much lower than the average?
Net tax is concentrated among higher-income taxpayers. The median taxpayer paid $14,993 for 2023–24 while the average was $24,888; the top 1% of taxable individuals paid an average of about $418,000 each, based on the ATO percentile table, and such bills help lift the overall average above the median.
How much is the Medicare levy on average?
For 2023–24, 11.5 million individuals paid the Medicare levy, at an average of $2,017 and a median of $1,554. The levy is separate from the rates in the individual income tax scale and is included in net tax.
Is the average income tax bill rising faster than inflation?
Mostly yes. Average net tax rose from $16,342 in 2012–13 to $24,888 in 2023–24, an increase of 52.3%, on the ATO's consistent processing basis. After adjusting for inflation using the ABS June-quarter consumer price index, that was an increase of about 12.8% in real terms over the eleven years.
References
- ATO, Taxation statistics 2023–24, Individuals Table 1: selected items by year (Tables 1A and 1B) · data.gov.au ↑ b c d e f
- ATO, Taxation statistics 2023–24, Snapshot chart data · data.gov.au ↑
- ATO, Taxation statistics 2023–24, Individuals Table 12: taxable status, residency and taxable income range · data.gov.au ↑
- ATO, Taxation statistics 2023–24, Individuals Table 16A: percentile distribution of taxable individuals · data.gov.au ↑
- ABS Consumer Price Index, Australia (latest release, Cat. 6401.0) · Australian Bureau of Statistics ↑
- ATO, Taxation statistics 2023–24, Snapshot data tables (all summary tables) · data.gov.au