


Published
Section 01 · The headline number
What is the average Australian tax refund?
The mean refund of $3,052 is pulled upwards by a small number of large refunds, while the median refund was $1,6091: more than half of all refunds were under $2,000. Both figures relate to individual income tax returns for the 2023–24 income year, based on returns the ATO processed by 31 October 2025.
Refunds are also much smaller than tax bills. The 3.8 million returns assessed as payable owed an average of $10,362 with a median of $2,159. The $39.1 billion assessed as payable on these returns was slightly higher than the $35.8 billion assessed as refundable1. Netted across the 15.5 million assessments that resulted in either a refund or a tax bill, individuals as a group owed $3.3 billion more than they were refunded, the first net-payable year in the published 12-year series.
| Individual assessment outcomes · 2023–24 | ||||
|---|---|---|---|---|
| Outcome | Individuals | Average | Median | Total |
| Refund (tax refundable) | 11,735,606 | $3,052 | $1,609 | $35.82b |
| Tax bill (tax payable) | 3,776,084 | $10,362 | $2,159 | $39.13b |
| No refund or bill | 1,072,597 | na | na | na |
| All returns assessed | 16,584,287 | na | na | net +$3.31b payable |
Source · ATO Taxation statistics 2023–24, Individuals Tables 1B and 13.
Section 02 · Refund share
How many individual tax returns result in a refund?
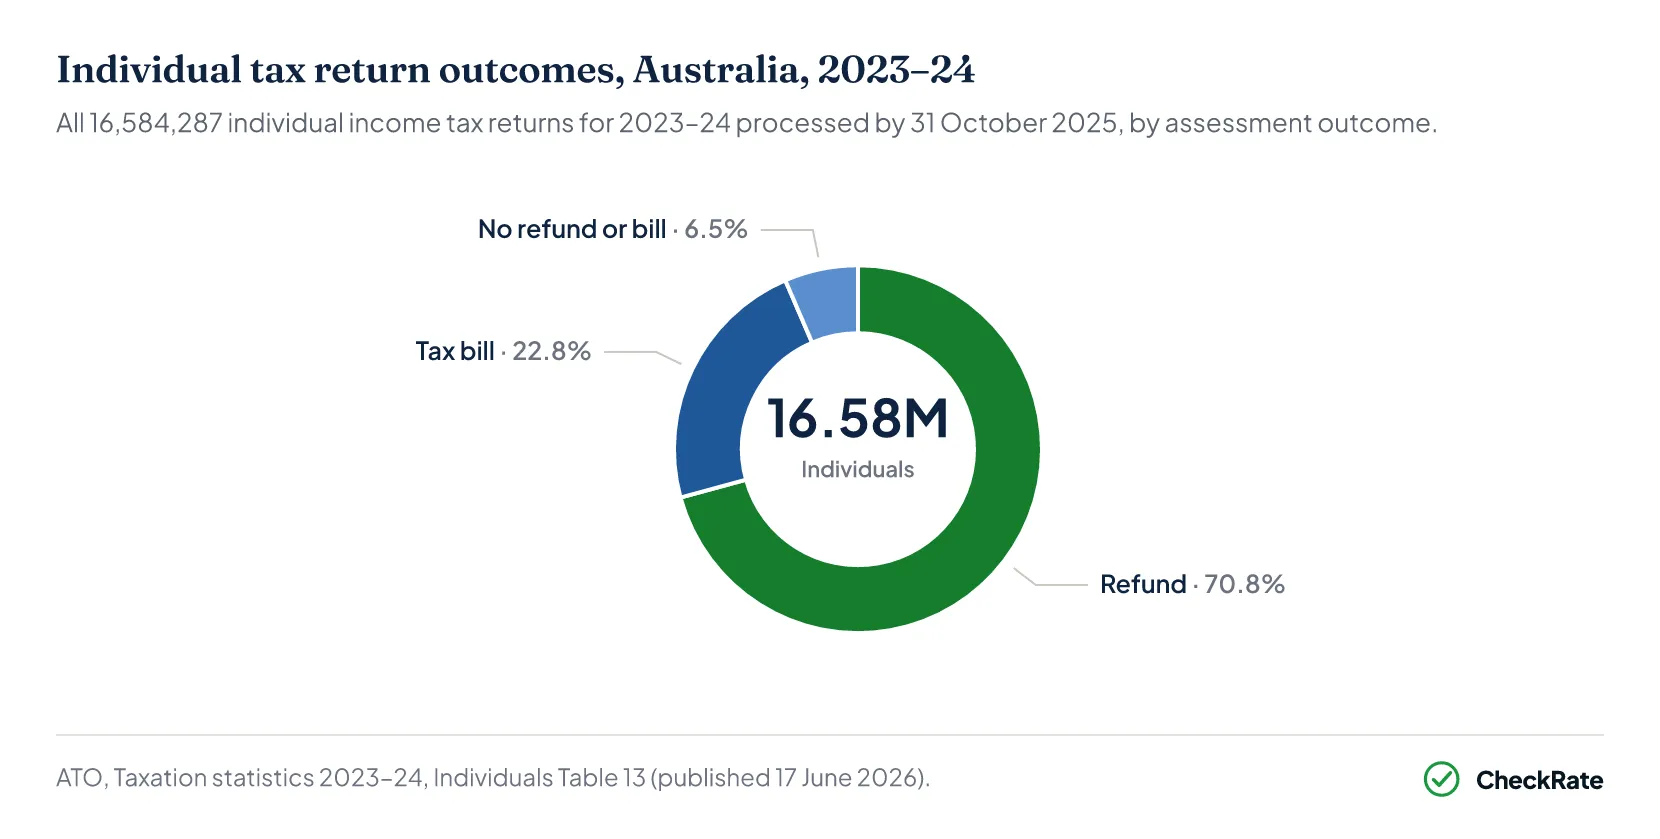
Of the individual 2023–24 returns processed by 31 October 2025, 70.8% resulted in a refund, or 11,735,606 of 16,584,2872. Another 22.8% resulted in a tax bill, while 6.5%, or 1.1 million, resulted in neither a refund nor an amount owing.
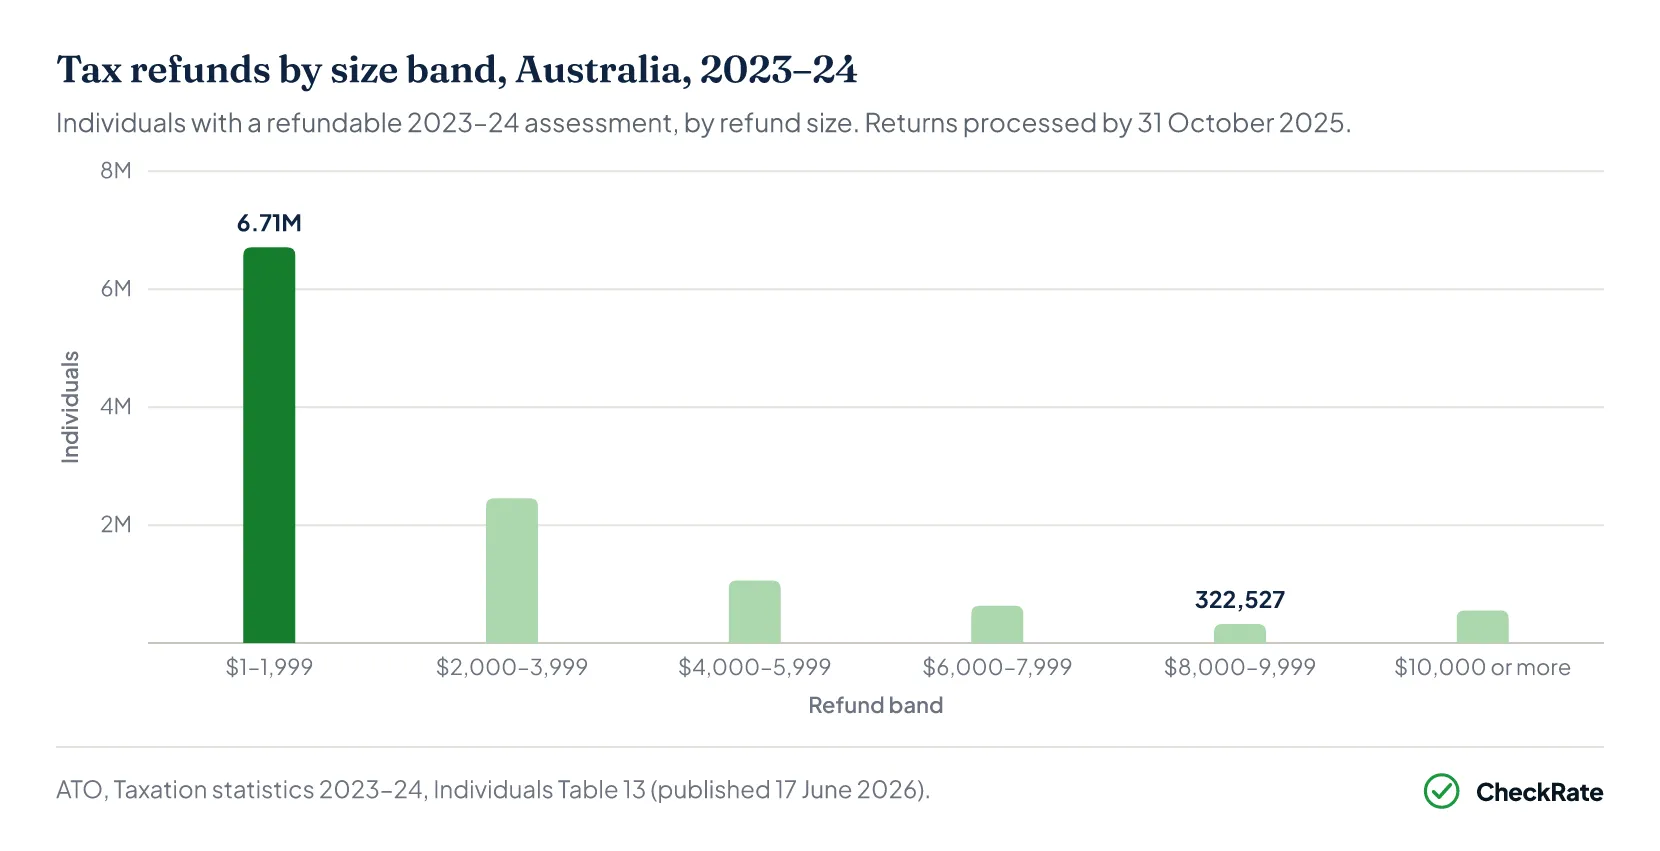
Most refunds were under $2,000. The $1 to $1,999 band accounted for 6,710,981 refunds, or 57.2% of all refunds and 40.5% of all individuals assessed2. At the other end, 2.57 million people received refunds of $4,000 or more, representing 21.9% of those refunded. This included 553,245 refunds of $10,000 or more.
| Refunds by size band · 2023–24 | ||
|---|---|---|
| Refund band | Individuals | Share of refunds |
| $1 – $1,999 | 6,710,981 | 57.2% |
| $2,000 – $3,999 | 2,454,863 | 20.9% |
| $4,000 – $5,999 | 1,060,967 | 9.0% |
| $6,000 – $7,999 | 633,023 | 5.4% |
| $8,000 – $9,999 | 322,527 | 2.7% |
| $10,000 or more | 553,245 | 4.7% |
Source · ATO Taxation statistics 2023–24, Individuals Table 13.
Section 03 · By income
Average tax refunds by income range
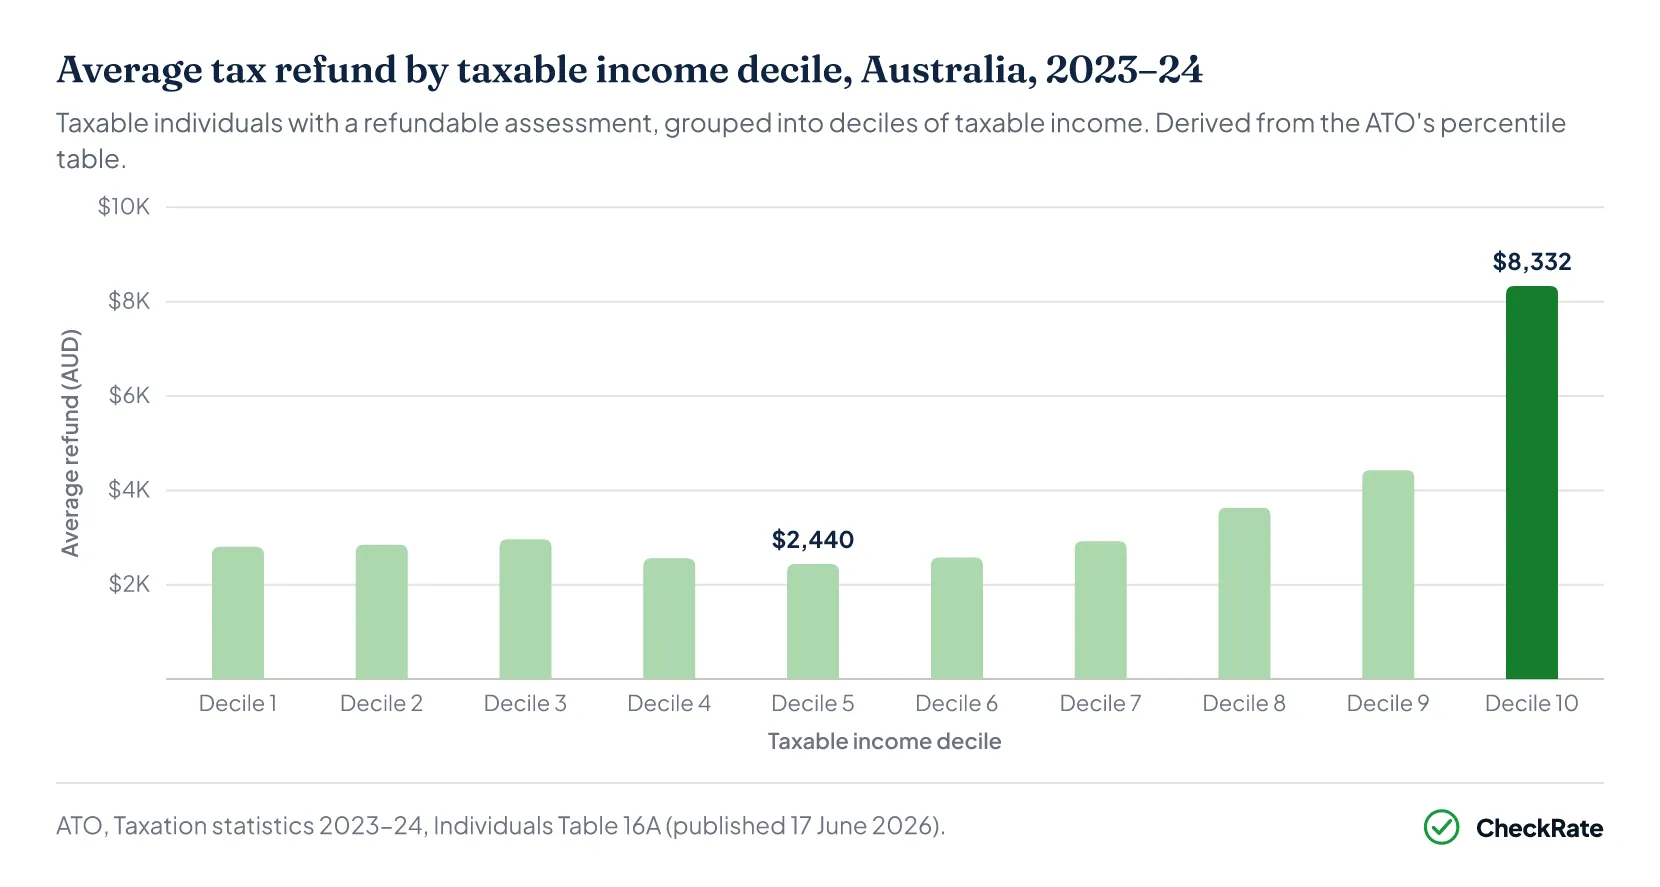
Average refund amounts are lowest around the middle of the taxable income distribution and rise sharply in the highest income deciles. Across the three lowest deciles, average refunds range from $2,804 to $2,963 before falling to $2,440 in the fifth decile, then rising to $4,429 in the ninth decile and $8,332 in the tenth3. The share of individuals receiving a refund moves in the opposite direction, falling steadily from about four in five at the bottom of the distribution to just over half in the top decile.
Assessment outcomes at the top are larger in both directions. The same top decile that averaged an $8,332 refund also produced the largest tax bills, averaging $42,173 among those owing. This is consistent with larger balancing adjustments in both directions3.
| Refunds by taxable income decile · taxable individuals, 2023–24 | |||
|---|---|---|---|
| Decile | Taxable income range | Share with a refund | Average refund |
| 1 | $32,645 or less | 79.9% | $2,804 |
| 2 | $32,646 – $42,390 | 79.3% | $2,850 |
| 3 | $42,391 – $51,602 | 77.9% | $2,963 |
| 4 | $51,603 – $61,261 | 76.1% | $2,560 |
| 5 | $61,262 – $71,795 | 72.8% | $2,440 |
| 6 | $71,796 – $84,285 | 71.5% | $2,577 |
| 7 | $84,286 – $100,177 | 70.0% | $2,923 |
| 8 | $100,178 – $121,836 | 68.8% | $3,634 |
| 9 | $121,837 – $162,971 | 67.4% | $4,429 |
| 10 | $162,972 or more | 52.6% | $8,332 |
Source · ATO Taxation statistics 2023–24, Individuals Table 16A.
Section 04 · The mechanics
What are the main reasons for a tax refund?
Australia's income tax is largely prepaid. Employers withheld $275.4 billion from the pay of 13.1 million people during 2023–24 under pay as you go (PAYG) withholding, while a further 1.7 million people paid $31.3 billion through PAYG instalments1. The notice of assessment then reconciles these prepayments and credits with net tax assessed, which totalled $329.5 billion across 13.2 million taxable individuals. When prepayments and refundable credits exceed the assessed tax liability, the difference is refunded4.
Withholding rates are set on standardised scales that do not account for a person's final tax position, so several situations can result in a refund:
- Deductions claimed at lodgment, including work-related expenses, donations and the cost of managing tax affairs, reduce taxable income after withholding has already been taken.
- Working for only part of the year can result in too much tax being withheld because withholding scales are based on each pay period rather than final annual income.
- Tax offsets may be applied by the ATO at assessment after lodgment rather than through regular pay5.
- Refundable credits, such as franking credits attached to dividends, can also result in a refund, even where little or no tax was withheld.
The ATO lists several reasons a tax bill can arise from the same reconciliation process, including insufficient withholding across multiple jobs, claiming the tax-free threshold with more than one employer, business or investment income without withholding, capital gains events, and study-loan repayments not fully covered by withholding6. A wider explanation of where refunds sit in the system is in how the Australian tax system works.
Section 05 · Deductions
How work-related deductions can affect refunds
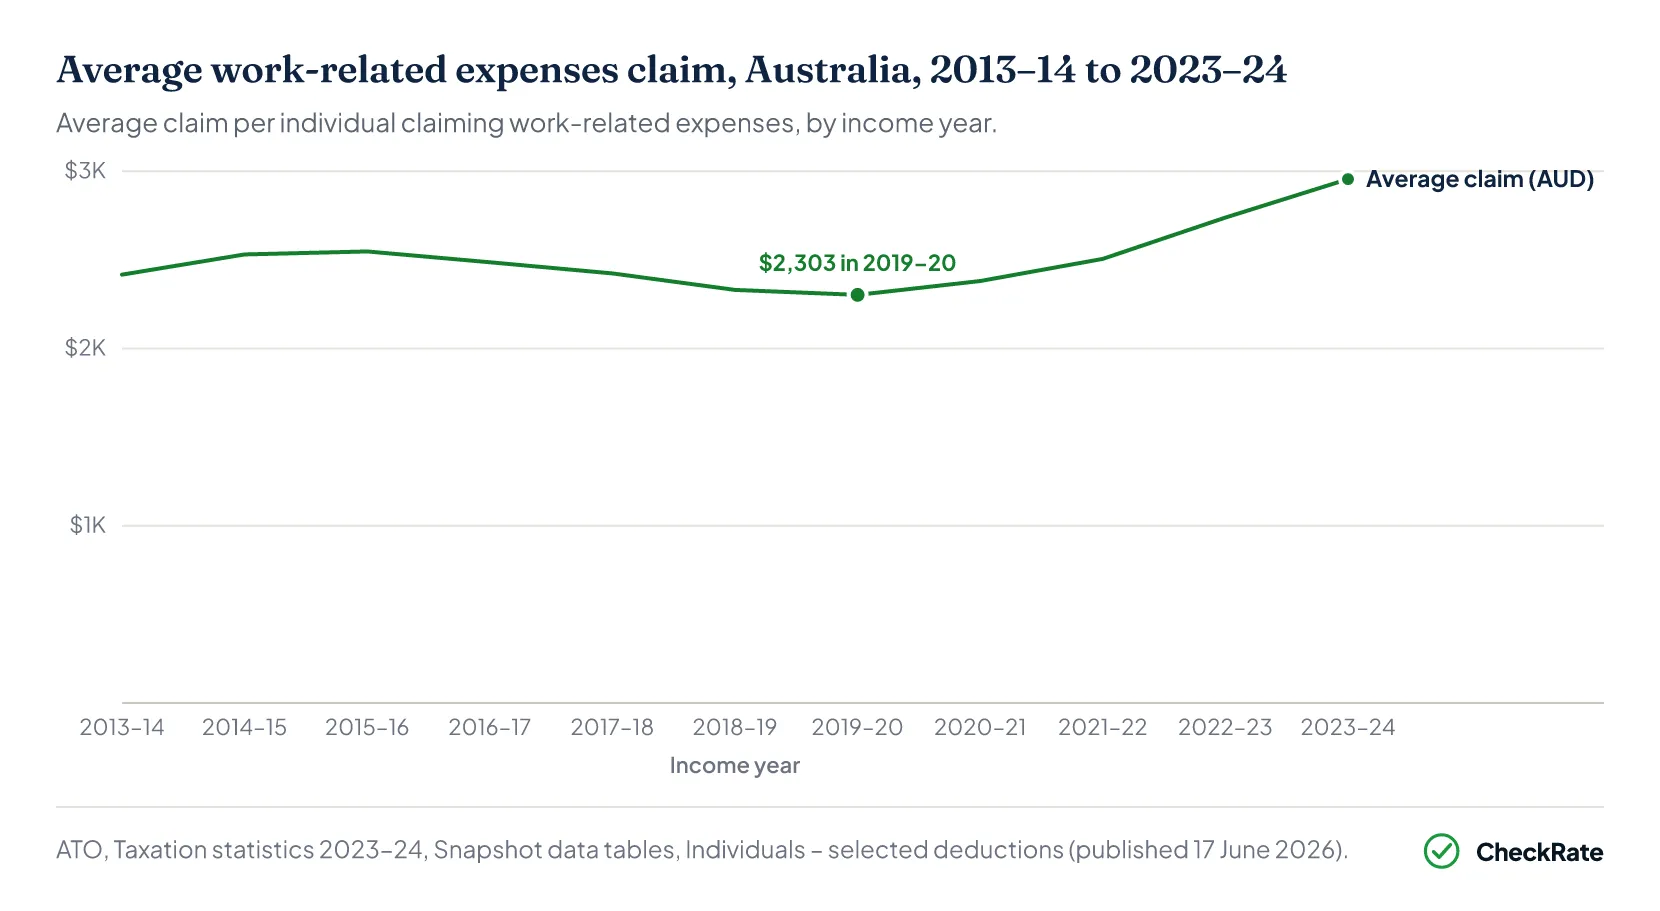
Work-related expenses are the largest deduction category claimed by individuals. For 2023–24, 10,678,121 people claimed work-related expenses, averaging $2,956 per claimant with a median of $1,4347. Their $31.6 billion total accounted for 53% of all deductions claimed by individuals8. Total deductions of all kinds came to $59.1 billion1.
The average work-related expense claim rose by $653, or 28%, over the four years from its $2,303 low in 2019–20, after holding between $2,303 and $2,548 across the seven years to 2019–207.
A deduction does not reduce tax by the full amount claimed. Instead, it reduces taxable income, so the effect on the final tax assessment depends on the tax rate that would otherwise apply to that income and the person's broader tax position. The exact rates and thresholds, and how they have moved, are tabled in the full history of Australian income tax brackets.
| Average work-related expenses claim by income year | |
|---|---|
| Income year | Average claim |
| 2013–14 | $2,417 |
| 2014–15 | $2,531 |
| 2015–16 | $2,548 |
| 2016–17 | $2,487 |
| 2017–18 | $2,424 |
| 2018–19 | $2,331 |
| 2019–20 | $2,303 |
| 2020–21 | $2,381 |
| 2021–22 | $2,506 |
| 2022–23 | $2,739 |
| 2023–24 | $2,956 |
Source · ATO Taxation statistics 2023–24, Snapshot data tables, Individuals – selected deductions.
Section 06 · Refunds vs tax paid
Does a bigger tax refund mean less tax was paid?
A tax refund and the amount of tax paid measure different things. A refund arises when tax paid during the year and refundable credits exceed the final assessed liability, while the final tax assessment reflects the tax liability itself. In 2023–24 both rose together: the average refund increased from $2,948 to $3,052 while average net tax per taxable individual increased from $23,562 to $24,8887.
A person who receives a refund can still pay more tax overall than someone who receives no refund. The $35.8 billion refunded in 2023–24 sat alongside $329.5 billion in net tax assessed1 across taxable individuals.
The system-wide balance can also shift towards tax bills even when average refunds increase. Across 15.5 million assessments that resulted in either a refund or a tax bill, 2023–24 netted to $3.3 billion payable, the first net-payable result in the 12-year published series. In 2022–23 the net position was $1.5 billion refundable1.
What individuals actually pay, and how that differs from what the brackets imply, is covered in how much income tax the average Australian actually pays.
Section 07 · The long run
How has the average tax refund changed over time?
From 2012–13 to 2017–18 the average refund remained between $2,495 and $2,574. It then rose to $2,959 in 2018–19, an increase of $405, or 15.9%, from the previous year. The average remained close to $3,000 and peaked at $3,221 in 2021–22 before falling $273 to $2,948 in 2022–231.
The total refunded followed the same shape, jumping from $27.8 billion in 2017–18 to $34.6 billion in 2018–19 and peaking at $39.2 billion in 2021–221 on the ATO's consistent processing basis.
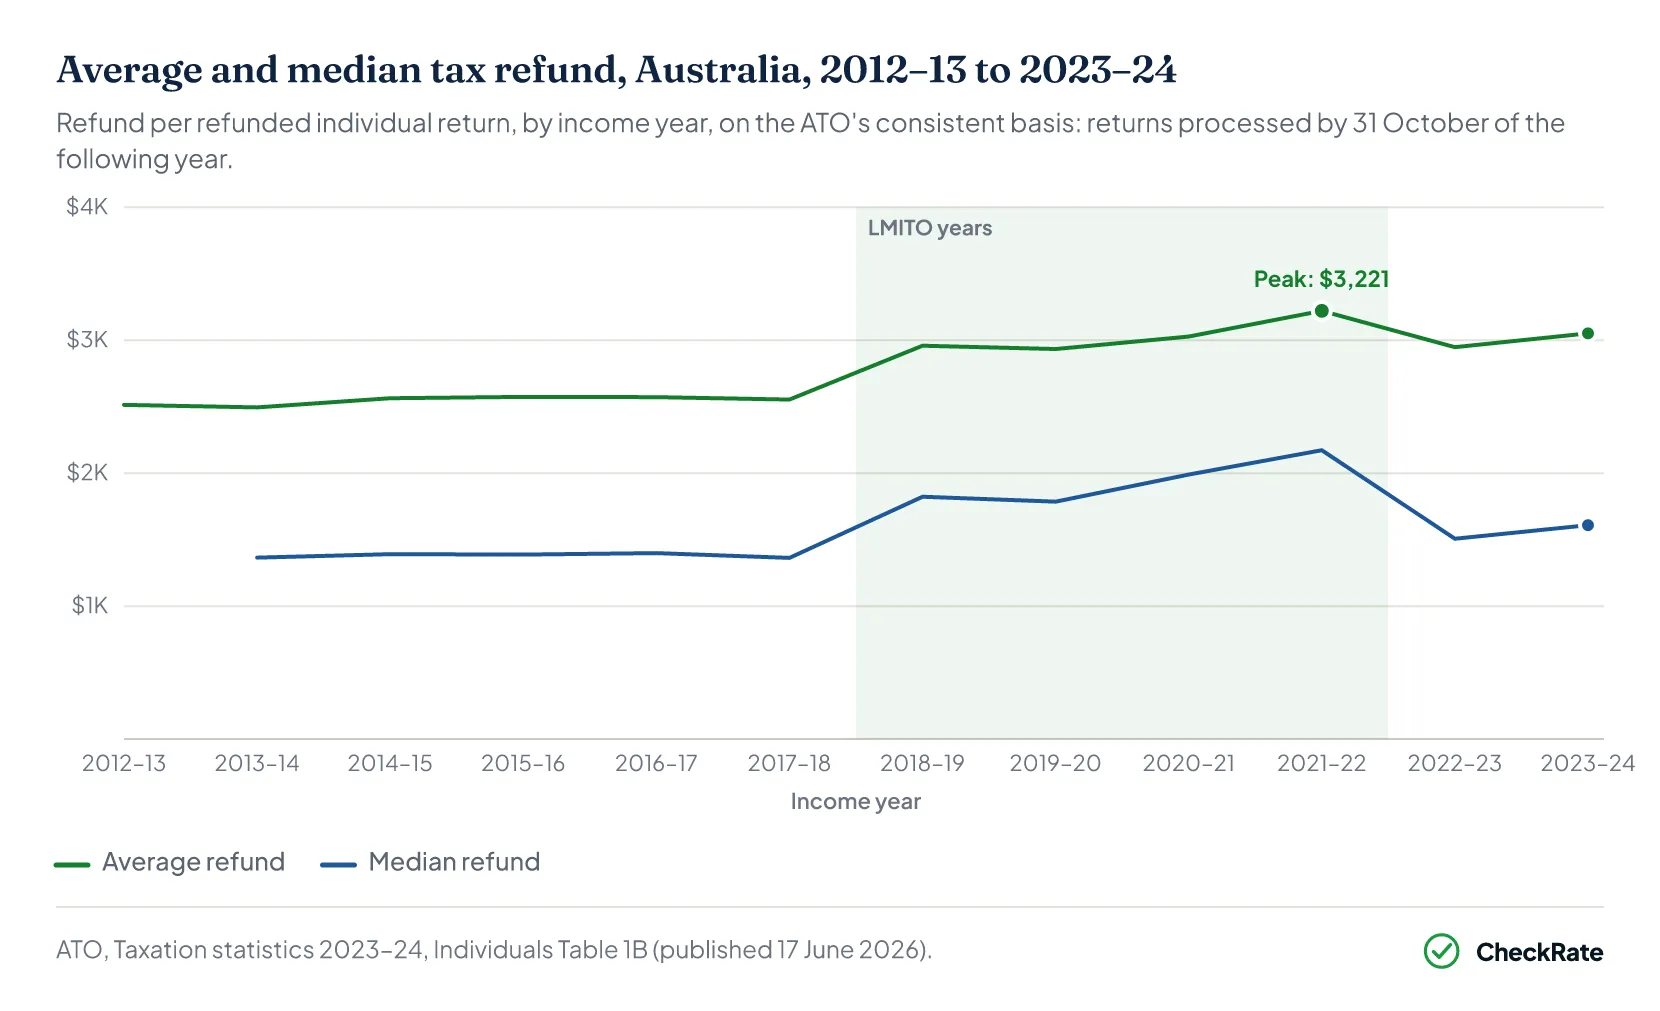
| Tax refunds by income year · consistent processing basis | ||||
|---|---|---|---|---|
| Income year | Returns refunded | Average refund | Median refund | Total refunded |
| 2012–13 | 10,262,290 | $2,514 | na | $25.8b |
| 2013–14 | 10,289,221 | $2,495 | $1,365 | $25.7b |
| 2014–15 | 10,329,907 | $2,564 | $1,391 | $26.5b |
| 2015–16 | 10,422,572 | $2,574 | $1,388 | $26.8b |
| 2016–17 | 10,766,199 | $2,572 | $1,399 | $27.7b |
| 2017–18 | 10,897,794 | $2,554 | $1,363 | $27.8b |
| 2018–19 | 11,691,272 | $2,959 | $1,823 | $34.6b |
| 2019–20 | 11,771,985 | $2,934 | $1,786 | $34.5b |
| 2020–21 | 11,718,752 | $3,028 | $1,990 | $35.5b |
| 2021–22 | 12,184,990 | $3,221 | $2,173 | $39.2b |
| 2022–23 | 11,655,044 | $2,948 | $1,507 | $34.4b |
| 2023–24 | 11,735,606 | $3,052 | $1,609 | $35.8b |
Source · ATO Taxation statistics 2023–24, Individuals Table 1B.
Section 08
Tax refunds: quick answers
What is the average tax refund in Australia?
The average refund on individual income tax assessments for 2023–24 was $3,052, across 11,735,606 refunds totalling $35.8 billion, based on returns processed by 31 October 2025. The median refund was $1,609, and refunds under $2,000 were the most common outcome, so most refunds are well below the average.
What percentage of tax returns get a refund?
Around seven in ten individual tax returns resulted in a refund in 2023–24. Of the 16.6 million returns assessed, 70.8% resulted in a refund, 22.8% in a tax bill and 6.5% in neither a refund nor a bill.
Why did average refunds fall after 2021–22?
On the ATO's consistent processing basis, the average refund peaked at $3,221 in 2021–22 and fell to $2,948 in 2022–23, a drop of $273. The fall coincided with the end of the low and middle income tax offset. The 2021–22 income year was the last in which LMITO applied, when it was worth up to $1,500. The ATO calculated the offset on assessment after lodgment, but the published data does not attribute the fall in average refunds to LMITO alone.
Does a bigger refund mean less tax was paid?
No. A refund reflects tax paid during the year in excess of the final assessed liability; it is not a measure of total tax paid. In 2023–24 the average net tax per taxable individual rose to $24,888 at the same time as 11.7 million refunds averaging $3,052 were assessed.
How long does a tax refund take in Australia?
The ATO aims to process returns lodged online through myTax or a tax agent within 12 business days, and paper returns within 50 business days. The notice of assessment states whether there is a refund or amount owing. The ATO can review an assessment for 2 years in most individual cases, or 4 years in certain circumstances.
References
- ATO, Taxation statistics 2023–24, Individuals Table 1: selected items by year (Tables 1A and 1B) · data.gov.au ↑ b c d e f g h
- ATO, Taxation statistics 2023–24, Individuals Table 13: tax assessment ranges · data.gov.au ↑ b
- ATO, Taxation statistics 2023–24, Individuals Table 16A: percentile distribution of taxable individuals · data.gov.au ↑ b
- ATO, Your notice of assessment (QC 16302) · ato.gov.au ↑
- ATO, Low and middle income earner tax offsets (QC 72196) · ato.gov.au ↑
- ATO, Why you may receive a tax bill (QC 54461) · ato.gov.au ↑
- ATO, Taxation statistics 2023–24, Snapshot data tables (all summary tables) · data.gov.au ↑ b c
- ATO, media release: 2023–24 Taxation Statistics released (QC 107551) · ato.gov.au ↑
- ATO, Taxation statistics 2023–24, Snapshot Table 1: historical rates of personal income tax · data.gov.au