What Australians pay at the supermarket
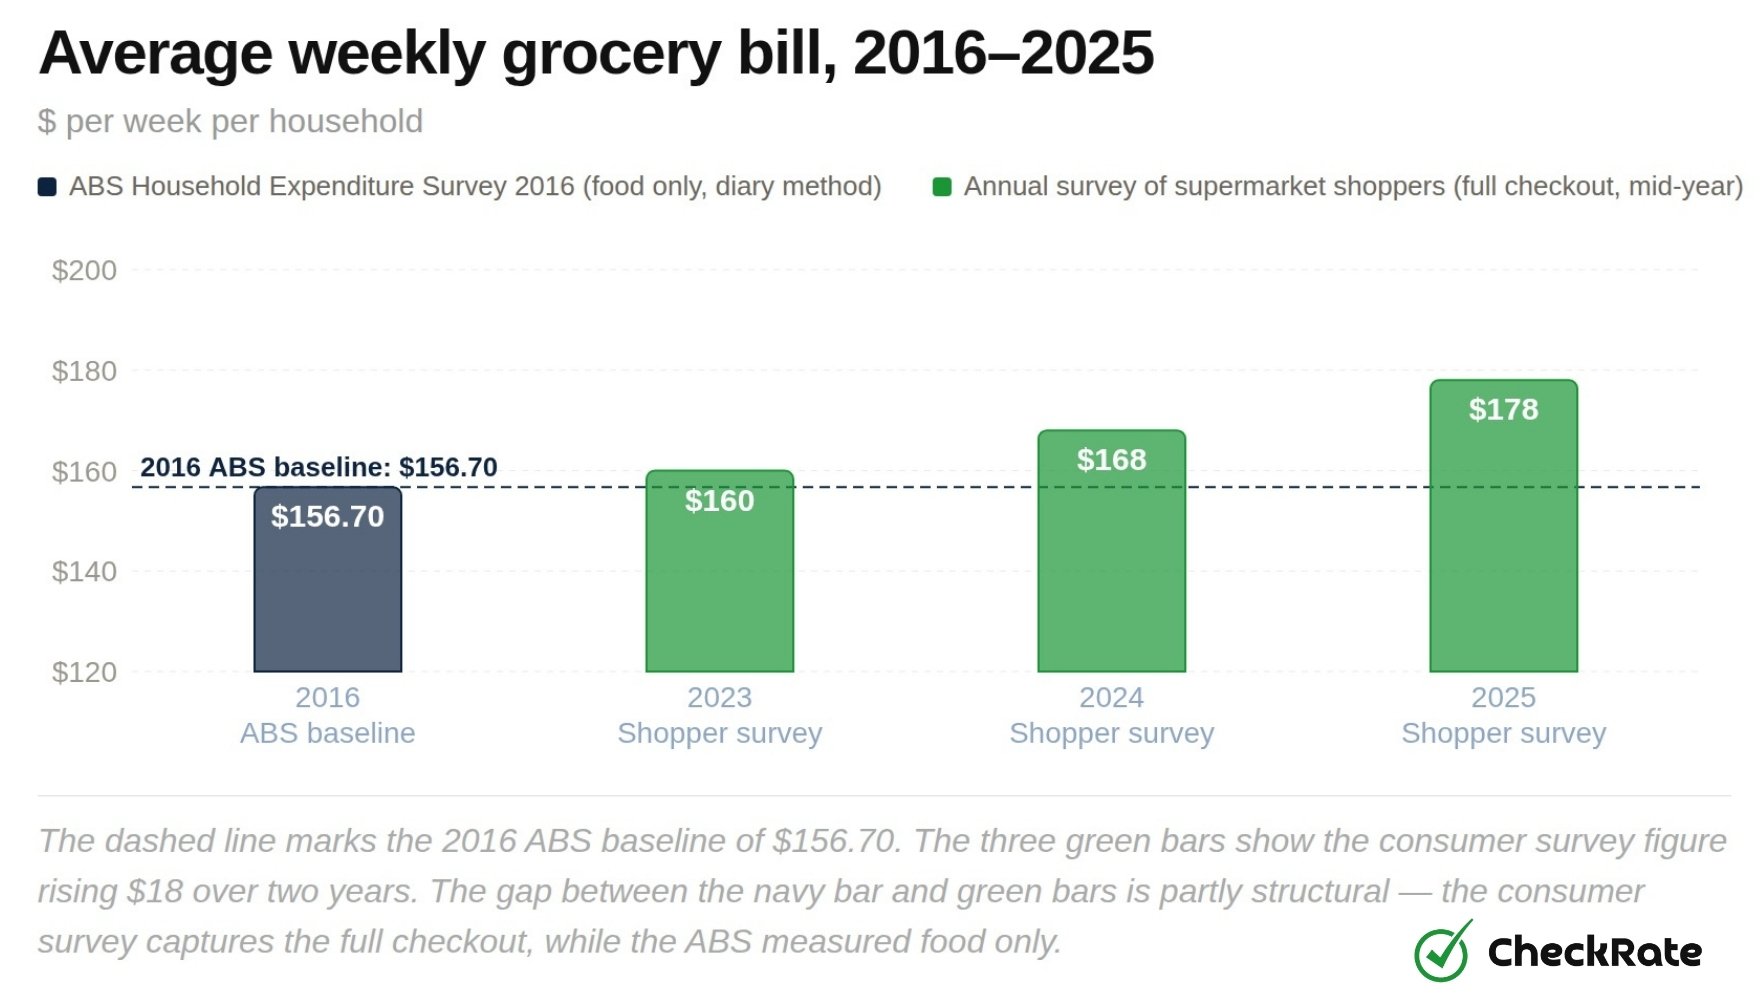
The average Australian household spends $178 a week on groceries in 2025, up from $168 in 2024 and $160 in 2023. Over three years, that is an $18 rise at the checkout, or roughly $936 more a year.
The most reliable historical figure comes from 2016, when the Australian Bureau of Statistics (ABS) sent researchers into 10,046 homes and asked them to record every food purchase for two weeks. That diary study found households spent an average of $157 per week on food and non-alcoholic drinks. The ABS has not repeated that type of household spending diary since, so more recent supermarket spending estimates rely on other sources, including annual mid-year surveys of grocery shoppers. These do not replace the ABS diary study, but they help show how supermarket costs have moved since the last detailed official snapshot.
From 2016 to around 2021, grocery prices rose slowly. Then several things hit at once. Global shipping costs surged, the war in Ukraine pushed up grain and oil prices, and flooding across eastern Australia damaged crops in 2022 and 2023.
By mid-2024, the Australian Competition and Consumer Commission (ACCC) found that grocery prices were rising at more than twice the rate of wages. The pace of increase has since moderated, but grocery bills have not fallen. The national average has continued to climb, from $160 in 2023 to $178 in 2025.
Australian food spending is at its highest on record
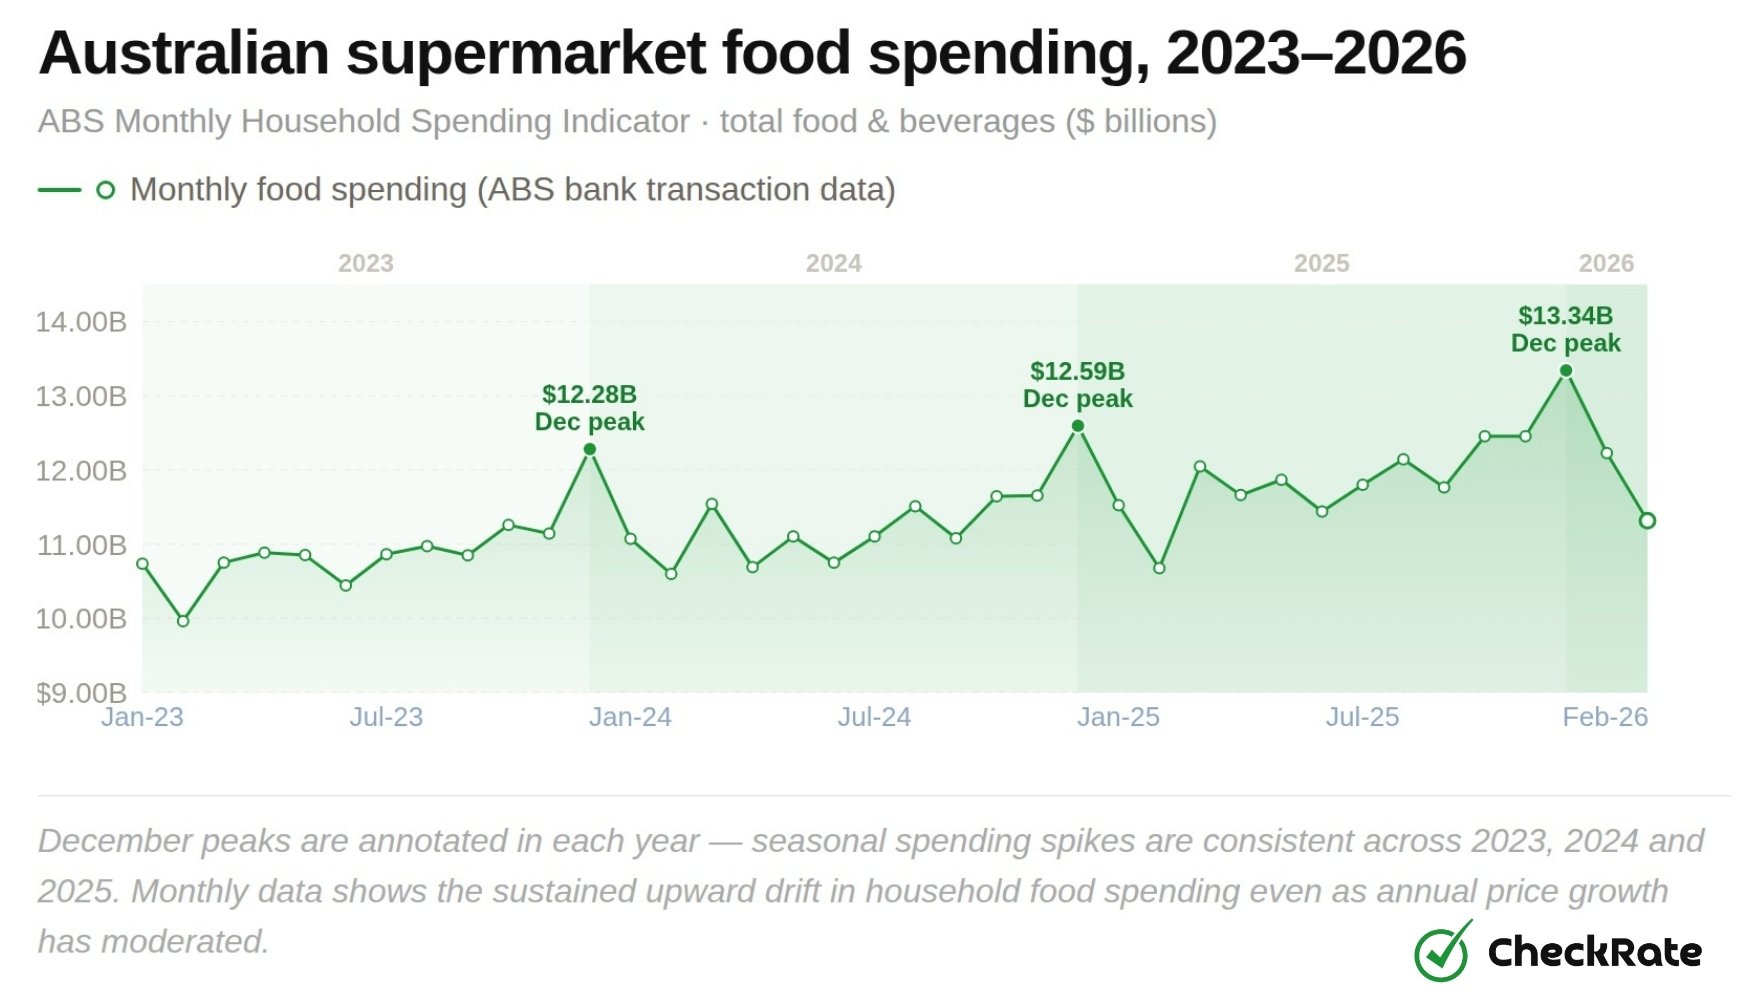
Total Australian household food spending reached $13.3 billion in December 2025, the highest monthly figure in the ABS Monthly Household Spending Indicator series. Every month of 2025 also tracked above the same month in 2023, pointing to a sustained rise in food-related spending.
The ABS Monthly Household Spending Indicator, which draws on bank transaction data across millions of accounts, shows the increase has been spread across both supermarket groceries and eating out.
Jan-23
Grocery bills by state: how each has changed since 2016
Every state has a higher weekly grocery bill in 2025 than in 2016. Queensland recorded the largest nominal gain, up about 18.4% or $27.60 per week. Despite Western Australia being the most expensive state in 2016, it recorded the smallest rise at +$12.18 (+7.3%).
Data note: The 2016 figures cover food only, while 2025 includes the full checkout receipt, so some of each state's increase reflects that broader definition rather than price rises alone.
NSW
Which food category costs the most and is rising fastest?
Meat took the largest single share of grocery spending in 2016 at around $27 a week. It is now also the fastest-rising food category, with beef and veal up 13.5% year on year to February 2026.
That double burden means households are paying more for the item they were already spending the most on.
The food categories making the biggest dent in the budget
Beef and veal are up 13.5% year-on-year to February 2026, and lamb and goat are close behind at 13%. That means a kilogram of beef that cost $20 a year ago now costs around $22.70. Over a week's shopping, that adds up quickly.
Across the rest of the shopping basket, price rises are broad. Coffee, tea and cocoa are up 11.5%, driven by global supply disruptions. Snacks and confectionery are up 6.7%.
At the more stable end, vegetables and pork have risen just 0.5%.
That widening gap between proteins and produce is already changing how Australians shop. Fewer households are buying premium cuts of red meat, with more switching to chicken, pork or plant-based alternatives.
The shift toward home-brand supermarket products is the clearest consumer response. Private-label goods now account for a larger share of trolleys than at any point in the past decade. The savings on individual items are real, but the overall spend at the checkout has not fallen, because prices have risen across even the most basic product lines.
How household size affects the weekly grocery bill
In 2025, singles spent $111 a week on groceries, couples $161, and families of four $240.
The per-person cost falls significantly as household size grows, from $111 for someone living alone to around $60 for someone in a larger family. Total bills have risen since 2021 across all household types, but the increase has been steepest for families, whose weekly bill has risen 28% over that period.
Grocery bill for one person
Singles spent $111 a week on groceries in 2025, which works out to around $5,772 a year. That is the highest per-person cost of any household type.
Multi-buy promotions, twin-packs and family-size formats offer the lowest unit price, but single-person households often cannot use them without food going to waste.
That per-person cost hits hardest for pensioners on fixed incomes. Unlike working-age singles who can cut back elsewhere or take on extra hours, retirees living alone have very little room to absorb price rises in essential categories.
Grocery bill for couples
Couples spent $161 a week in 2025, or around $80.50 per person, roughly 27% less per head than someone living alone.
Two-person households buy more efficiently. Shared meals, larger pack sizes and the ability to plan across multiple nights all reduce the cost per person.
The 2025 figure is marginally below the 2024 figure of $163. That small dip does not reflect falling prices. It may reflect deliberate adjustments like switching to cheaper brands, cooking more from scratch, or planning meals around what is on sale that week.
Grocery bill for families
Families of four spent $240 a week on groceries in 2025, an 11% jump in a single year and 28% more than the 2021 figure of $187. That works out to around $12,480 a year at the checkout.
The jump to $240 in 2025 suggests families could no longer hold the weekly grocery bill at its previous level. In practice, many families are now dropping premium cuts of meat, buying more home-brand products, and building meals around cheaper, filling staples like pasta, rice and legumes.
Grocery spending by state: where Australians spend the most in 2025
Among the five mainland states, NSW households spent the most at $180 a week, while South Australia was lowest at $167.
Western Australia followed closely behind NSW at $179 a week, while Queensland matched the national average at $178. Victoria came in lower, at $173 a week.
In 2016, Western Australia was the most expensive state at $166.82 a week, while South Australia was the cheapest at $146.82. WA's higher figure likely reflected the added cost pressures of distance and freight across the Nullarbor.
By 2025, South Australia remained the most affordable mainland state, but the gap had narrowed. Its average weekly grocery spend rose by around $20 across the period.
How each state has changed since 2016
Queensland recorded the steepest rise of any state between 2016 and 2025, up $27.60 per week, a gain of 18.4%. Western Australia, despite being the most expensive state in 2016, had the smallest nominal gain at $12.18, or 7.3%.
Data note: The 2016 figures measure food only (ABS diary method), while the 2025 figures cover the full checkout receipt, so some of the nominal increase reflects the broader definition rather than price rises alone.
| State | 2016 ABS ($/wk) | 2025 survey ($/wk) | Nominal change |
|---|---|---|---|
| New South Wales | $158.45 | $180.00 | +$21.55 (+13.6%) |
| Queensland | $150.40 | $178.00 | +$27.60 (+18.4%) |
| Western Australia | $166.82 | $179.00 | +$12.18 (+7.3%) |
| Victoria | $158.37 | $173.00 | +$14.63 (+9.2%) |
| South Australia | $146.82 | $167.00 | +$20.18 (+13.7%) |
Average grocery bill by household size in Australia
The national average is $178 a week, but what counts as typical depends heavily on the number of people in the household.
Singles average $111, couples $161, and families of four $240.
| Household type | Weekly | Monthly | Annual | Per person/wk | vs $178 avg |
|---|---|---|---|---|---|
| Single person | $111 | $481 | $5,772 | ~$111 | -$67 |
| Couple (no kids) | $161 | $699 | $8,372 | ~$80.5 | -$17 |
| Family of 3 (est.) | $200 | $867 | $10,400 | ~$67 | +$22 |
| Family of 4+ | $240 | $1,040 | $12,480 | ~$60 | +$62 |
Why do some households spend more than the average?
Households that spend above the benchmark tend to be in regional or remote areas where food costs more, have specific dietary needs, or include cleaning products and toiletries in the weekly shop. Those who spend less often use discount supermarkets, cook from scratch, or have fewer people than the household type suggests.
- ABS Household Expenditure Survey 2015–16: Food and non-alcoholic beverages; fortnightly diary across 10,046 households.
- ABS Monthly Household Spending Indicator, 2023–2026: Bank transaction data covering all household food expenditure, including dining out.
- ABS Consumer Price Index, February 2026: Food sub-categories including meat, dairy, fruit, vegetables and coffee.
- Annual supermarket shopper survey (Canstar Blue), 2023–2025: National average, 2023–2025 comparison, state breakdown, and household-size grocery spending data.
- ACCC Supermarkets inquiry interim report, 2024: Australian Competition and Consumer Commission.
- NTCOSS cost of living reports, various years: Northern Territory Council of Social Service; remote community food pricing.
- National Library of Medicine: Longitudinal dietary cost study, Greater Brisbane, 2019–2022: Healthy vs unhealthy diet cost divergence.
Data Snapshots