


Published
 How does the Australian tax system work?Australian governments collected $839.0 billion in tax revenue in 2024–25, according to the ABS. The Commonwealth collected 80.5% of that total, compared with 16.6% for state and territory governments…
 GST in Australia: how much revenue it raises and how the 10% rate compares to the worldThe GST raised $94.8 billion for the Commonwealth in 2024–25, on the accrual measure in the ABS government finance statistics. That was 14.0% of the Commonwealth's $675.2 billion of taxation revenue,…
 Australian income tax brackets: the full history since 1983The 2026–27 scale changed in one respect from 1 July 2026. The rate on income between $18,201 and $45,000 fell from 16% to 15% on 1 July 2026 under the Treasury Laws Amendment (More Cost of Living Rel…
Section 01 · The ratio
What is Australia's tax-to-GDP ratio?
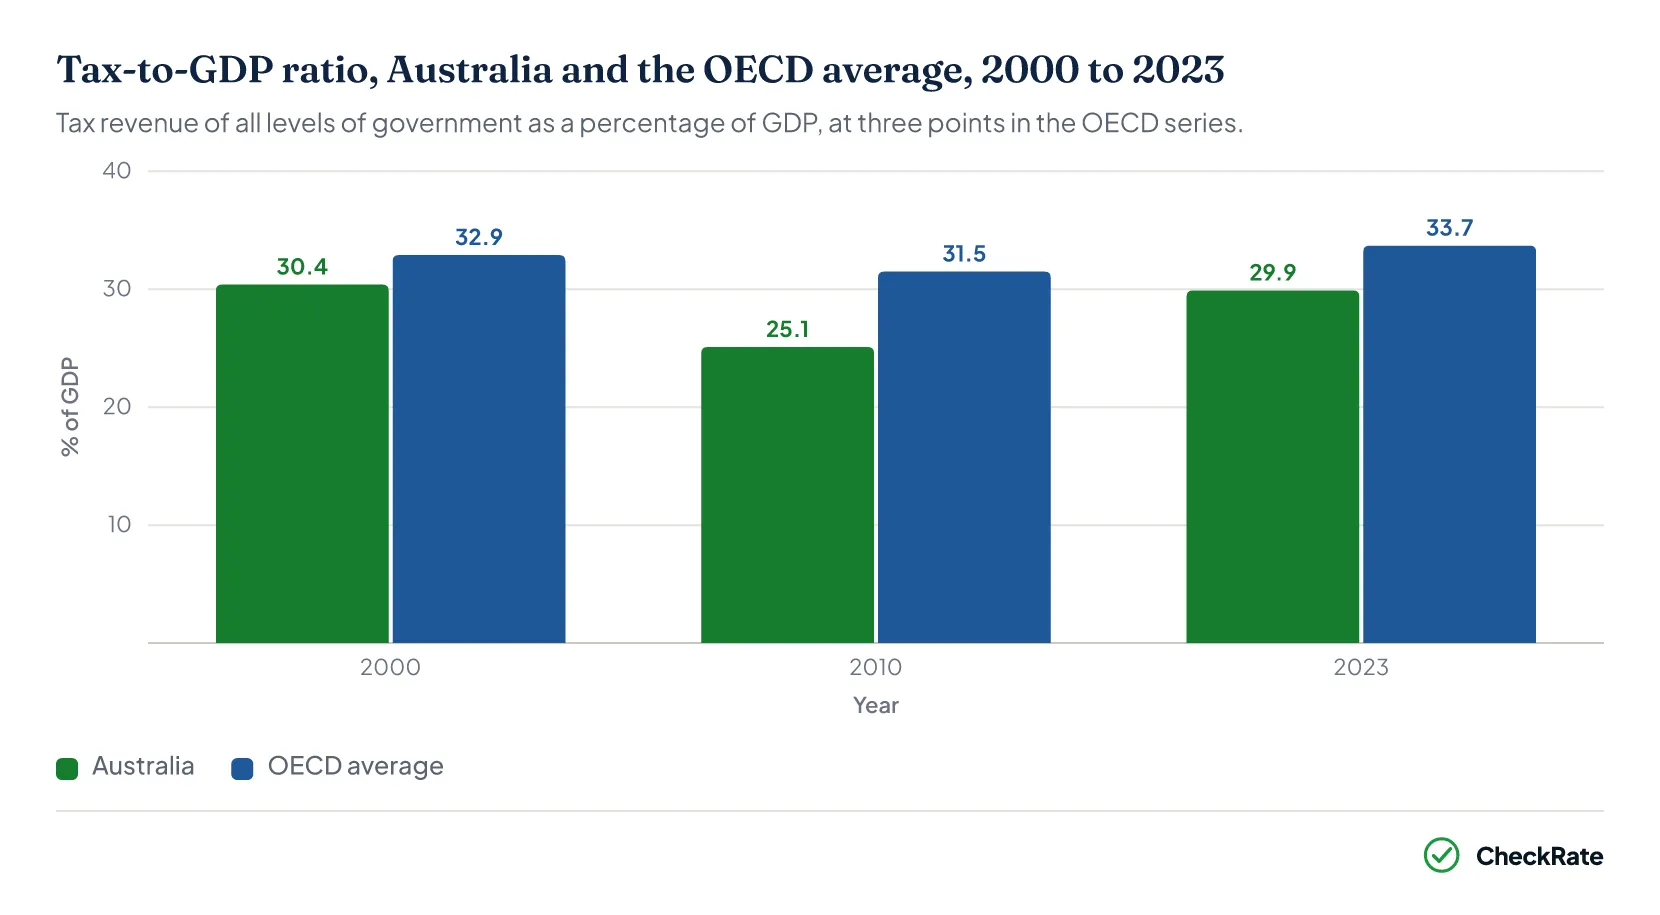
Australia's tax-to-GDP ratio was 29.9% in 2023–24, the latest OECD figure available for Australia, up 0.6 percentage points from 29.3% the year before1. The ratio counts the tax collected by all levels of government, including Commonwealth, state and local governments, as a percentage of GDP. In the OECD classification, taxes are compulsory unrequited payments to general government, so the measure includes income tax, company tax, the GST, excises, payroll taxes, land taxes, municipal rates and stamp duties in one total2.
Since 2000, the ratio has stayed between 25.1% and 30.4% in the OECD series. The high point was 2000 and the low point was 20101. In dollar terms, the OECD records A$798,309 million of tax revenue across all levels of Australian government in 2023–24, an increase of A$45,698 million on the year before.
The ABS publishes a more recent domestic measure. On the ABS government finance statistics measure, taxation revenue was 30.2% of GDP in 2024–25, on total taxation revenue of $839.0 billion. The ratio was 27.9% in 2015–163.
Section 02 · The ranking
How Australia compares with the OECD average
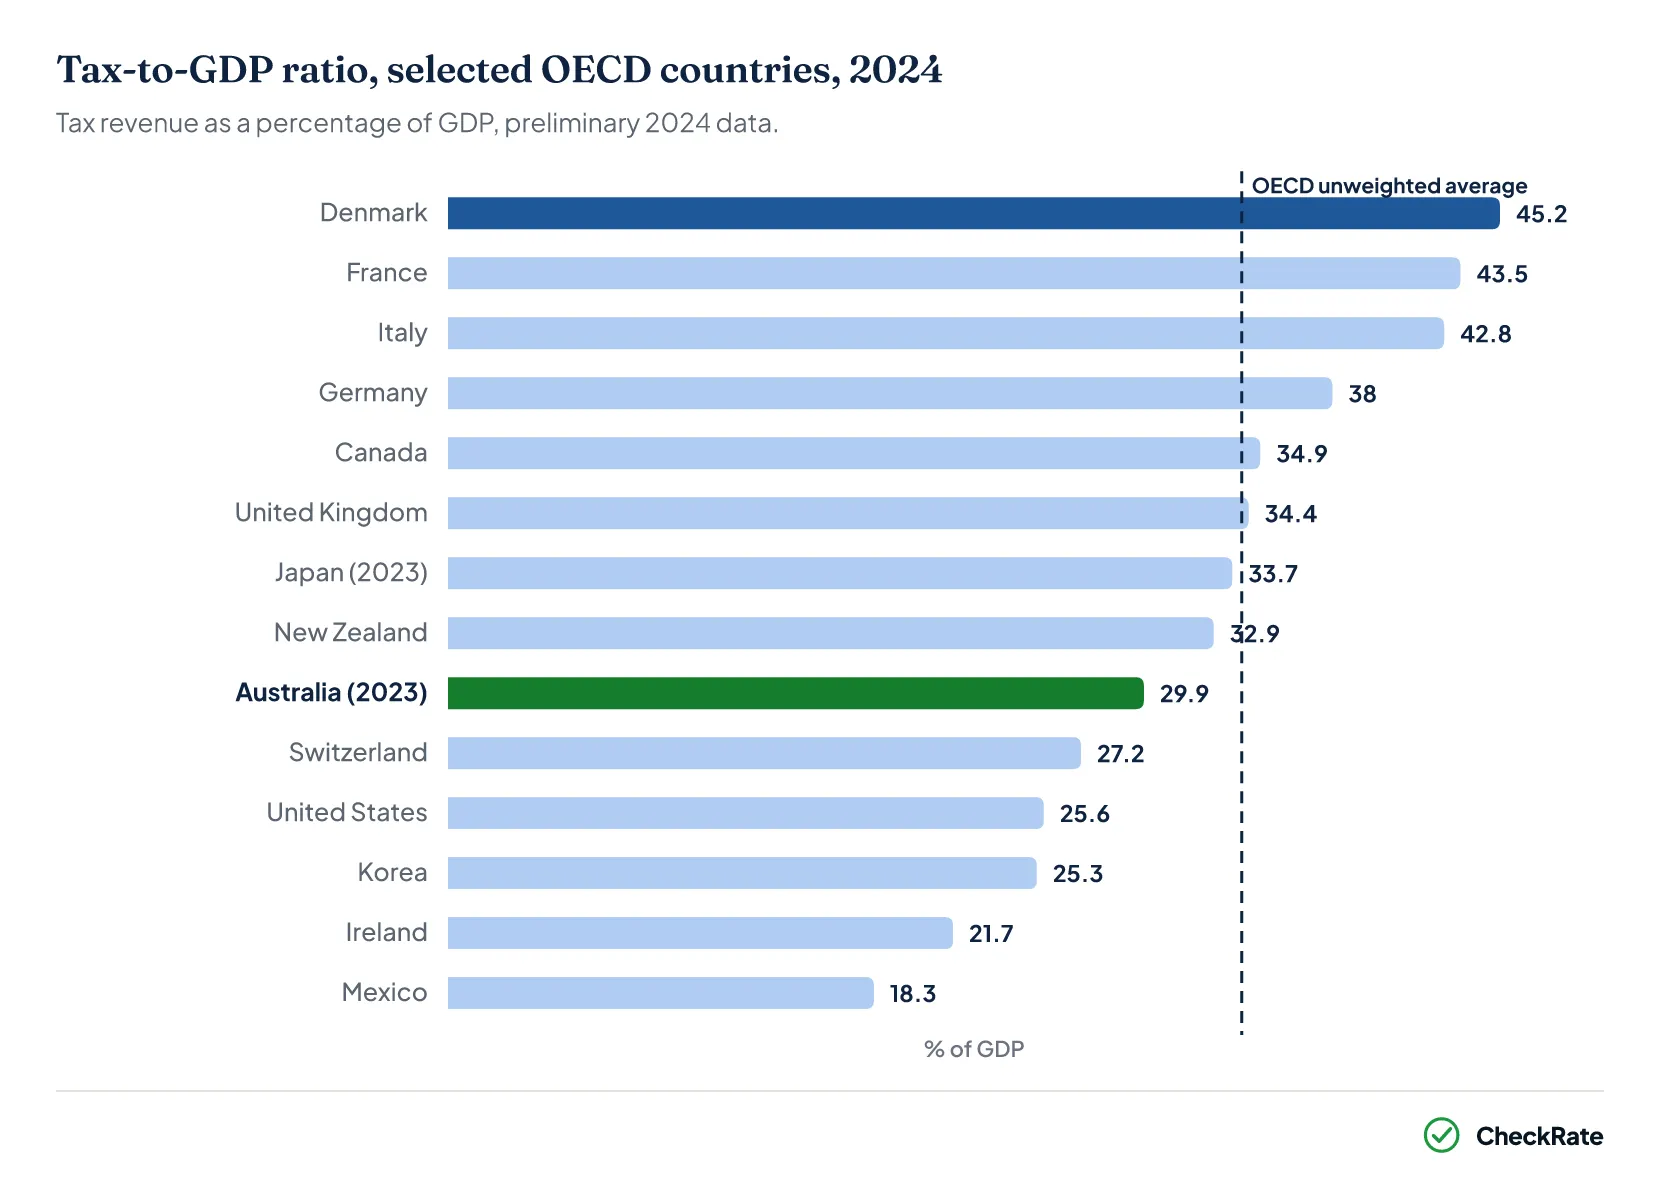
Australia ranked 28th of the 38 OECD countries by tax-to-GDP ratio in 2023, the latest year with final data for every member. Denmark had the highest ratio at 44.0%, followed by France at 43.9%, and Mexico the lowest at 17.7%4. Australia was one of 11 members below 30%, alongside countries including Switzerland, Korea and the United States.
On preliminary data for 2024, the OECD average increased to 34.1% of GDP, its highest recorded level. Australia could not provide 2024 data, so the OECD's 2024 comparison uses Australia's 2023–24 figure and places it 29th of 38 countries1. Between 2022 and 2023, while Australia's ratio rose by 0.6 percentage points, the OECD average fell from 34.0 to 33.7%4.
The OECD's summary of Australia's tax structure shows a higher share of revenues from personal income, corporate income, property and non-GST consumption taxes than the OECD average. Australia has a lower proportion from the GST, and collects no social security contributions1.
| Australia's tax revenue mix compared with the OECD average, 2023 | |||
|---|---|---|---|
| Tax category | Australia (% of total tax revenue) | OECD average (%) | Australia's rank of 38 |
| Personal income tax | 42.6 | 23.7 | 2nd |
| Company income tax | 19.5 | 11.9 | 6th |
| Goods and services taxes other than GST or VAT | 12.0 | 10.8 | .. |
| GST (VAT overseas) | 11.1 | 20.5 | 37th |
| Taxes on property | 9.7 | 5.1 | 6th |
| Payroll taxes | 5.1 | - | 4th |
| Social security contributions | 0.0 | 25.5 | 37th |
Source · OECD, Revenue Statistics 2025, Australia country note and Chapter 1 Table 1.1, published 9 December 2025.
Section 03 · Income tax
Why Australia relies heavily on personal income tax
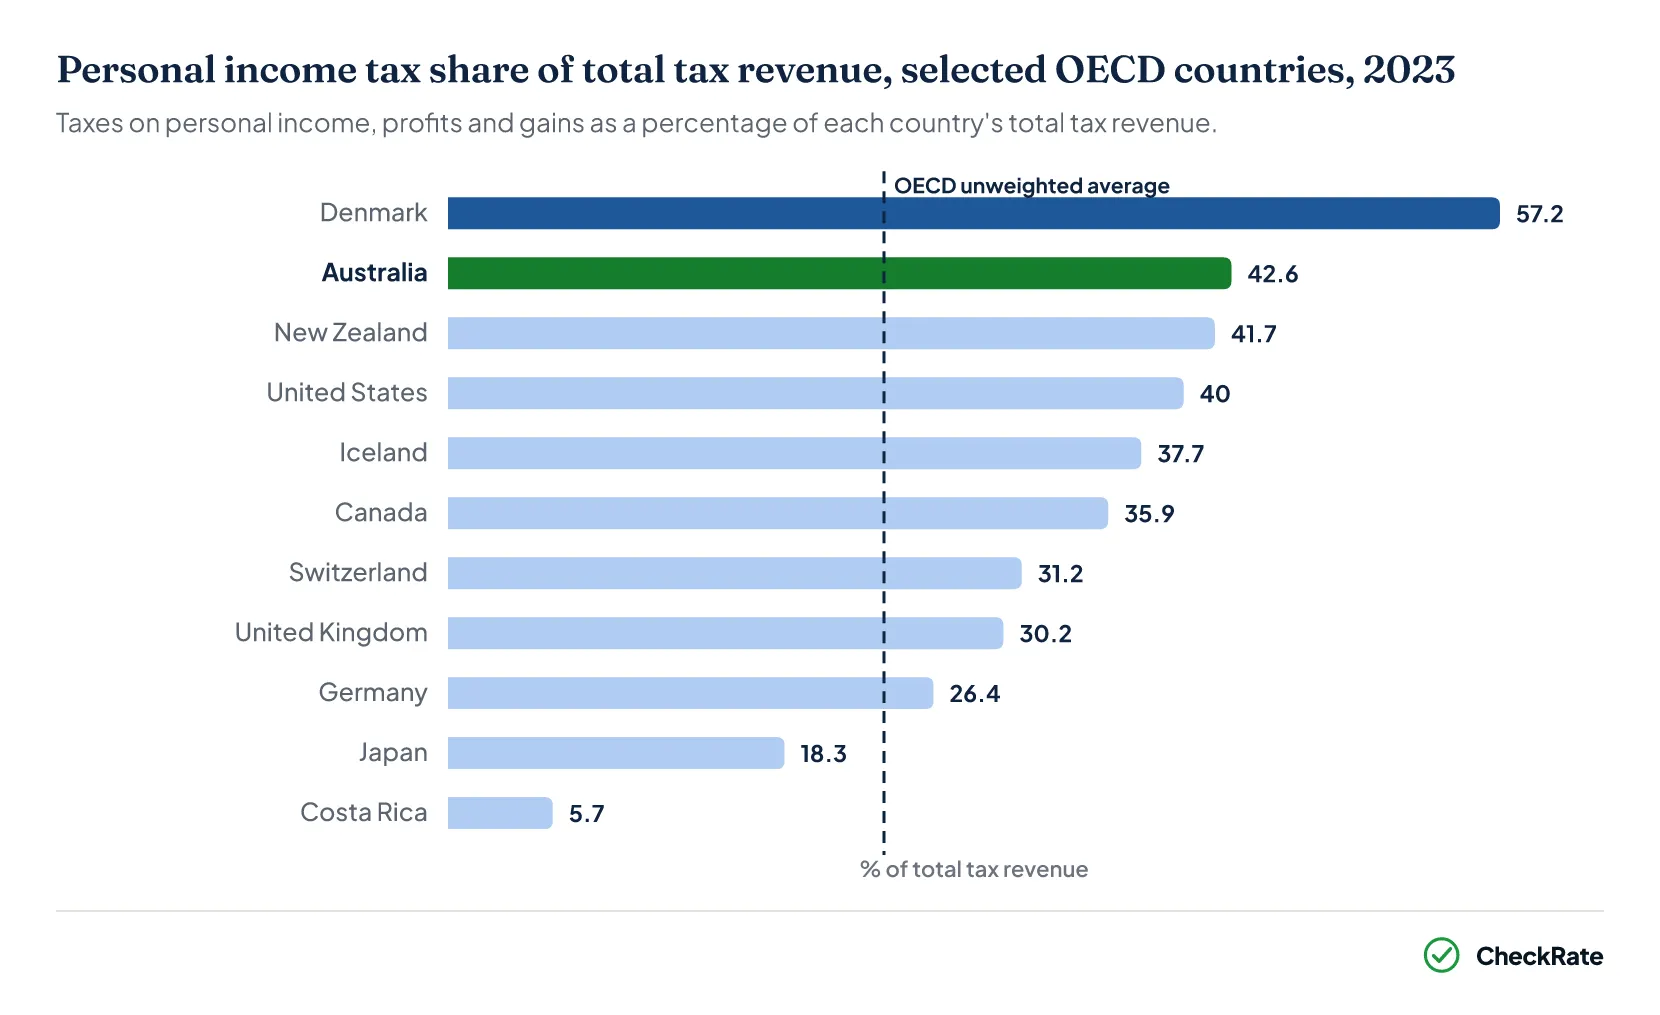
Personal income tax supplied 42.6% of Australia's total tax revenue in 2023–24, the second-highest share in the OECD. Only Denmark, at 57.2%, had a higher share, and the OECD average was 23.7%4. In dollars, personal income tax raised A$340,008 million in 2023–24, equivalent to 42.6% of the A$798,309 million total, derived by dividing the two1. The share increased from 40.5% in 2022–23, moving Australia's rank from 4th to 2nd.
Part of the explanation is arithmetic. Tax mix shares are shares of one total, and the 25.5% of revenue that the average OECD country collects as social security contributions has no counterpart in Australia. As a result, the taxes Australia does levy account for larger shares of its total tax revenue. The OECD's Taxing Wages models show the same pattern from the worker's side: in 2025, a single Australian worker on the average wage paid 23.5% of gross earnings in income tax and nothing in employee social security contributions, while the OECD averages were 15.5% for income tax and 9.6% for social security contributions5.
A high income tax share is not the same as high total taxes on wages. Measured against total labour costs, Australian income tax was 22.2% for the average single worker in 2025, one of five OECD shares above 20%5. The total tax wedge is the gap between what employment costs and what the worker takes home. With no social security contributions, Australia's wedge was 27.9% of labour costs in 2025, against an OECD average of 35.1%, ranking 30th of 38. Australia's wedge also recorded the OECD's largest fall in 2025, down 1.67 percentage points, which the OECD attributes mostly to lower tax rates and higher thresholds in the resident tax scale.
How the resident tax scale behind these figures has changed over four decades is covered in the income tax brackets history article.
Section 04 · Company tax
How company tax revenue compares internationally
Company income tax supplied 19.5% of Australia's tax revenue in 2023–24, the sixth-highest share among the 38 OECD countries and above the OECD average of 11.9%4. Five members collected a greater share: Colombia at 32.4%, Norway at 28.8%, Chile at 25.3%, Mexico at 22.0% and Ireland at 21.5%. The Australian share fell from 21.8% in 2022–23, when company tax collections were A$164,048 million. Collections fell by A$8,562 million to A$155,486 million in 2023–24.
The OECD states that, in addition to differences in statutory company tax rates, variations between countries are partly explained by institutional and country-specific factors: how widely firms incorporate, the breadth of each country's company tax base, the cyclicality of the corporate tax system, the extent of reliance on tax revenue from oil and mineral deposits, and other instruments that postpone the taxation of earned profits4.
| Company income tax share in selected OECD countries, 2023 | |
|---|---|
| Country | Company income tax (% of total tax revenue) |
| Colombia | 32.4 |
| Norway | 28.8 |
| Chile | 25.3 |
| Mexico | 22.0 |
| Ireland | 21.5 |
| Australia (6th of 38) | 19.5 |
| OECD average | 11.9 |
Source · OECD, Revenue Statistics 2025, Chapter 1 and Australia country note, published 9 December 2025.
How Australia's company tax collections split by rate, industry and company size is covered in the company tax statistics article.
Section 05 · GST
How Australia's GST compares with overseas value-added taxes
Australia's 10% GST is one of the lowest standard rates in the OECD, where the unweighted average standard VAT or GST rate was 19.3% as at 1 January 2024. Only Canada's 5% federal GST and Switzerland's 8.1% rate were lower, and Japan and Korea also charged 10%. At the top of the range, 23 countries charged 20% or more, and Hungary's 27% rate was the highest6. Australia's rate has been 10% in every year of the OECD's rate table since the tax began in 2000.
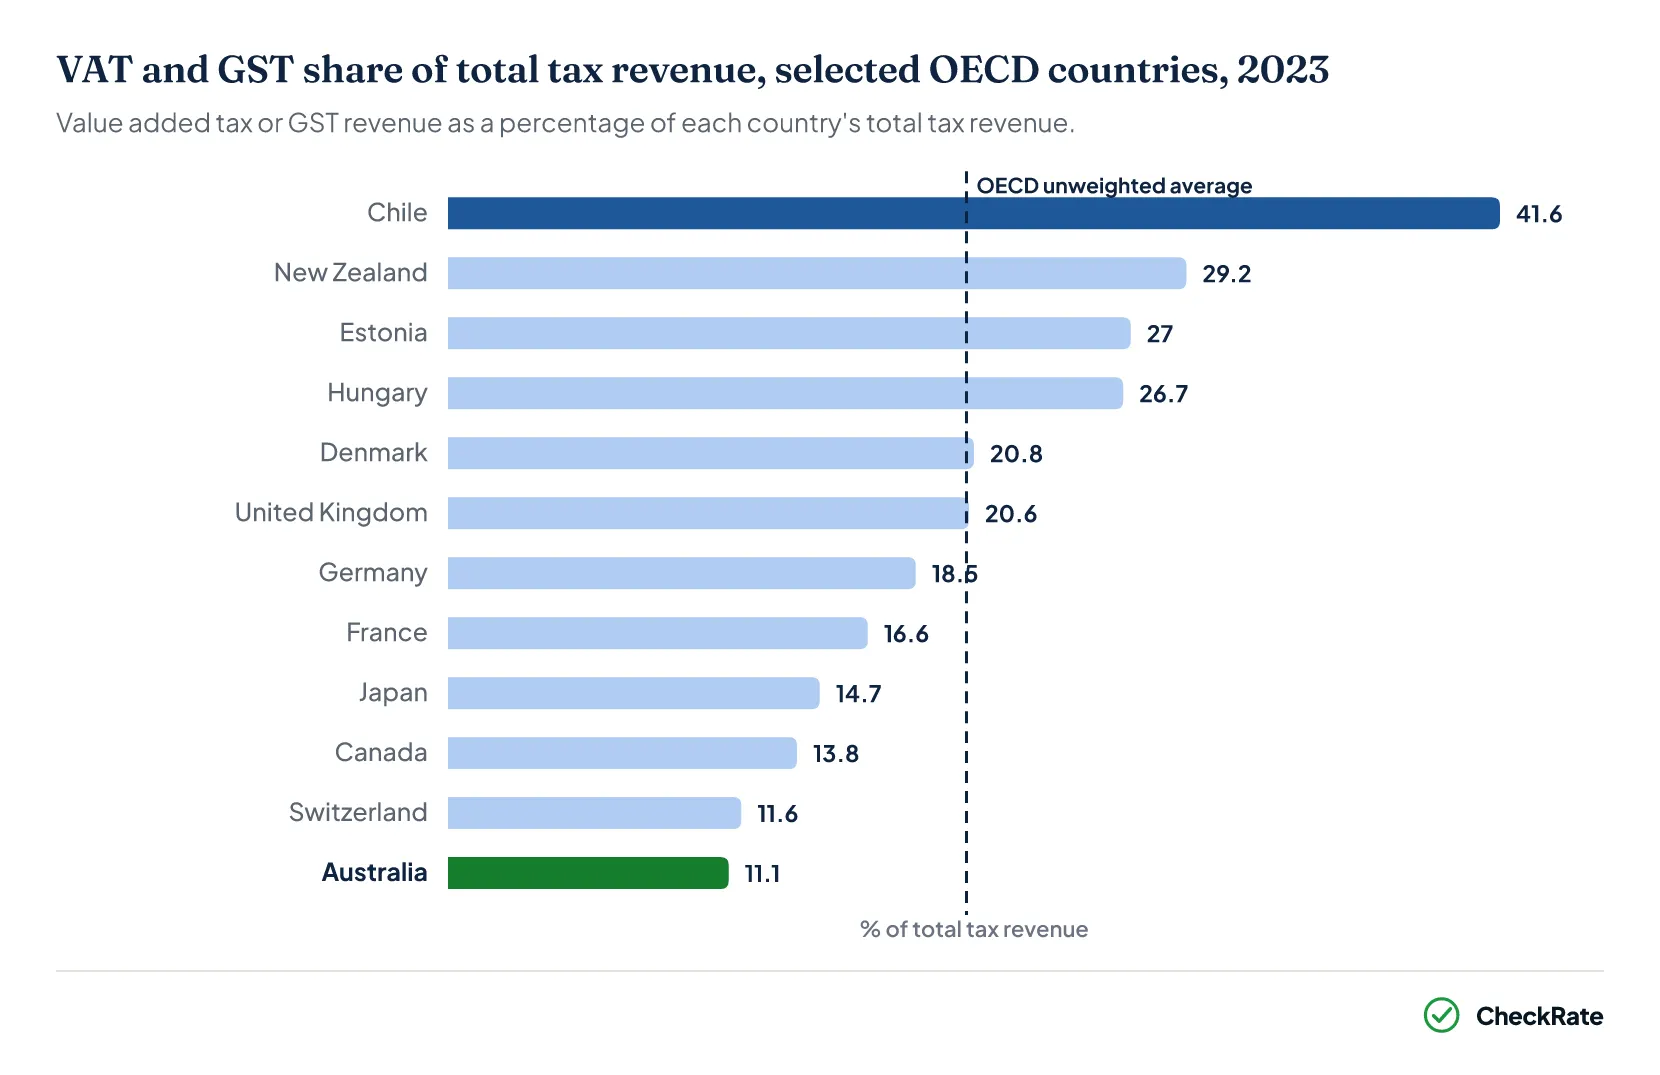
GST collections accounted for 11.1% of Australia's total tax revenue in 2023–24, against an OECD average VAT share of 20.5%. Every other OECD country that levies a VAT recorded a higher share. The United States, which ranks below Australia, levies no VAT at all4. New Zealand's 15% GST supplied 29.2% of its tax revenue in 2023, around 2.6 times Australia's share, derived by dividing the two shares.
What the GST raises, who receives it and how the 10% rate has held since 2000 is covered in the GST statistics article.
Section 06 · Social security
Why social security contributions affect international rankings
Social security contributions were the largest single category of tax in the OECD in 2023, averaging 25.5% of total tax revenue, while Australia collects none of them. The OECD's Revenue Statistics states that Australia and New Zealand are the only members that do not levy social security contributions4. At the other end of the range, these contributions accounted for more than 40% of revenue in Czechia, Slovenia and the Slovak Republic. Australia and New Zealand both fund pensions and other social benefits through social assistance paid from general revenue, rather than through contributory social security funds.
Australia's compulsory superannuation sits outside the OECD tax measures used in this article. In 2024–25 the superannuation guarantee required employers to pay 11.5% on top of ordinary time earnings, on earnings up to $65,070 a quarter. The rate rose to 12% in 2025–26.7 The OECD's Taxing Wages states that these contributions are not a form of taxation because they are not an unrequited transfer to general government. They are paid to private regulated funds and form part of the employee's assets.
Counting compulsory payments to private schemes alongside tax can change some countries' relative positions. In the OECD's own analysis, Switzerland, with a tax-to-GDP ratio of 26.9% in 2023, moves to just above halfway in the OECD once its compulsory private contributions of 8.1% of GDP are added, and Iceland's combined ratio of 41.9% becomes the sixth-highest4. Australia's position is unaffected by that particular adjustment, which covers financing for social-security-type benefits rather than retirement savings.
Australia
Social security contributions: none levied; 0.0% of tax revenue in 2023–24
Pensions and benefits paid from general revenue as social assistance
Compulsory superannuation of 11.5% of ordinary time earnings in 2024–25 paid to private funds; not counted as tax
OECD
Social security contributions averaged 25.5% of tax revenue in 2023, the largest category
Above 40% of revenue in Czechia, Slovenia and the Slovak Republic
For an average single worker, employee plus employer contributions averaged 21.6% of labour costs in 2025, derived by adding the OECD's two averages
Source · OECD Revenue Statistics 2025, Chapter 1; OECD Taxing Wages 2026, Australia chapter and Table 1.2 (8.1 + 13.5 = 21.6)
Section 07 · Property and payroll
How Australia compares on taxes on property and payroll
Taxes on property supplied 9.7% of Australia's tax revenue in 2023–24, the sixth-highest share in the OECD and almost double the OECD average of 5.1%4. Four members collected more than 10% of their revenue from property taxes in 2023: Korea, the United States, Israel and the United Kingdom. Canada's 9.9% also sat just above Australia's.
The OECD's property tax category is broader than the everyday meaning of the term. It covers recurrent taxes on immovable property as well as taxes on financial and capital transactions, including stamp duty on property transfers2. On the ABS's newer domestic figures for 2024–25, the taxes of this kind collected by Australian state and local governments included $25.1 billion of municipal rates, $20.0 billion of land taxes and $34.4 billion of stamp duties on conveyances. Payroll taxes, which sit in a separate category, raised $41.7 billion3.
Payroll taxes accounted for 5.1% of Australia's tax revenue in 2023–24, the fourth-highest share among OECD countries, and raised A$40,734 million. Most members raise little or nothing under this heading, and the OECD includes payroll taxes within a residual category that averages 2.6%41.
Across the OECD, the property tax share fell from 7.9% of revenue in 1965 to 5.1% in 2023. Australia's share rose from 9.3% in 2022–23 to 9.7% in 2023–24, lifting its rank from 7th to 6th among the 38 OECD countries14.
Section 08 · Data limits
What the latest OECD data can and cannot show
The OECD comparison lags behind Australia's domestic tax statistics. Revenue Statistics 2025 carries final data for 2023 and preliminary data for 2024, but Australia and Japan could not provide 2024 figures. Australia's latest OECD figures therefore cover 2023–24, while the ABS has published domestic data for 2024–25. Final 2023 data reached the OECD between May and September 2025, and the GDP denominators are the estimates available in October 20254.
Reporting years also differ. Most OECD members report on a calendar-year basis, while Australia's 2023 OECD reporting year covers July 2023 to June 2024. The OECD averages quoted on this page are unweighted, meaning every country counts equally regardless of the size of its economy. And the comparison counts taxes only: compulsory superannuation and similar mandatory payments to private bodies sit outside the definition, with this kind of financing reported separately by the OECD4.
The OECD framework counts tax collected by every level of government on a common definition. On that definition, the central government collected 80.8% of Australia's tax revenue in 2023–24, the highest central share among the eight federal OECD countries; Germany's central share was 28.5%4. For 2024–25, which is not yet included in the OECD tables for Australia, the ABS's own 2024–25 release put Australian taxation revenue at 30.2% of GDP on its domestic measure3.
Section 09
Australia and the OECD: quick answers
Is Australia a high-tax country?
By the OECD's headline measure, Australia has a lower tax-to-GDP ratio than the OECD average. Tax revenue was 29.9% of GDP in 2023–24, which ranked Australia 28th of the 38 OECD countries and was 3.8 percentage points below the OECD average of 33.7% for 2023. Australia stands out instead for its tax mix: the second-highest personal income tax share in the OECD and no social security contributions.
What is Australia's tax-to-GDP ratio?
Australia's tax-to-GDP ratio was 29.9% in 2023–24 on the OECD Revenue Statistics measure, which covers all levels of government. On the ABS measure, taxation revenue was 30.2% of GDP in 2024–25. The figures cover different financial years and use different statistical frameworks, so they are not directly comparable.
Which OECD country has the highest tax-to-GDP ratio?
Denmark had the highest tax-to-GDP ratio in the OECD at 44.0% in 2023, the latest year with final data for all 38 members, followed by France at 43.9%. Mexico had the lowest at 17.7%. On preliminary 2024 data, Denmark again had the highest ratio, at 45.2%, and Mexico was lowest at 18.3%.
Is superannuation counted as tax in international comparisons?
Superannuation guarantee contributions are not counted as tax in OECD comparisons. The OECD's Taxing Wages 2026 states they are not a form of taxation because they are not an unrequited transfer to general government. Employers instead pay the contributions into private, regulated superannuation funds, where they form part of the employee's assets. The rate was 11.5% of ordinary time earnings in 2024–25 and rose to 12% in 2025–26.
How does Australia's GST rate compare with VAT rates overseas?
Australia's 10% GST is one of the lowest standard rates in the OECD. The unweighted average standard VAT or GST rate across the OECD was 19.3% as at 1 January 2024. Only Canada's 5% federal GST and Switzerland's 8.1% rate were lower than Australia's rate. Japan and Korea also charged 10%, while Hungary's 27% rate was the highest.
References
- OECD, Revenue Statistics 2025: Australia country note · oecd.org ↑ b c d e f g
- OECD, The OECD classification of taxes and interpretative guide · oecd.org ↑ b
- ABS, Taxation Revenue, Australia, 2024–25, Table 1 · Australian Bureau of Statistics ↑ b c
- OECD, Revenue Statistics 2025, Chapter 1: Tax revenue trends 1965–2024 · oecd.org ↑ b c d e f g h i j k l m n
- OECD, Taxing Wages 2026, Overview · oecd.org ↑ b
- OECD, Consumption Tax Trends 2024 · oecd.org ↑
- OECD, Taxing Wages 2026, Australia chapter (2024–2025 income tax year) · oecd.org ↑