


Published
Section 01 · Two rates
What are Australia's company tax rates?
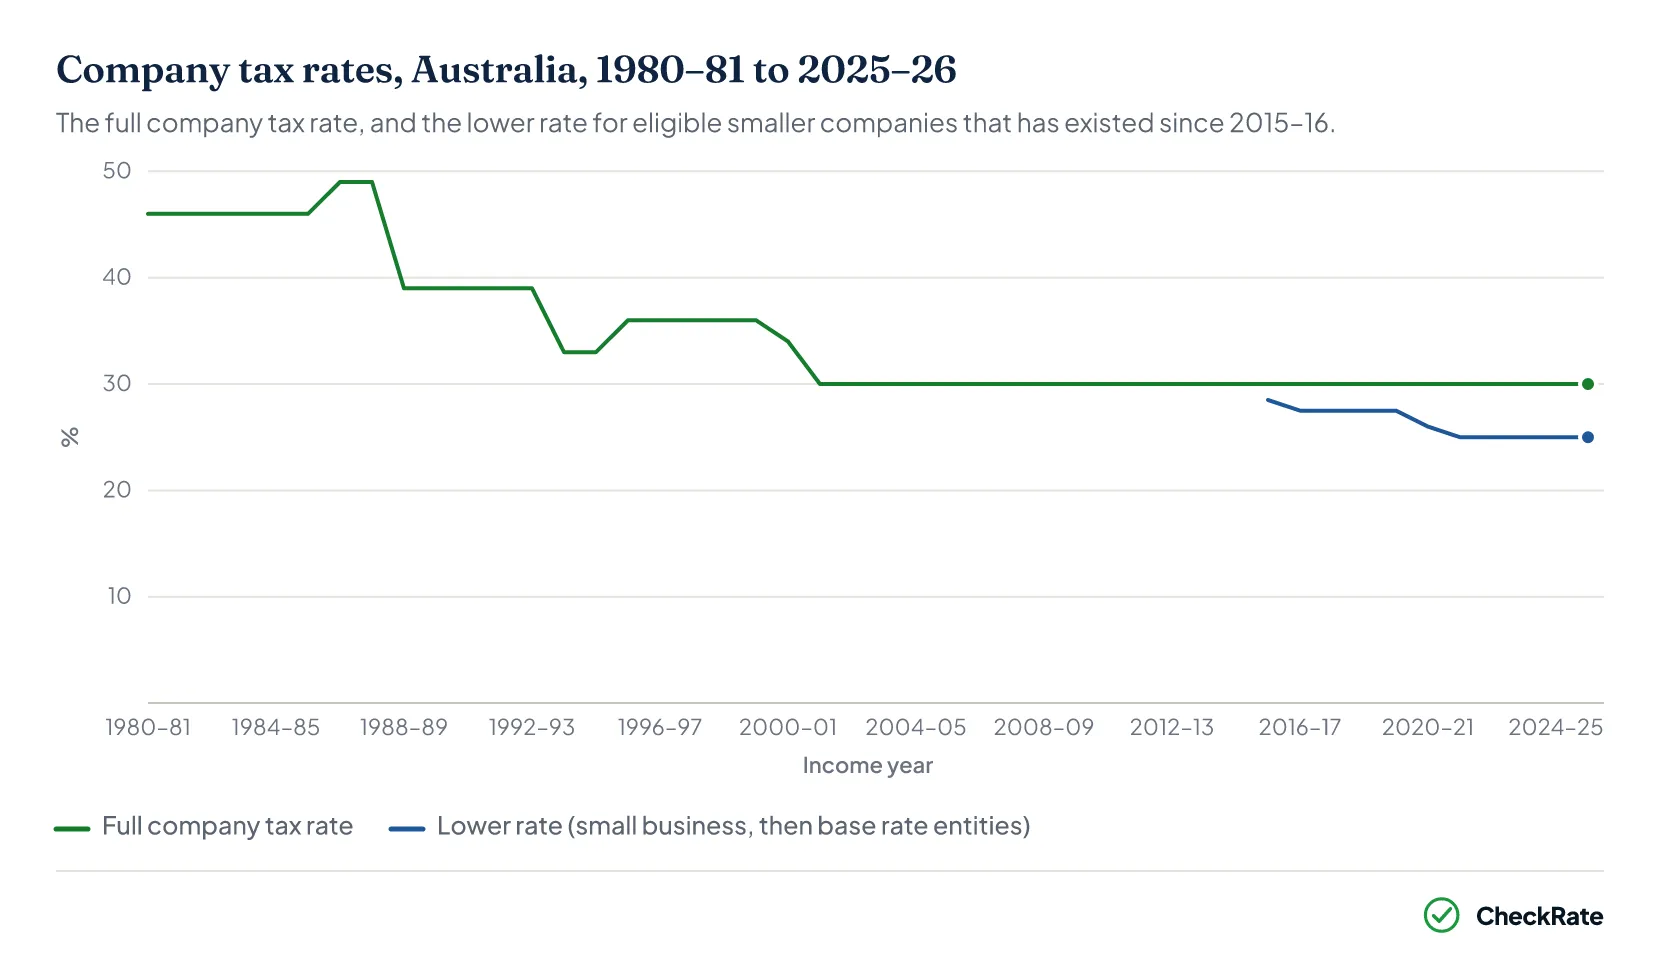
For most companies, Australia has two headline company tax rates. The full rate is 30%, and it applies to every company that is not a base rate entity. Base rate entities pay 25%, and have done so since the 2021–22 income year.1 These rates also apply to corporate unit trusts and public trading trusts. Companies pay tax on taxable income from the first dollar, with no tax-free threshold.
Both rates are flat rather than progressive. Which rate a company pays depends on its eligibility in each income year, not on how much taxable income it earns. The full rate has been 30% since 2001–02. A lower company tax rate has applied to eligible companies since 2015–16, starting at 28.5% for small business entities and reaching 25% for base rate entities from 2021–22.2 Before that, the full rate changed often. It was 46% in 1980–81, peaked at 49% in 1986–87, and fell in steps to 30% by 2001–02.3
How the progressive scale for individual income tax works is covered in the income tax brackets article.
Section 02 · Who pays which
Which companies pay the 25% rate and which pay 30%?
A company pays the 25% rate for an income year if it is a base rate entity in that year. Two conditions apply, and both must be met:
First, the company's aggregated turnover for the income year must be less than the aggregated turnover threshold, which is $50 million for 2018–19 and later years. Aggregated turnover counts the turnover of the company together with entities connected with it or affiliated with it.1
Second, no more than 80% of the company's assessable income for that year can be base rate entity passive income. Passive income for this test includes corporate distributions and their franking credits, royalties and rent, most interest income, gains on qualifying securities, net capital gains, and amounts from partnerships or trusts that trace back to passive income.1 Eligibility for the company tax rate is assessed separately for each income year. A company can be a base rate entity in one year and not the next, and turnover from earlier years is irrelevant.
In the ATO's example, an online sock retailer with turnover of less than the $50 million threshold has $104,000 of assessable income, of which $4,000 is interest. The interest is passive income, but it is only 3.8% of assessable income, so the company is a base rate entity and pays 25%. In a contrasting ATO example, a listed investment company earns all of its income from dividends and interest, so all of it is passive income and the company pays 30%, even though its turnover is less than the threshold.1
| Base rate entity company tax thresholds and rates, Australia, 2017–18 onwards | |||
|---|---|---|---|
| Income year | Aggregated turnover threshold | Rate for base rate entities | Rate for all other companies |
| 2017–18 | $25m | 27.5% | 30.0% |
| 2018–19 to 2019–20 | $50m | 27.5% | 30.0% |
| 2020–21 | $50m | 26.0% | 30.0% |
| 2021–22 onwards | $50m | 25.0% | 30.0% |
Source · ATO, Changes to company tax rates (QC 54063), last updated 27 May 2026.
Section 03 · Collections
How much company tax is collected each year?
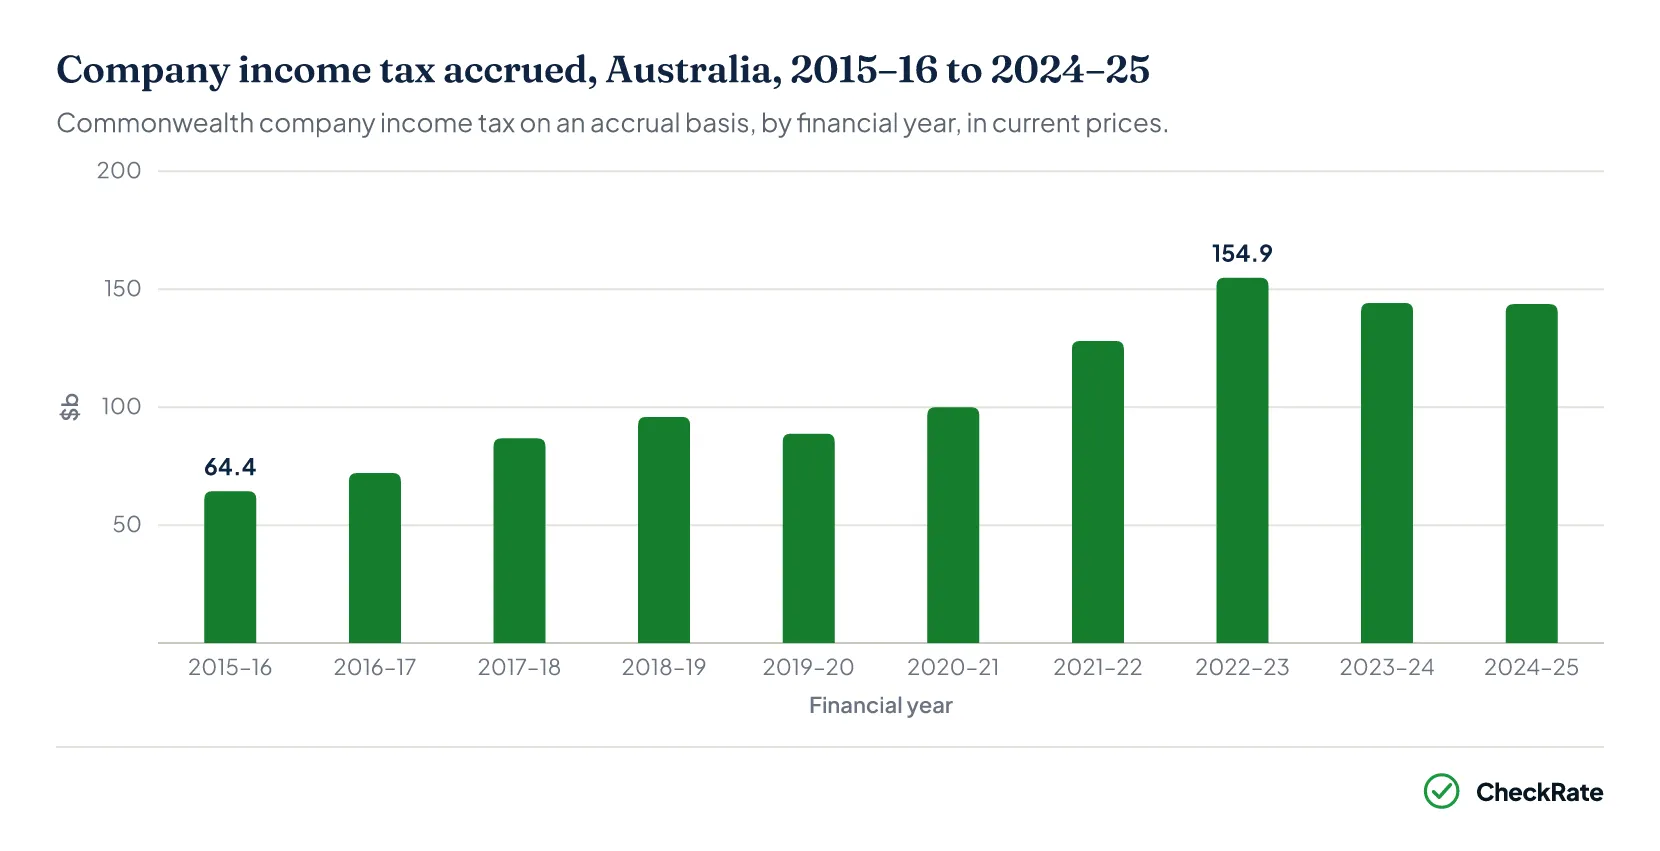
Company income tax accrued to the Commonwealth was $143.7 billion in 2024–25, according to ABS government finance statistics. That was $562 million less than the $144.2 billion recorded in 2023–24, and below the series peak of $154.9 billion in 2022–23.4 Only personal income tax, at $316.2 billion in 2024–25, raised more than company income tax among individual Commonwealth taxes; the GST raised $94.8 billion. Company income tax was 21.3% of the Commonwealth's $675.2 billion of taxation revenue in 2024–25. Across all levels of government together, it was 17.1% of the $839.0 billion collected.
Collections more than doubled over the nine years to 2024–25. Company income tax accrued in 2015–16 was $64.4 billion; by 2024–25 it was $143.7 billion, an increase of $79.3 billion or 123%, derived from the same ABS series. The series is not adjusted for inflation.
On the ATO's separate income-year measure, companies reported $144.6 billion of net tax in returns for 2023–24, up from $139.95 billion in 2022–23. Net tax is the amount payable after offsets and credits, and the 2023–24 statistics were compiled before all late returns were lodged.3 The ABS and ATO figures are close in size but are not the same measure, and this page uses the ATO figure wherever tax is being split by industry, company size or type.
How much income tax individuals paid, measured from the same ATO statistics, is covered in the average income tax article.
Section 04 · Industries and sizes
Which industries and company sizes pay the most company tax?
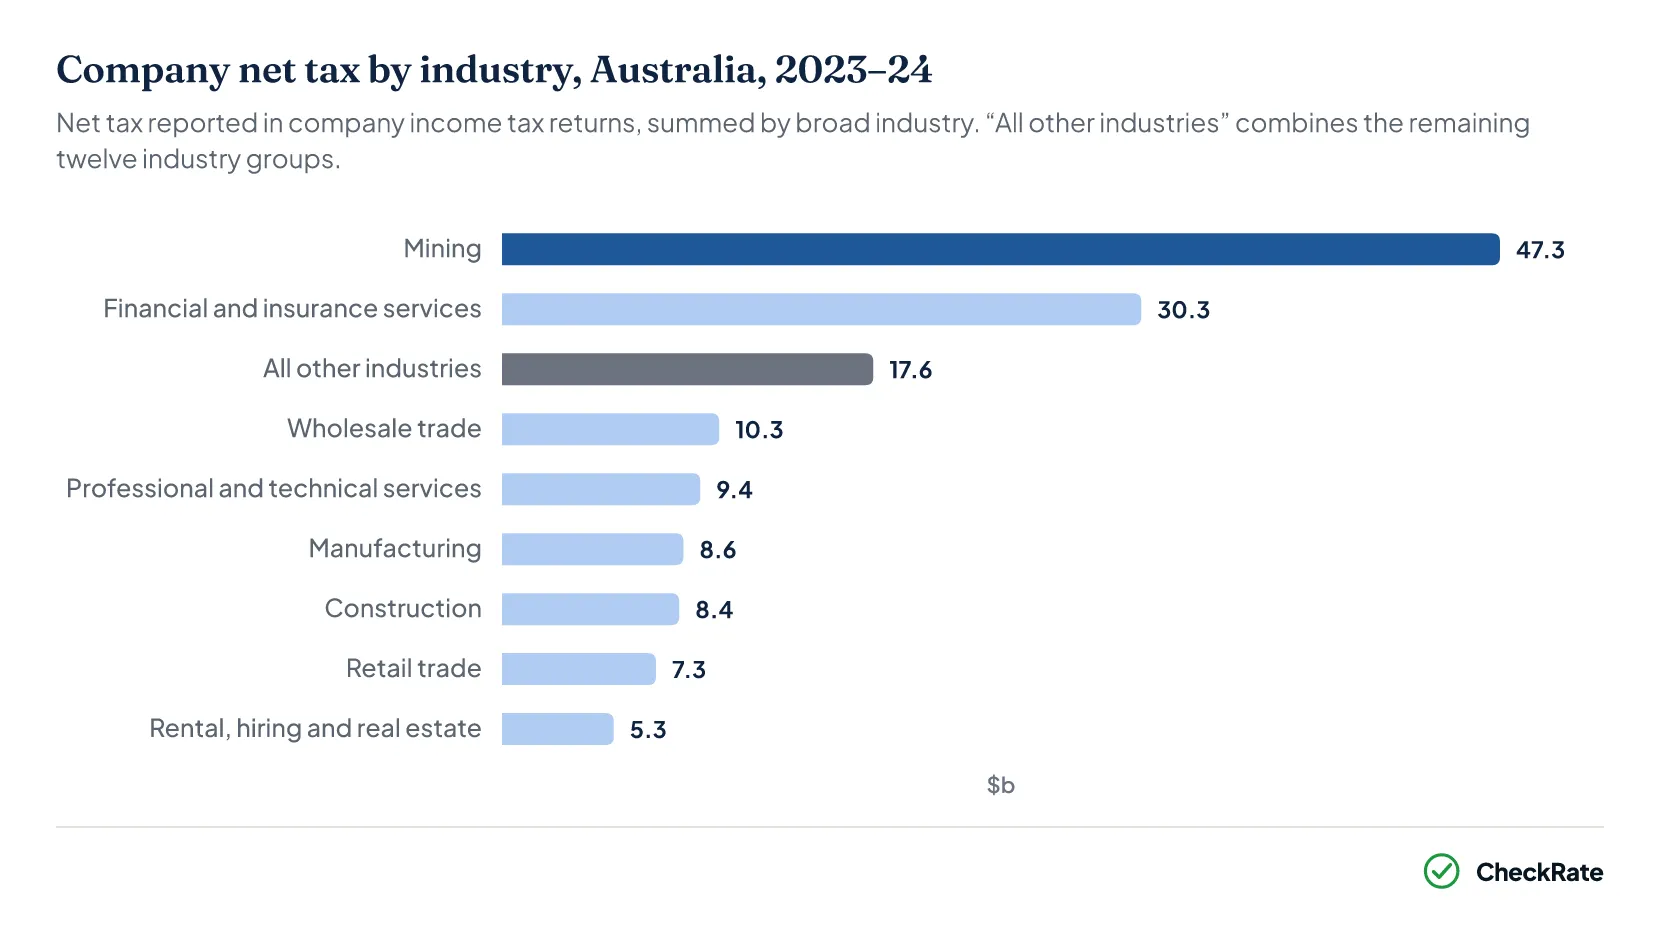
Mining companies paid more net tax than any other industry in 2023–24, at $47.3 billion, or 32.7% of all company net tax, derived by summing the industry rows of the ATO's company tables. The 8,073 mining companies that lodged returns represented 0.6% of all 1,317,013 companies that lodged.3 Financial and insurance services companies paid the next largest amount, $30.3 billion or 20.9%. Together, the two industries accounted for 53.7% of company net tax. No other industry paid more than 7.2%.
Company tax was also highly concentrated by company size. The ATO groups companies into size bands based on total income. In 2023–24 the 1,385 taxable companies in the very large band, with total income of $250 million or more, paid $89.2 billion of net tax. They accounted for 61.7% of all company net tax while representing about 0.1% of the companies that lodged returns. At the other end of the size bands, the 560,742 taxable micro and small companies, with total income of less than $10 million, together paid $29.1 billion, or 20.1% of the total, derived from the same table.3
Of the 1,317,013 companies that lodged a 2023–24 return, 607,113 had net tax payable, equal to 46.1%, derived by dividing the two counts. A company has no net tax payable when it makes a loss, has no taxable income, or has offsets and credits that reduce its tax to nil.3
| Company net tax by company size, Australia, 2023–24 | |||
|---|---|---|---|
| Company size (total income) | Taxable companies | Net tax | Share of net tax |
| Very large ($250m or more) | 1,385 | $89.2b | 61.7% |
| Medium ($10m to less than $100m) | 22,275 | $19.0b | 13.1% |
| Micro ($1 to less than $2m) | 484,015 | $15.1b | 10.5% |
| Small ($2m to less than $10m) | 76,727 | $14.0b | 9.7% |
| Large ($100m to less than $250m) | 1,622 | $6.9b | 4.8% |
| Loss, nil income and strata title bodies | 21,089 | $0.4b | 0.3% |
Source · ATO, Taxation statistics 2023–24, Company Table 7A.
Section 05 · Transparency data
How much tax do Australia's largest companies pay?
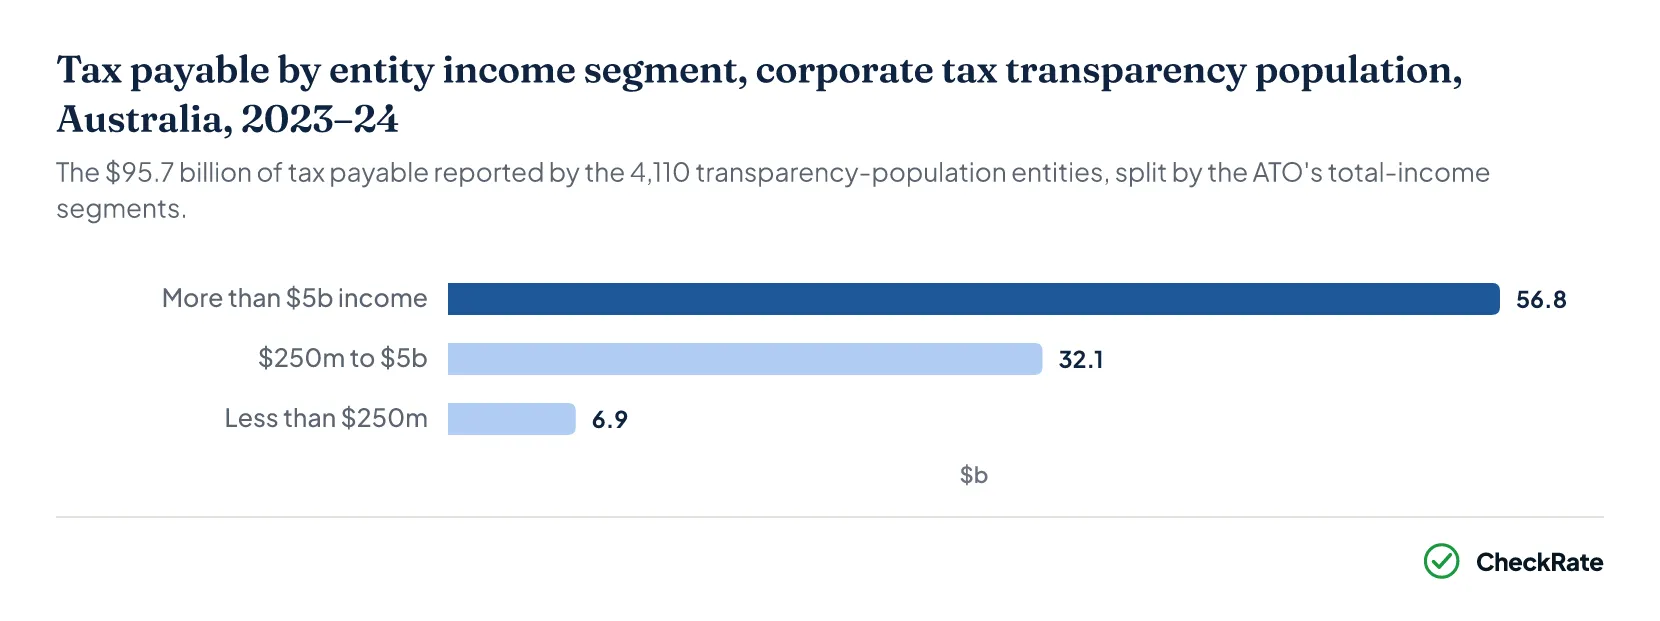
The 4,110 large entities covered by the ATO's Corporate tax transparency report reported $95.7 billion of tax payable for 2023–24. The report covers every corporate tax entity with total income of $100 million or more, plus entities with petroleum resource rent tax payable. The population grew by 125 entities, or 3.1%, from the year before.5 Tax payable decreased by 2.3% from 2022–23, but remained the second-highest total recorded in the transparency series. The report's Mining, Energy and Water segment paid $48.5 billion, or 50.6% of the population's tax payable.
Tax payable was concentrated among the highest-income entities. Entities with total income of more than $5 billion were 2.3% of the population and accounted for 59.3% of its tax payable. Entities with income of less than $250 million were the largest share of the population, at 54.4%, but accounted for 7.2% of its tax payable. Tax payable was also concentrated by ownership type. Australian public entities were 14.2% of the population and paid 48.1% of its tax payable. Foreign-owned entities were 41.7% and paid 39.0%. Australian private entities were 44.2% and paid 13.0%.5
Of the 4,110 entities, 2,974 reported tax payable, while 1,136, about 28%, reported nil tax payable. The report states that this was the lowest proportion in eleven years of transparency reporting. The report gives four reasons at the entity level: 13% of entities incurred an accounting loss, 4% incurred a tax loss, 2% used offsets at least equal to the tax otherwise payable, and 9% deducted tax losses from previous years. Nil tax payable does not necessarily mean an entity is outside the tax system. A company with deductions above its income incurs a tax loss, which can be carried forward and deducted against future taxable income.6
Section 06 · Three measures
Why total income, taxable income and tax payable are different measures
The transparency report publishes three numbers for each entity, taken from three labels on the company tax return: total income, taxable income and tax payable. In 2023–24 the population reported $3,278.8 billion of total income, $365.5 billion of taxable income and $95.7 billion of tax payable.5 For the 2023–24 population, each measure is smaller than the one before it, but each measures something different. Tax payable as a share of total income does not measure the rate of tax on profit.
Total income is gross income before expenses. A supermarket chain or fuel wholesaler can report high total income while operating on low profit margins, so total income is not a measure of profit. Taxable income is what remains after allowable deductions, including business expenses and carried-forward losses. Tax payable is the tax on taxable income after offsets and credits, including franking credits on dividends the company received and foreign income tax offsets. A company is taxed on its taxable income, not its total income.
| Total income, taxable income and tax payable, corporate tax transparency population, 2023–24 | |||
|---|---|---|---|
| Measure | What it captures | 2023–24 | Change on 2022–23 |
| Total income | Gross income before expenses and deductions | $3,278.8b | +4.5% |
| Taxable income | Income remaining after allowable deductions and losses | $365.5b | −3.8% |
| Tax payable | Tax on taxable income after offsets and credits | $95.7b | −2.3% |
Source · ATO, About the Corporate tax transparency report 2023–24, published 2 October 2025.
Section 07 · Imputation
How dividend imputation affects company profits and shareholders
Under Australia's dividend imputation system, company tax already paid can be recognised when profits are distributed to shareholders. When a company distributes profits on which company tax has already been paid, it can attach credits for that tax to the dividend, which the ATO calls franking the distribution. Recipients are taxed on the dividend plus the attached franking credit, and can use the credit as a tax offset.7 For a resident shareholder, company tax already paid on distributed profit can be credited against the shareholder's own tax, so the final tax on that profit depends on the shareholder's tax position rather than only on the company rate.
Companies reported paying $242.1 billion of franked dividends in 2023–24, compared with $73.7 billion in unfranked dividends, according to ATO taxation statistics.3 Companies also reported $598.8 billion in closing franking account balances, representing credits in their franking accounts that may be available to frank future distributions. A company's franking rate is based on its corporate tax rate for imputation purposes, which is determined using its previous year's turnover and income mix. This means the rate used to frank a distribution can differ from the company tax rate applying to that year's taxable income.
Section 08 · International
How Australia's company tax system compares internationally
Australia raised a larger share of its tax revenue from companies than most OECD countries in 2023. Taxes on corporate income and gains accounted for 19.5% of Australia's total tax revenue, compared with an OECD average of 11.9%, ranking Australia sixth among the 38 OECD countries.
Australia's overall tax take is below the OECD average on the same source: total tax was 29.9% of gross domestic product (GDP) in 2023, against an OECD average of 33.7%. The OECD also records Australia as having no social security contributions, while these contributions accounted for an average 25.5% of total tax revenue across the OECD countries.8
Australia's 30% full statutory company tax rate was also above the 24.1% average statutory rate across OECD members in 2025, an average that was down from 32.3% in 2000. Across the 145 jurisdictions in the OECD's Corporate Tax Statistics 2025 data, 26 had statutory corporate rates of 30% or more in 2025, including Australia. The highest rates were France at 36.1% and Colombia and Malta at 35.0%.
Across the broader group of 145 jurisdictions covered by the OECD dataset, rather than OECD members alone, the average statutory rate fell from 28.0% in 2000 to 21.7% in 2019, before reaching 21.2% in 2025.9
Australia
Statutory company tax rate 30% (25% for base rate entities), 2025
Corporate tax share of total tax revenue: 19.5%, 2023
Total tax to GDP: 29.9%, 2023
OECD
Average statutory rate across OECD members: 24.1%, 2025
Corporate tax share of total tax revenue, OECD average: 11.9%, 2023
Total tax to GDP, OECD average: 33.7%, 2023
Source · Australia: ATO published rates; OECD Revenue Statistics 2025 country note. OECD: OECD Corporate Tax Statistics 2025 and Revenue Statistics 2025.
Section 09
Company tax: quick answers
What is the company tax rate in Australia?
The company tax rate in Australia is 30% for companies that are not base rate entities. Base rate entities, companies with aggregated turnover of less than $50 million and 80% or less of assessable income as base rate entity passive income, pay 25%. The two rates have applied from the 2021–22 income year onwards.
How much company tax does Australia collect each year?
Company income tax accrued to the Commonwealth was $143.7 billion in 2024–25, according to ABS government finance statistics. On the ATO's separate income-year measure, companies reported $144.6 billion of net tax in 2023–24 income tax returns. The two figures measure different things. The ABS records accrued revenue by financial year, while ATO taxation statistics record the tax assessed on returns for an income year.
Which industry pays the most company tax in Australia?
Mining companies paid more net tax than any other industry in 2023–24, at $47.3 billion, which is 32.7% of all company net tax, derived from ATO taxation statistics industry tables. Financial and insurance services companies paid the next largest amount at $30.3 billion, and the two industries together accounted for 53.7% of company net tax.
How many companies pay tax in Australia?
Of the 1,317,013 companies that lodged income tax returns for the 2023–24 income year, 607,113 had net tax payable, equal to 46.1%. A company can have no net tax payable when it makes a loss, has no taxable income, or has offsets and credits that reduce its tax to nil.
Why do some large companies pay no income tax?
In the ATO's corporate tax transparency data for 2023–24, 1,136 of the 4,110 large entities, about 28%, reported nil tax payable. The ATO reports that 13% of entities incurred an accounting loss, 4% incurred a current-year tax loss, 2% used offsets at least equal to the tax otherwise payable, and 9% deducted prior-year losses against profit. At the economic-group level, the nil-tax share falls to 20% because many entities with nil tax payable belong to a group in which at least one entity paid tax.
What are franking credits?
Franking credits are credits for company tax already paid that a company can attach to dividends it pays. Recipients are taxed on the dividend plus the attached credit, and can use the credit as a tax offset, which prevents the same profit being taxed twice. In 2023–24, companies reported paying $242.1 billion of franked dividends, according to ATO taxation statistics.
References
- ATO, Changes to company tax rates (QC 54063) · ato.gov.au ↑ b c d
- ATO, Company tax rates (QC 17534) · ato.gov.au ↑
- ATO, Taxation statistics 2023–24, Individuals detailed tables (Tables 26, 27A, 27C) · data.gov.au ↑ b c d e f
- ABS, Taxation Revenue, Australia, 2024–25, Table 1 · Australian Bureau of Statistics ↑
- ATO, About the Corporate tax transparency report 2023–24 · ato.gov.au ↑ b c
- ATO, Corporate entity net losses and nil tax payable (CTT 2023–24) · ato.gov.au ↑
- ATO, Imputation (QC 47300) · ato.gov.au ↑
- OECD, Revenue Statistics 2025: Australia country note · oecd.org ↑
- OECD, Corporate Tax Statistics 2025, statutory corporate income tax rates · oecd.org ↑
- ATO, Taxation statistics 2023–24 · ato.gov.au