

Updated
The comparison is not a full buy-versus-rent decision model. It compares cash outflows, upfront purchase costs, mortgage rates, rent levels and housing stress, using the latest available official datasets. Buying can build equity over time, while renting usually has lower upfront and week-to-week cash costs.
The pressure is not only on buyers. At the 2021 Census, 32.2% of renting households spent more than 30% of income on rent, more than twice the share for mortgage holders.
- Weekly cost gap
- $114/wk
- Average weekly housing-cost gap between mortgage and renter households, 2019–20 ABS
- Owner-occupier rate
- 5.98%
- Average rate on outstanding owner-occupier home loans, April 2026
- Cash to settle in NSW
- $323k
- Estimated cash to settle a 20% deposit purchase in NSW, excluding concessions and lenders mortgage insurance
- Renters in housing stress
- 32.2%
- Share of renting households in housing stress, 2021 Census
 Average rent in Australia 2026: rent by state and cityAustralian rent inflation eased to 3.8% year-on-year in February 2026, down from a peak of 7.8% in August 2023. The pace of rent growth has roughly halved over the past 30 months, although rents thems…
 Average mortgage repayment in Australia: what homeowners pay each monthThe repayment for a new owner-occupier loan in Australia is around $4,006 a month, or $924 a week, based on a 30-year principal-and-interest term. The estimate uses the average 2025 loan size of $693,…
 How much does it cost to buy a house in Australia?Applying a 5% allowance for non-deposit upfront costs to the national median house price of $925,500 adds around $46,275 to the cash required at settlement. On the national mean dwelling price of $1,1…
Section 01 · The Big Picture
Is it cheaper to rent or buy a house in Australia?
On the latest official national household housing-cost data, renter households paid $114 a week less than mortgage households on average in 2019–20. In the 2019–20 ABS Housing Occupancy and Costs survey, mortgage households paid an average of $493 a week, compared with $379 a week for renter households.
The cash-flow gap is likely wider for many new buyers in 2026, because mortgage rates and dwelling prices have risen since the latest national survey period. But cash flow is only one part of the rent-vs-buy comparison. Renters do not build equity, do not benefit from property capital growth, and are more likely than mortgage holders to be in housing stress.
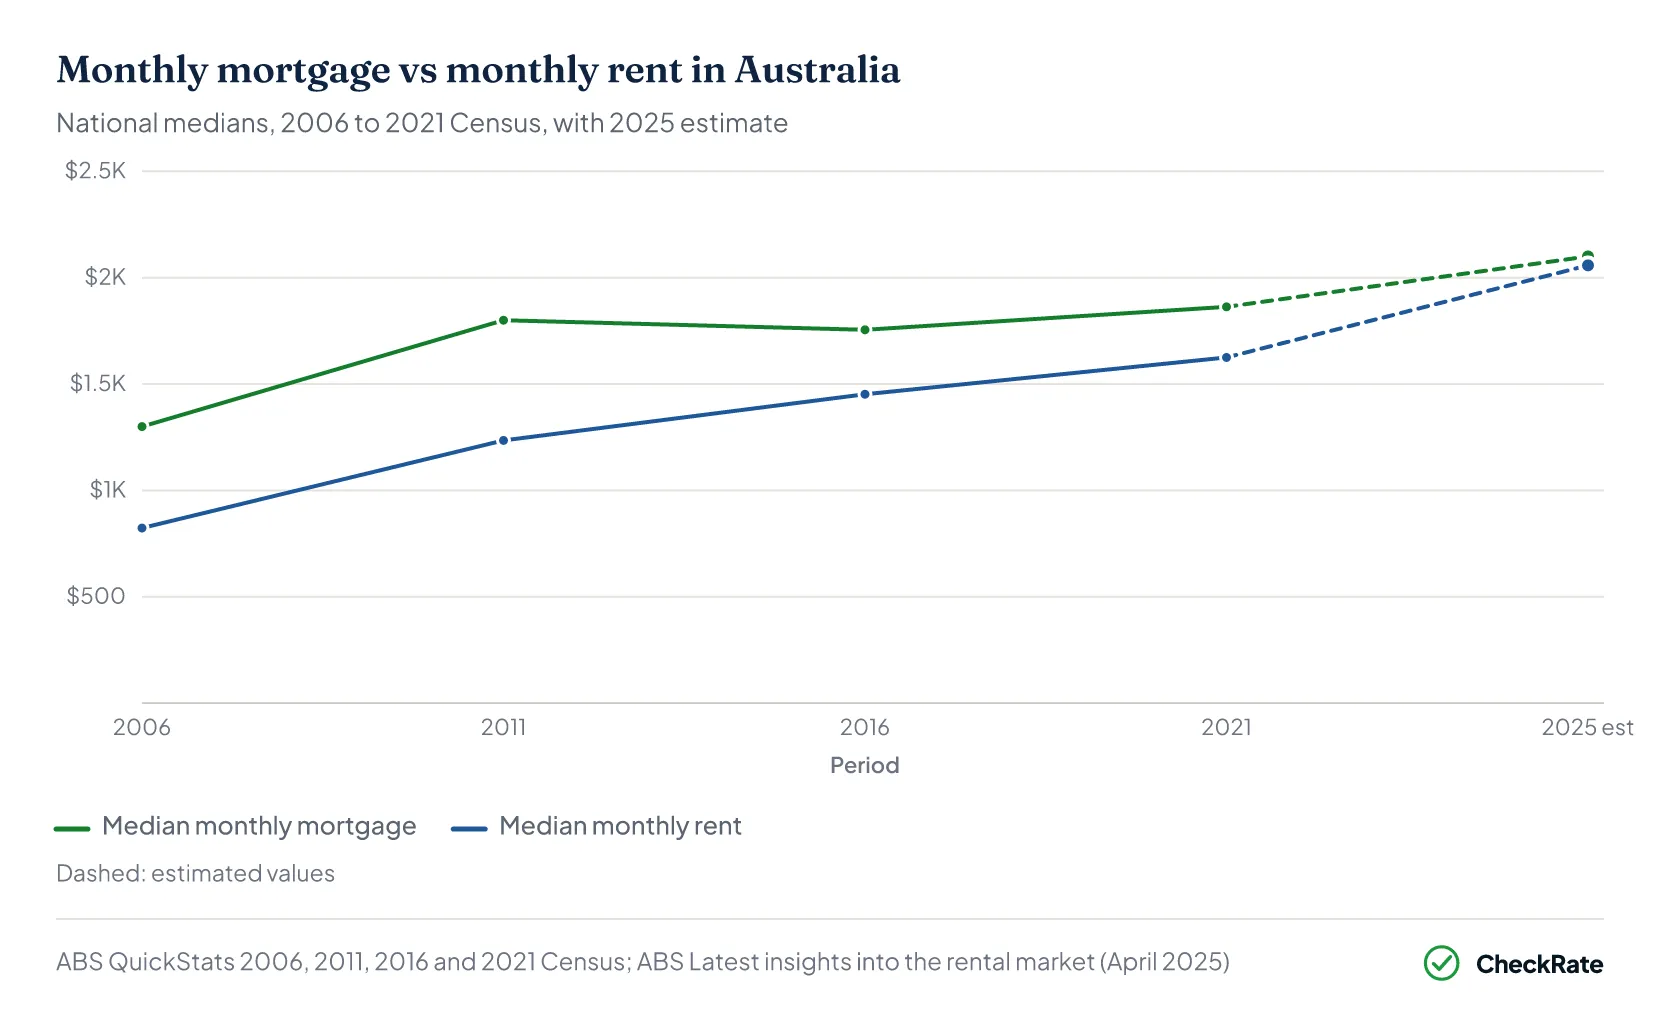
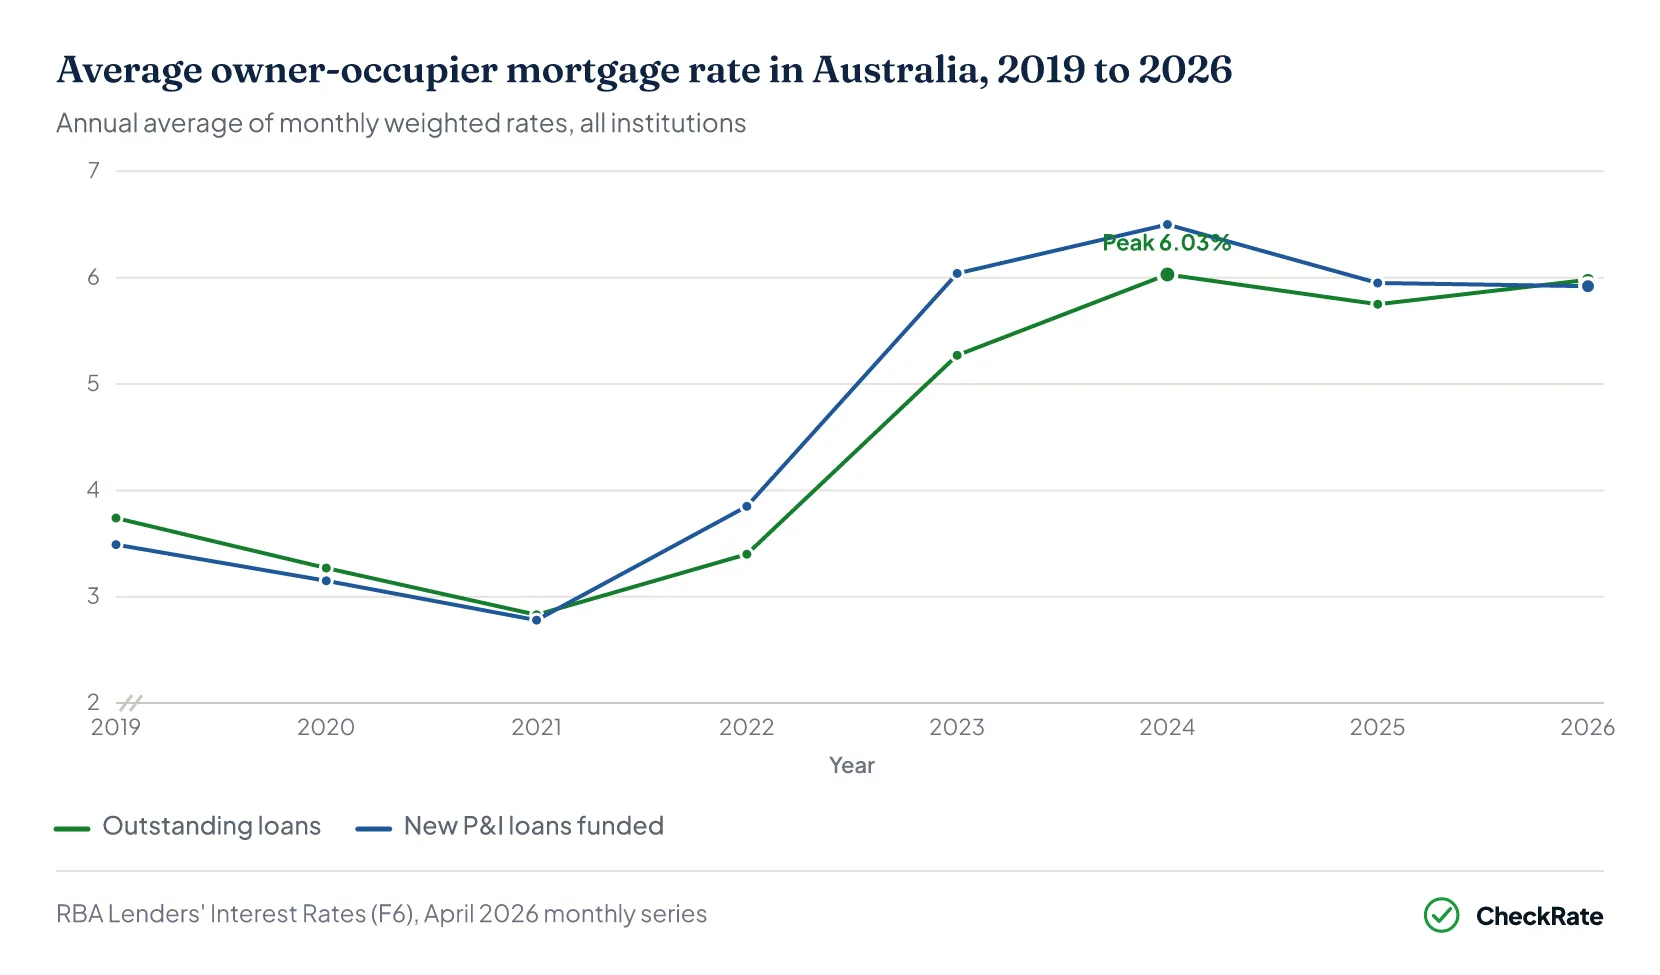
Since the 2019–20 survey period, higher rates and dwelling prices have increased modelled repayment costs for many new buyers. The average rate on outstanding owner-occupier home loans climbed from 2.83% in 2021 to 6.03% in 2024, before easing to 5.98% by April 2026.
On a $700,000 loan over 30 years, that rate change lifts monthly repayments from around $2,887 to $4,188, an increase of about $1,300 a month before fees. State median weekly rents have also risen, with Western Australia up 75% since June 2018. But for new buyers, higher mortgage rates have added a larger dollar amount to repayments than rent increases in many markets.
Cash flow is not the only measure. Mortgage repayments include some equity build-up through principal repayments, while rent is fully expensed. Mortgage households also tend to earn more than renter households, which is why renting can look cheaper in dollar terms but heavier as a share of income.
At the 2021 Census, 32.2% of renting households paid more than 30% of gross income on rent, equal to 915,317 households. Among mortgage households, the equivalent share was 14.5%. Renters were therefore more than twice as likely to sit above the standard housing-stress threshold.
Two factors are not captured by the cash-flow comparison:
- Capital growth belongs to the property owner, and
- Principal repayments can build equity over time.
The cash-flow test measures short-term payment differences. It does not measure long-term wealth outcomes.
What is the average weekly housing cost for mortgage holders in Australia?
Mortgage households paid an average of $493 a week nationally in 2019-20. By state and territory:
- NSW: $574
- ACT: $546
- NT: $534
- VIC: $501
- QLD: $447
- WA: $443
- SA: $390
- TAS: $346
Costs include mortgage repayments, council rates, water rates and body corporate fees. As a share of gross household income, mortgage households paid 16% on housing costs nationally, compared to 20% for private renters.
How much more does a mortgage cost than rent in Australia per year?
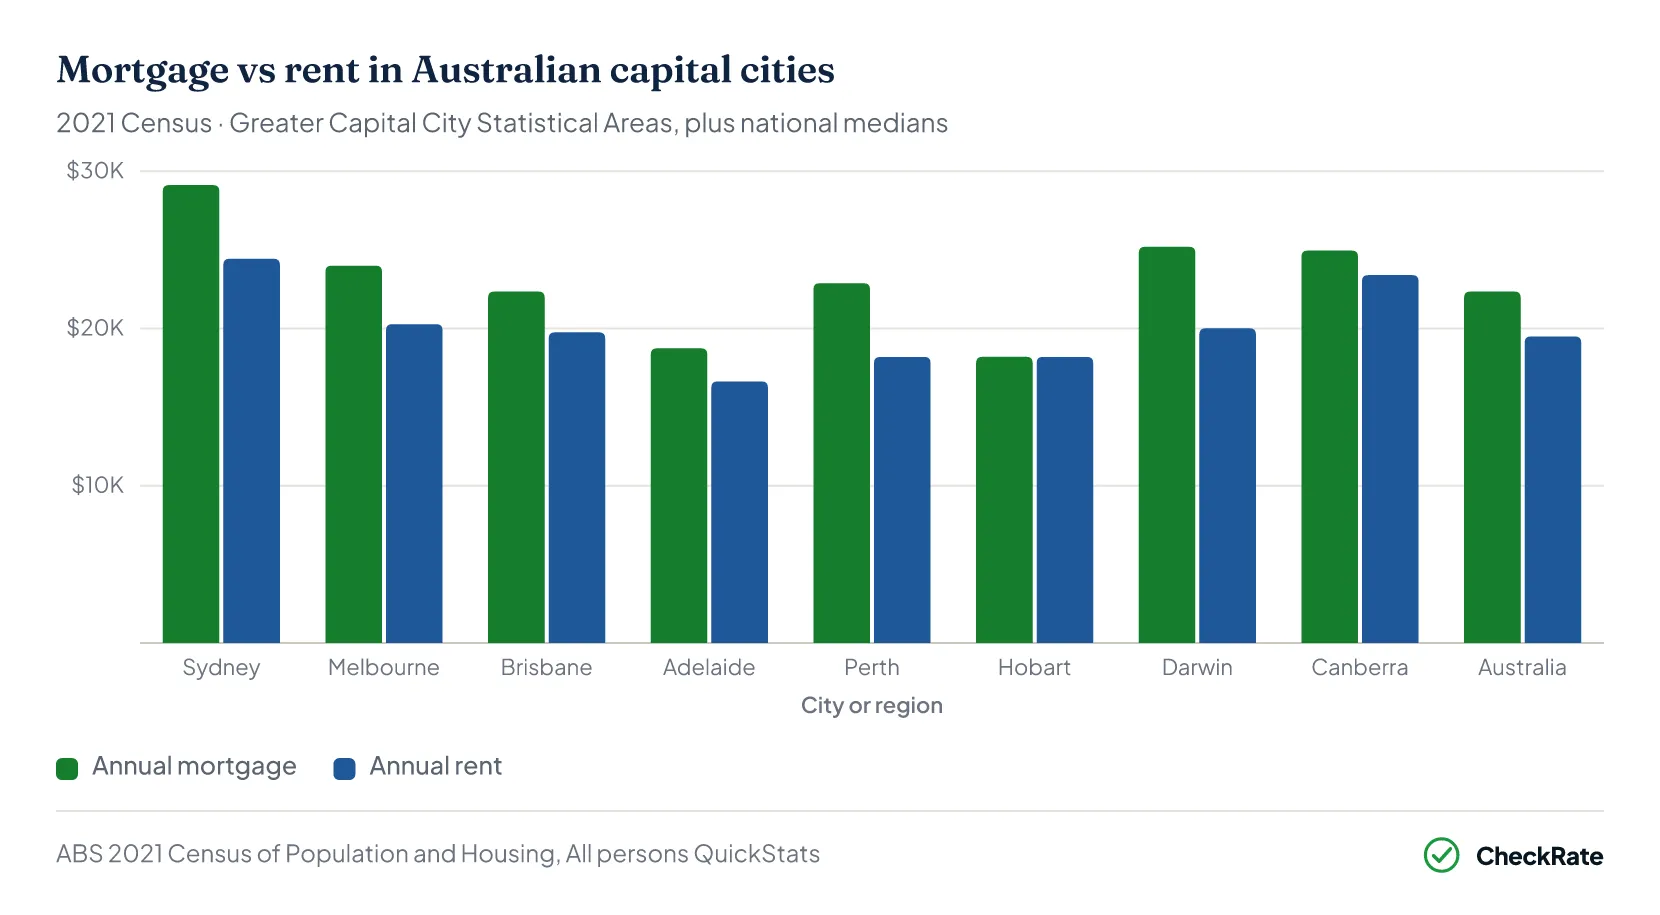
Nationally, the annual gap was about $5,928 in 2019–20, based on a $114 weekly difference between mortgage-holder and renter housing costs. City-level figures from the 2021 Census show a different comparison, using median monthly mortgage repayments against annualised median weekly rent:
- Greater Darwin: $5,180
- Sydney and Perth: $4,684
- Melbourne: $3,720
- Brisbane: $2,596
- Adelaide: $2,104
- Canberra: $1,560
- Hobart: $4 (essentially at parity)
Why can renting cost less in cash while buying builds equity?
Cash flow and long-term wealth are different measures. Mortgage repayments can include both interest and principal, with the principal portion building equity over time. Rent payments do not create property equity. Owners may also benefit from capital growth, although this depends on the property, market conditions and holding period. The cash-flow test measures which option costs less week to week. It does not measure long-term wealth outcomes, and ABS housing-cost comparisons across tenure types should be read carefully because the measures are constructed differently.
Section 02 · By City
Rent vs mortgage gap by Australian capital city
In the 2021 Census, Perth and Darwin had the highest mortgage-to-rent ratios among Australian capitals, at 1.26 times annualised rent. That means median mortgage repayments were about 26% higher than median rent on the cash-flow measure.
In every capital city, annualised median rent was lower than median mortgage repayments on the 2021 Census cash-flow measure, although the size of the gap varied:
- Sydney: 1.19 times
- Melbourne: 1.18 times
- Brisbane and Adelaide: 1.13 times
- Canberra: 1.07 times
- Hobart: at parity, with rent and mortgage figures within a few dollars
In dollar terms, Greater Sydney's median mortgage repayment was $2,427 a month, compared with median rent of $470 a week. Annualised, that left a $4,684 gap in favour of renting.
$5,180
Greater Darwin had the biggest annual gap of any capital Median mortgage households in Darwin paid $25,200 a year against $20,020 in median rent, the largest absolute gap. Sydney and Perth tied for second at $4,684 a year. Hobart was the only capital where the two figures were essentially equal.
Why the difference? The gap reflects both the structure of the Census data and the change in market conditions. The Census median includes borrowers at different repayment stages, while the 2026 estimate uses current prices and rates. NSW's mean dwelling price rose from around $1.05 million in the June 2021 quarter to $1.32 million in the March 2026 quarter.
Note: This is not a like-for-like Sydney price comparison. The 2026 scenario uses the NSW mean dwelling price because the ABS mean dwelling price series is published by state and territory, not by capital city.
| Median mortgage and rent values by Australian capital city | ||||||
|---|---|---|---|---|---|---|
| City / region | Monthly mortgage | Weekly rent | Annual mortgage | Annual rent | Annual gap | Ratio |
| Sydney | $2,427 | $470 | $29,124 | $24,440 | $4,684 | 1.19x |
| Melbourne | $2,000 | $390 | $24,000 | $20,280 | $3,720 | 1.18x |
| Brisbane | $1,863 | $380 | $22,356 | $19,760 | $2,596 | 1.13x |
| Adelaide | $1,562 | $320 | $18,744 | $16,640 | $2,104 | 1.13x |
| Perth | $1,907 | $350 | $22,884 | $18,200 | $4,684 | 1.26x |
| Hobart | $1,517 | $350 | $18,204 | $18,200 | $4 | 1.00x |
| Darwin | $2,100 | $385 | $25,200 | $20,020 | $5,180 | 1.26x |
| Canberra | $2,080 | $450 | $24,960 | $23,400 | $1,560 | 1.07x |
| Australia | $1,863 | $375 | $22,356 | $19,500 | $2,856 | 1.15x |
Source · ABS 2021 Census of Population and Housing, All persons QuickStats
How the rent-vs-mortgage gap has changed since 2011
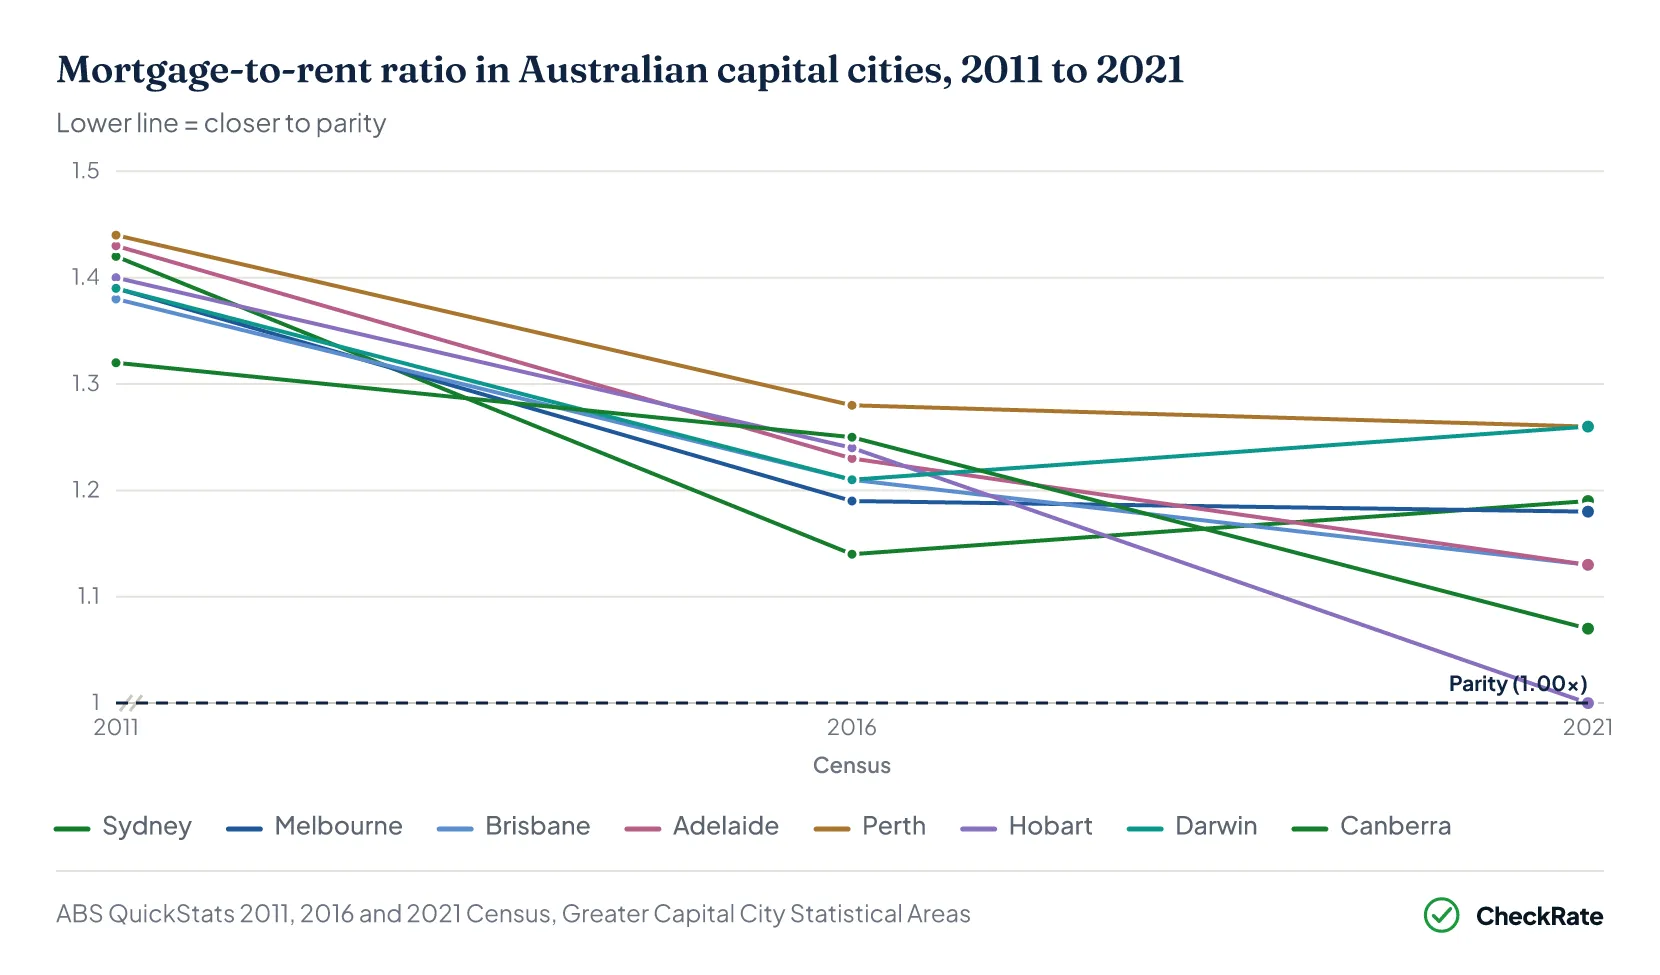
The mortgage-to-rent gap narrowed in every Australian capital across the last three Censuses. The unweighted average capital-city mortgage-to-rent ratio fell from 1.40 in 2011 to 1.22 in 2016, then to 1.15 in 2021.
Greater Hobart recorded the largest shift, falling from 1.40 times annualised rent in 2011 to 1.00 times in 2021. Sydney's annual gap fell by 40%, from $7,752 in 2011 to $4,684 in 2021.
The narrowing mainly reflects rents rising faster than median mortgage repayments over the decade. It does not necessarily mean buying became more affordable for new buyers, because Census mortgage medians include existing borrowers at different repayment stages.
Why did the rent-vs-mortgage gap narrow?
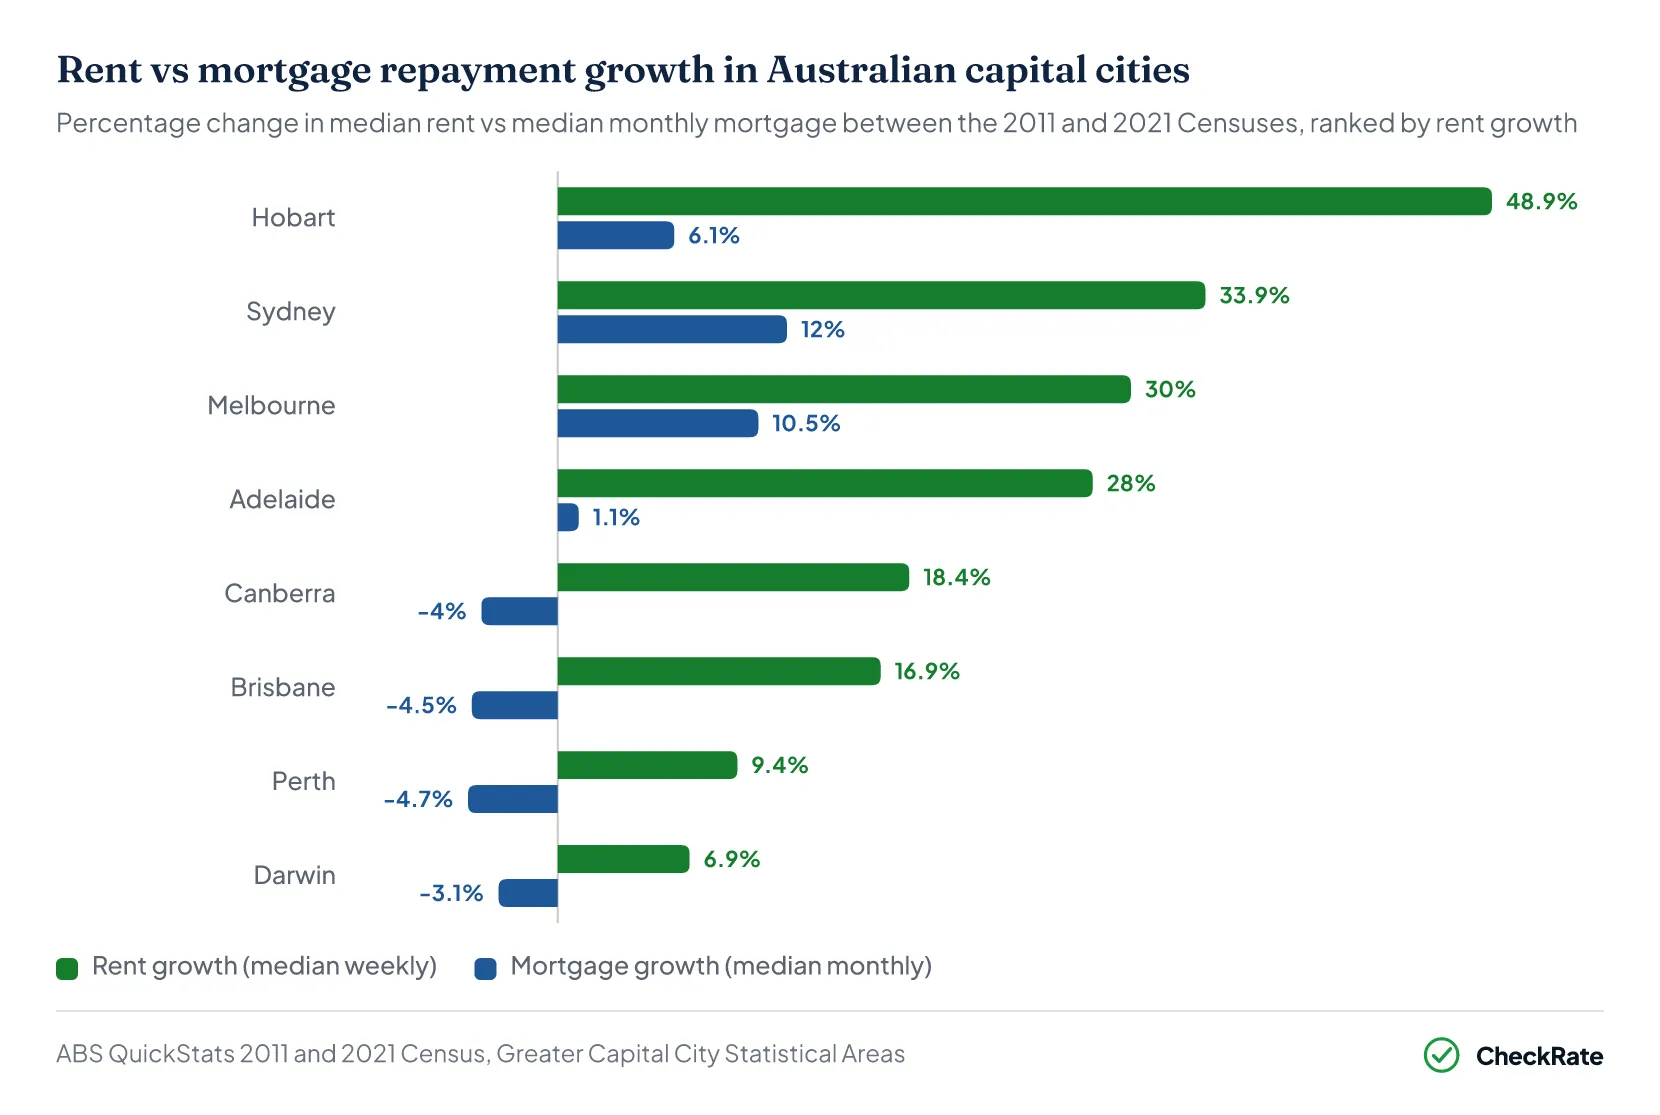
The gap narrowed because median rents increased faster than median mortgage repayments between the 2011 and 2021 Censuses. Median mortgage repayments did not fall across every capital, but rent growth was stronger in all cities.
Across the decade:
- Hobart: rent +49%, mortgage repayments +6%
- Adelaide: rent +28%, mortgage repayments +1%
- Brisbane, Perth, Darwin and Canberra: median monthly mortgage repayments fell slightly, while rents continued to rise
- Sydney: rent +34%, mortgage repayments +12%
Sydney recorded the largest dollar increase on both sides, but rent still grew almost three times as fast as median mortgage repayments in percentage terms.
| 2011 Census | 2016 Census | 2021 Census | |||||
|---|---|---|---|---|---|---|---|
| Capital | Rent ($/wk) | Mort ($/mo) | Rent ($/wk) | Mort ($/mo) | Rent ($/wk) | Mort ($/mo) | Change 2011 to 2021 |
| Sydney | $351 | $2,167 | $440 | $2,167 | $470 | $2,427 | Rent +34% · Mort +12% |
| Melbourne | $300 | $1,810 | $350 | $1,800 | $390 | $2,000 | Rent +30% · Mort +10% |
| Brisbane | $325 | $1,950 | $355 | $1,861 | $380 | $1,863 | Rent +17% · Mort -4% |
| Adelaide | $250 | $1,545 | $285 | $1,517 | $320 | $1,562 | Rent +28% · Mort +1% |
| Perth | $320 | $2,000 | $360 | $2,000 | $350 | $1,907 | Rent +9% · Mort -5% |
| Hobart | $235 | $1,430 | $260 | $1,402 | $350 | $1,517 | Rent +49% · Mort +6% |
| Darwin | $360 | $2,167 | $420 | $2,200 | $385 | $2,100 | Rent +7% · Mort -3% |
| Canberra | $380 | $2,167 | $380 | $2,058 | $450 | $2,080 | Rent +18% · Mort -4% |
Source · ABS QuickStats 2011, 2016 and 2021 Census, Greater Capital City Statistical Areas
Which Australian capital is the most balanced for rent vs buy?
Greater Hobart was the most balanced capital city in the 2021 Census. Median annualised mortgage repayments were $18,204 against $18,200 in annualised median rent. That left a gap of $4, or a mortgage-to-rent ratio of 1.00. Every other capital still favoured renting on cash flow:
- Canberra: 1.07 times
- Brisbane and Adelaide: 1.13 times
- Melbourne: 1.18 times
- Sydney: 1.19 times
- Perth and Darwin: 1.26 times (highest)
Are 2021 Census mortgage figures still relevant in 2026?
The 2021 Census mortgage figures are useful as a historical benchmark, but they are not a current new-buyer repayment estimate. Census medians cover all existing borrowers, including households with older loans taken out at lower rates. Using the March 2026 NSW mean dwelling price of about $1.32 million, a 20% deposit, the April 2026 average new owner-occupier principal-and-interest rate of 5.92% and a 30-year term, the modelled monthly repayment is about $6,300. That is around 2.5 times the 2021 Census Sydney median of $2,427.
Section 03 · Rate Cycle
How have interest rates changed the rent-vs-buy comparison?
Average mortgage rates more than doubled in three years, climbing from 2.83% on outstanding owner-occupier loans in 2021 to a peak of 6.03% in 2024. That increase added pressure to mortgage repayments, while rents moved through a separate rental-market cycle. Rates have since eased to 5.98% by April 2026, but they remain well above pre-2022 levels.
New borrowing tells a similar story. Owner-occupiers taking out new principal-and-interest loans in April 2026 paid an average of 5.92%, well above the 2.78% annual average paid by buyers across 2021. On a $700,000 loan over 30 years, that gap adds roughly $1,290 a month in repayments before fees.
Rate moves of that scale coincided with a sharp fall in lending activity:
- Total new home loan commitments hit a record 628,520 in 2021 under low-rate conditions
- Dropped to 465,432 by 2023 as rates climbed
- Recovered to 556,092 in 2025, but still 12% below the 2021 peak
First-home buyer commitments followed a similar pattern, but had not returned to their earlier peak by 2025. They finished 2025 at 119,464, against the 2020 stimulus peak of 137,720.
The takeaway from a rent-vs-buy angle: the cash gap measured in 2019–20 is likely wider for many new buyers in 2026. Higher rates flow through to mortgage repayments, while rent movements are measured through a separate rental-market cycle. Even with rates pulling back from the 2024 peak, owner-occupier servicing costs in 2026 still sit well above the levels in the latest official like-for-like comparison.
How much have rate rises added to mortgage repayments since 2021?
On a $700,000 loan over 30 years, the move from a 2.83% rate in 2021 to 5.92% in April 2026 lifted monthly repayments from around $2,887 to $4,161, a $1,274 increase, or about $15,300 per year. On a $1 million loan, the equivalent rate move adds around $1,819 a month. The peak 2024 rate of 6.03% pushed costs even higher before the recent easing.
Have mortgage rates fallen from their 2024 peak?
This article does not forecast interest rates. The data shows owner-occupier outstanding rates had eased from a peak of around 6.11% in mid-2024 to 5.98% in April 2026. Future rate movements depend on RBA decisions and lender pricing outside this dataset.
Section 04 · Upfront Cost
How much cash is needed upfront to buy a house in Australia?
A 20% deposit purchase in NSW requires an estimated $322,610 in cash to settle. That breaks down as a $264,960 deposit, around $54,900 in transfer duty, and about $2,750 in registration, conveyancing and inspection fees. The deposit becomes equity, while transfer duty and purchase fees are upfront transaction costs.
The week-to-week cash gap is important, but the upfront cost of buying creates a separate barrier before settlement.
By state, the estimated transfer-duty cost on the mean dwelling looks like this:
- NSW: around $54,900 on a $1,324,800 mean dwelling, the highest in raw duty dollars
- VIC: around $51,900, and the steepest relative to price at about 5.5%, with the mean dwelling sitting just under the state's $960,000 flat-rate threshold
- WA and SA: around $47,900 and $47,400
- TAS and NT have the lowest duty load, around $29,800 and $29,600 respectively
None of these figures include any first-home buyer concession, which can reduce or remove duty in most states for properties below set thresholds. Once settled, repayments at the April 2026 average new owner-occupier principal-and-interest rate of 5.92% come to around $6,300 a month over a standard 30-year term in NSW.
- Total cash to settle
- $322,610
- Deposit plus transfer duty plus $2,750 in registration, conveyancing and inspection fees
- Deposit (becomes equity)
- $264,960
- Stamp duty (non-recoverable)
- $54,900
- Mean dwelling price (Mar 2026)
- $1.32M
- Loan amount at 20% deposit
- $1.06M
- Monthly mortgage at 5.92% over 30 years
- $6,300
- Total cash to settle
- $244,070
- Deposit plus transfer duty plus $2,750 in registration, conveyancing and inspection fees
- Deposit (becomes equity)
- $189,420
- Stamp duty (non-recoverable)
- $51,900
- Mean dwelling price (Mar 2026)
- $947,100
- Loan amount at 20% deposit
- $757,680
- Monthly mortgage at 5.92% over 30 years
- $4,504
- Total cash to settle
- $272,590
- Deposit plus transfer duty plus $2,750 in registration, conveyancing and inspection fees
- Deposit (becomes equity)
- $224,740
- Stamp duty (non-recoverable)
- $45,100
- Mean dwelling price (Mar 2026)
- $1.12M
- Loan amount at 20% deposit
- $898,960
- Monthly mortgage at 5.92% over 30 years
- $5,343
- Total cash to settle
- $244,770
- Deposit plus transfer duty plus $2,750 in registration, conveyancing and inspection fees
- Deposit (becomes equity)
- $194,620
- Stamp duty (non-recoverable)
- $47,400
- Mean dwelling price (Mar 2026)
- $973,100
- Loan amount at 20% deposit
- $778,480
- Monthly mortgage at 5.92% over 30 years
- $4,627
- Total cash to settle
- $271,350
- Deposit plus transfer duty plus $2,750 in registration, conveyancing and inspection fees
- Deposit (becomes equity)
- $220,700
- Stamp duty (non-recoverable)
- $47,900
- Mean dwelling price (Mar 2026)
- $1.1M
- Loan amount at 20% deposit
- $882,800
- Monthly mortgage at 5.92% over 30 years
- $5,247
- Total cash to settle
- $182,610
- Deposit plus transfer duty plus $2,750 in registration, conveyancing and inspection fees
- Deposit (becomes equity)
- $150,060
- Stamp duty (non-recoverable)
- $29,800
- Mean dwelling price (Mar 2026)
- $750,300
- Loan amount at 20% deposit
- $600,240
- Monthly mortgage at 5.92% over 30 years
- $3,568
- Total cash to settle
- $151,810
- Deposit plus transfer duty plus $2,750 in registration, conveyancing and inspection fees
- Deposit (becomes equity)
- $119,460
- Stamp duty (non-recoverable)
- $29,600
- Mean dwelling price (Mar 2026)
- $597,300
- Loan amount at 20% deposit
- $477,840
- Monthly mortgage at 5.92% over 30 years
- $2,840
- Total cash to settle
- $241,450
- Deposit plus transfer duty plus $2,750 in registration, conveyancing and inspection fees
- Deposit (becomes equity)
- $203,600
- Stamp duty (non-recoverable)
- $35,100
- Mean dwelling price (Mar 2026)
- $1.02M
- Loan amount at 20% deposit
- $814,400
- Monthly mortgage at 5.92% over 30 years
- $4,841
Upfront cost dashboard by Australian state: estimated cash to settle with a 20% deposit, based on the March 2026 mean dwelling price. Stamp duty figures use standard non-first-home-buyer transfer-duty schedules applied to the ABS state mean dwelling price. They exclude first-home buyer concessions, pensioner concessions, lenders mortgage insurance, and property-specific costs. Fees are estimated at $2,750 for registration, conveyancing and inspection. Monthly repayment uses the April 2026 average new owner-occupier principal-and-interest rate of 5.92% over a 30-year principal-and-interest term.
A 5% deposit cuts the deposit cash, but it does not cut the duty. A NSW buyer using a 5% deposit still needs around $123,900 in cash to settle, plus lenders mortgage insurance on top.
A renter in the same scenario can typically move in with a four-week bond and one or two weeks of rent in advance. That gap is the main reason renting has lower upfront cash costs in the first few years.
How much deposit do you need to buy a house in Australia?
A standard 20% deposit on the Mar 2026 mean dwelling price ranges from $119,460 in the Northern Territory to $264,960 in NSW. The national mean dwelling was $1,111,100, which means a $222,220 deposit at 20%.
Smaller deposits down to 5% are possible, but typically require lenders mortgage insurance (LMI), which is added to the loan and can lift the total borrowed by several percentage points.
How much is stamp duty in Australia by state?
Standard non-FHB transfer duty on Mar 2026 state mean dwelling prices:
- NSW: around $54,900 (highest)
- VIC: around $51,900
- WA: around $47,900
- SA: around $47,400
- QLD: around $45,100
- ACT: around $35,100
- TAS: around $29,800
- NT: around $29,600 (lowest)
First-home buyer concessions can reduce or remove duty in most states for properties below set thresholds.
Section 05 · Rents Climb
How much have rents increased in Australia since 2018?
Annual rent inflation peaked at 7.8% in August 2023 and eased to 3.6% by May 2026, less than half the peak rate. Renting has lower cash-flow costs than buying in the article's mortgage comparison, but rent is not a fixed cost. Dollar rent levels remain well above the 2018 baseline in every state and territory.
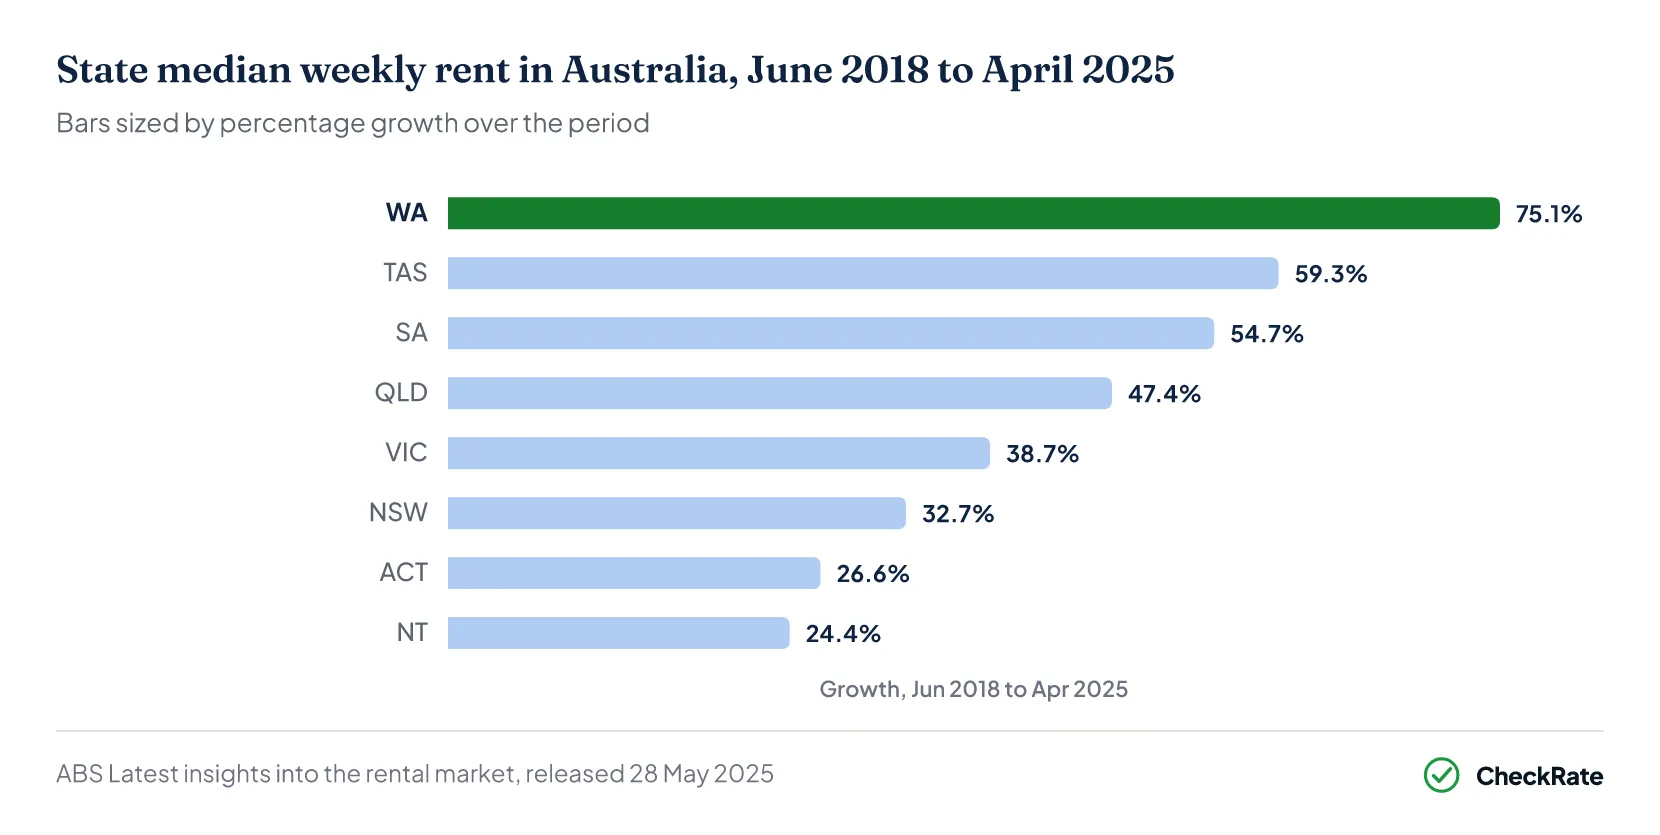
State median weekly rents grew between June 2018 and April 2025 as follows:
- WA: +75% ($350 to $613)
- TAS: +59% ($270 to $430)
- SA: +55% ($320 to $495)
- QLD: +47% ($380 to $560)
- VIC: +39% ($375 to $520)
- NSW: +33% ($490 to $650), the slowest mainland growth, but still the highest dollar median
- ACT: +27% ($470 to $595)
- NT: +24% ($450 to $560)
In cash terms, a tenant on the NSW state median paid about $490 a week in mid-2018 and $650 a week by April 2025. Applying national CPI rent movements to May 2026 gives an indicative estimate of around $675 a week.
Why have rents risen so much in Western Australia?
Western Australia has had the largest rent rise of any state, with 75% growth from June 2018 to April 2025. The state median climbed from $350 to $613 a week. Perth-driven housing inflation also showed the highest annual reading among capital cities in early 2026, at 14.8% in Feb 2026. WA's rapid rent growth may reflect strong population inflows and tight rental supply.
Section 06 · Income Stress
Are renters or mortgage holders under more housing stress?
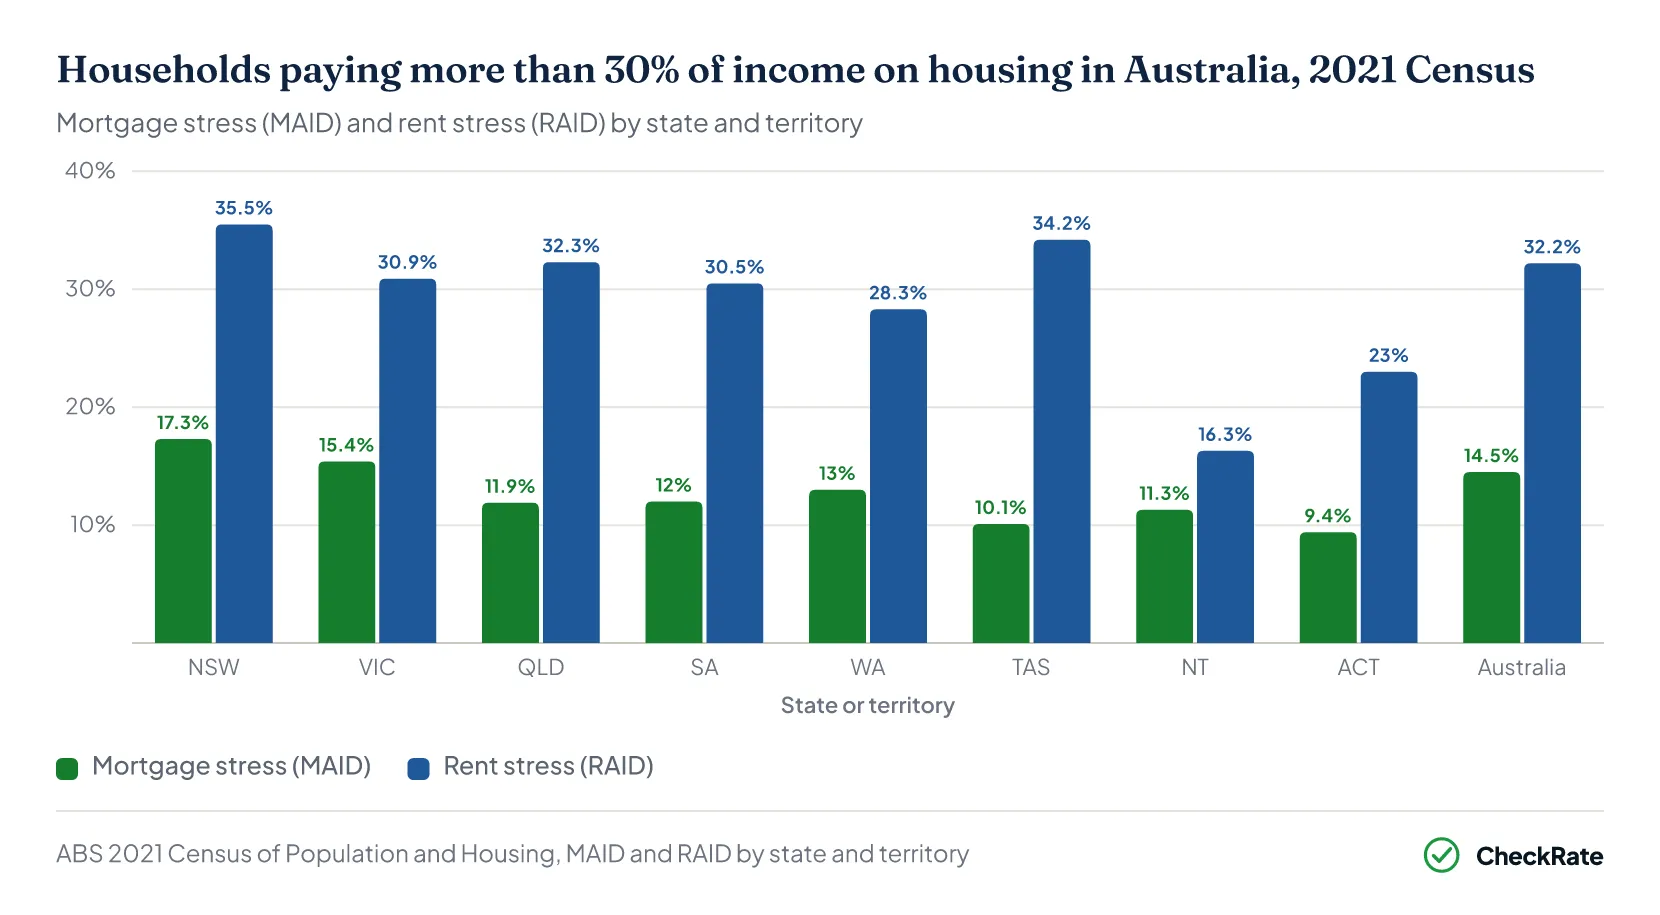
32.2% of renting households were in housing stress against just 14.5% of mortgage households at the 2021 Census, making renters more than twice as likely to spend over 30% of gross household income on housing. In total, 915,317 renter households nationally sat above this threshold.
Renting has lower cash-flow costs than mortgage holding in the latest ABS housing-cost data, but renters face higher housing-stress rates as a share of income.
The difference reflects the different income profiles of renter and mortgage households. Mortgage households earn more on average than renter households. Mortgage holders paid 16% of gross income on housing costs in 2019–20, while renters paid 20%. Among lower-income renters, 58% of private-renter households in the bottom income bracket were already spending more than 30% of gross income on rent in 2019–20, before the recent run-up in rents.
On the cash-flow measures used in this article, renting costs less than mortgage holding. But the income-share comparison points in the other direction. Renters pay less in dollars, but more as a share of income, and rent payments do not build property equity.
Are renters or mortgage holders under more housing-cost pressure in Australia?
It depends on the question:
- On dollar costs: mortgage holders pay more, with a $114-a-week gap (2019-20).
- On affordability share: renters paid a higher share of income, at 20% of gross income on housing costs against 16% for mortgage households.
- On housing stress: the gap was wider, with 32.2% of renters in stress vs 14.5% of mortgage households at the 2021 Census.
How many Australian renters are in housing stress?
At the 2021 Census, 915,317 renting households (32.2% of the 2.84 million renter households where data was available) paid more than 30% of gross income on rent. By state, the share ranged from 16.3% in the Northern Territory (partly reflecting below-market public-housing tenancies) to 35.5% in NSW. NSW, TAS, QLD and VIC all sat above 30%, while the ACT and NT sat below.
Section 07 · Calculator
Rent vs buy calculator: compare cash costs by state, deposit and holding period
On the default settings (NSW, 20% deposit, seven-year holding period and 5.92% mortgage rate), the buying scenario requires around $605,239 more cumulative cash out than the renting scenario over seven years. This includes the deposit as cash out, even though the deposit becomes buyer equity rather than a non-recoverable cost.
Most of the non-recoverable upfront gap comes from transfer duty and purchase fees, while the deposit affects how much cash is needed before settlement. On running cash flow alone, the renting scenario has about $40,758 less annual cash out than the buying scenario, before capital growth, principal equity, maintenance, insurance, strata costs or investment returns on unused cash are considered.
National averages hide a wide spread of household scenarios. The figures below set out the default scenario side by side. They should be read as a cash-flow comparison, not a full rent-versus-buy wealth comparison.
Buy vs rent cash flow calculator
Compare the cash you would put in to buy a typical home in your state against renting it, over the years you expect to stay.
References
- ABS Housing Occupancy and Costs, 2019-20 financial year · Australian Bureau of Statistics
- ABS 2021 Census of Population and Housing, All persons QuickStats · Australian Bureau of Statistics
- ABS Total Value of Dwellings, March Quarter 2026 · Australian Bureau of Statistics
- RBA, Lenders' Interest Rates (Statistical Table F6) — housing rates, February 2026 · Reserve Bank of Australia
- ABS Lending Indicators, March quarter 2026 · Australian Bureau of Statistics
- ABS – Consumer Price Index, Australia, May 2026 · Australian Bureau of Statistics
- ABS Latest insights into the rental market (28 May 2025) · Australian Bureau of Statistics
- Revenue NSW, Transfer duty · revenue.nsw.gov.au
- State Revenue Office Victoria, Land transfer (stamp) duty · sro.vic.gov.au
- Queensland Revenue Office, Transfer duty rates · qro.qld.gov.au
- RevenueSA, Rate of stamp duty · revenuesa.sa.gov.au
- WA Department of Treasury and Finance, Transfer duty · wa.gov.au
- State Revenue Office Tasmania, Property transfer duties · sro.tas.gov.au
- NT Government, Stamp duty when buying or selling a home — conveyance calculator · nt.gov.au
- ACT Revenue Office, Conveyance duty for non-commercial property · revenue.act.gov.au